
Viewing Underlying Chart Data
There are several ways to dig in and understand the data in your favorite chart.
- How do I view all the numbers used to compute the data I see in the chart?
- What is the data that is aggregated to create the element in the chart?
- How did we calculate the chart?
Let's take a look using the charts in TMS Source Metrics dashboard as an example.
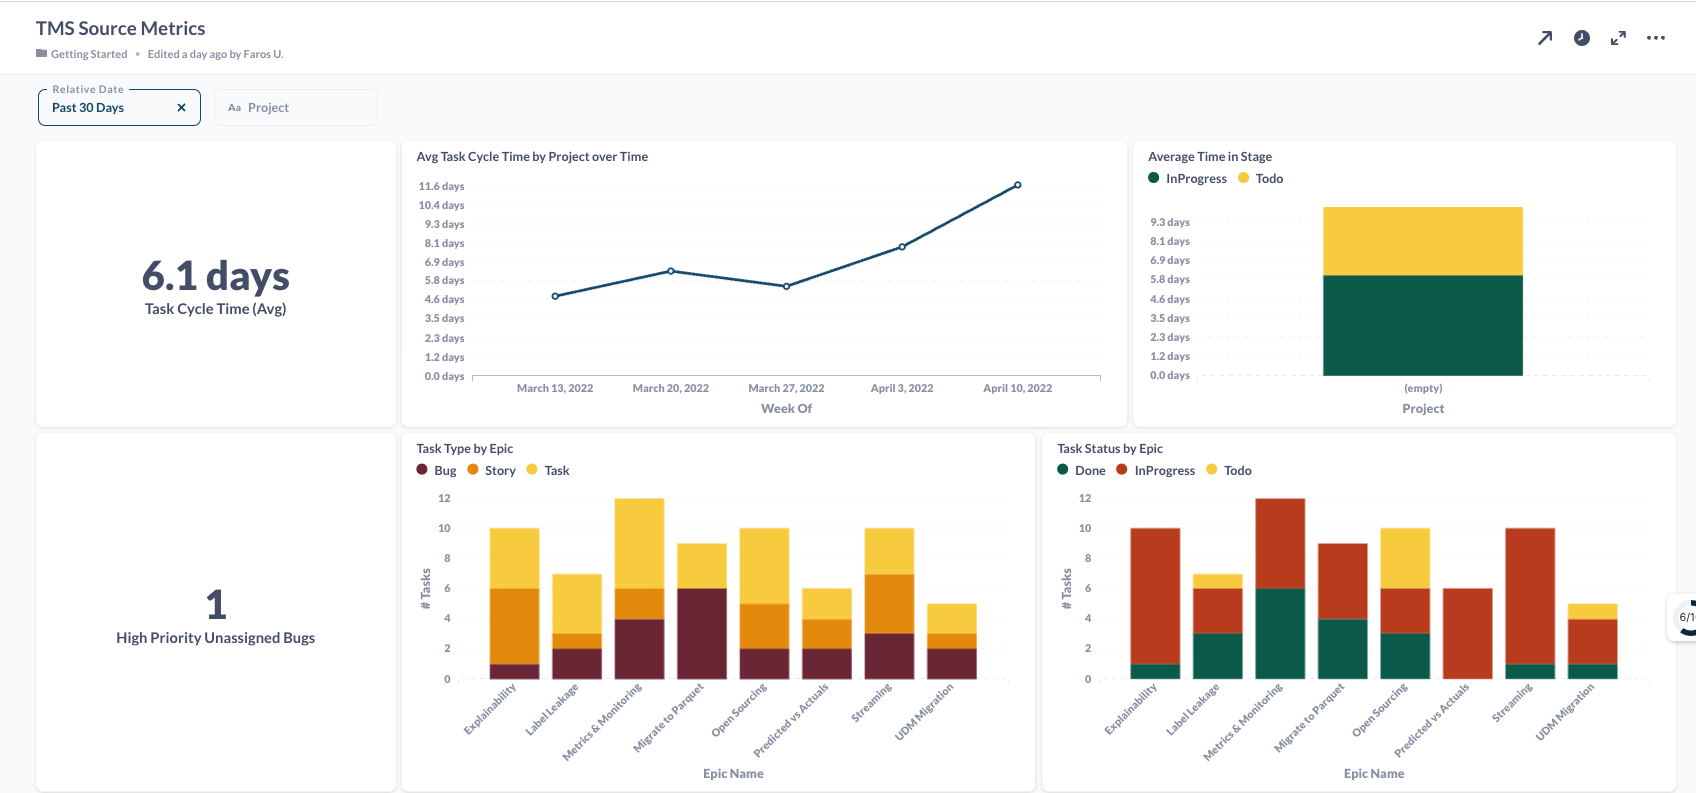
1. Given a chart, how do I view all the numbers used to compute values in the chart?
Just click the chart title to enlarge the chart, and click the table view.
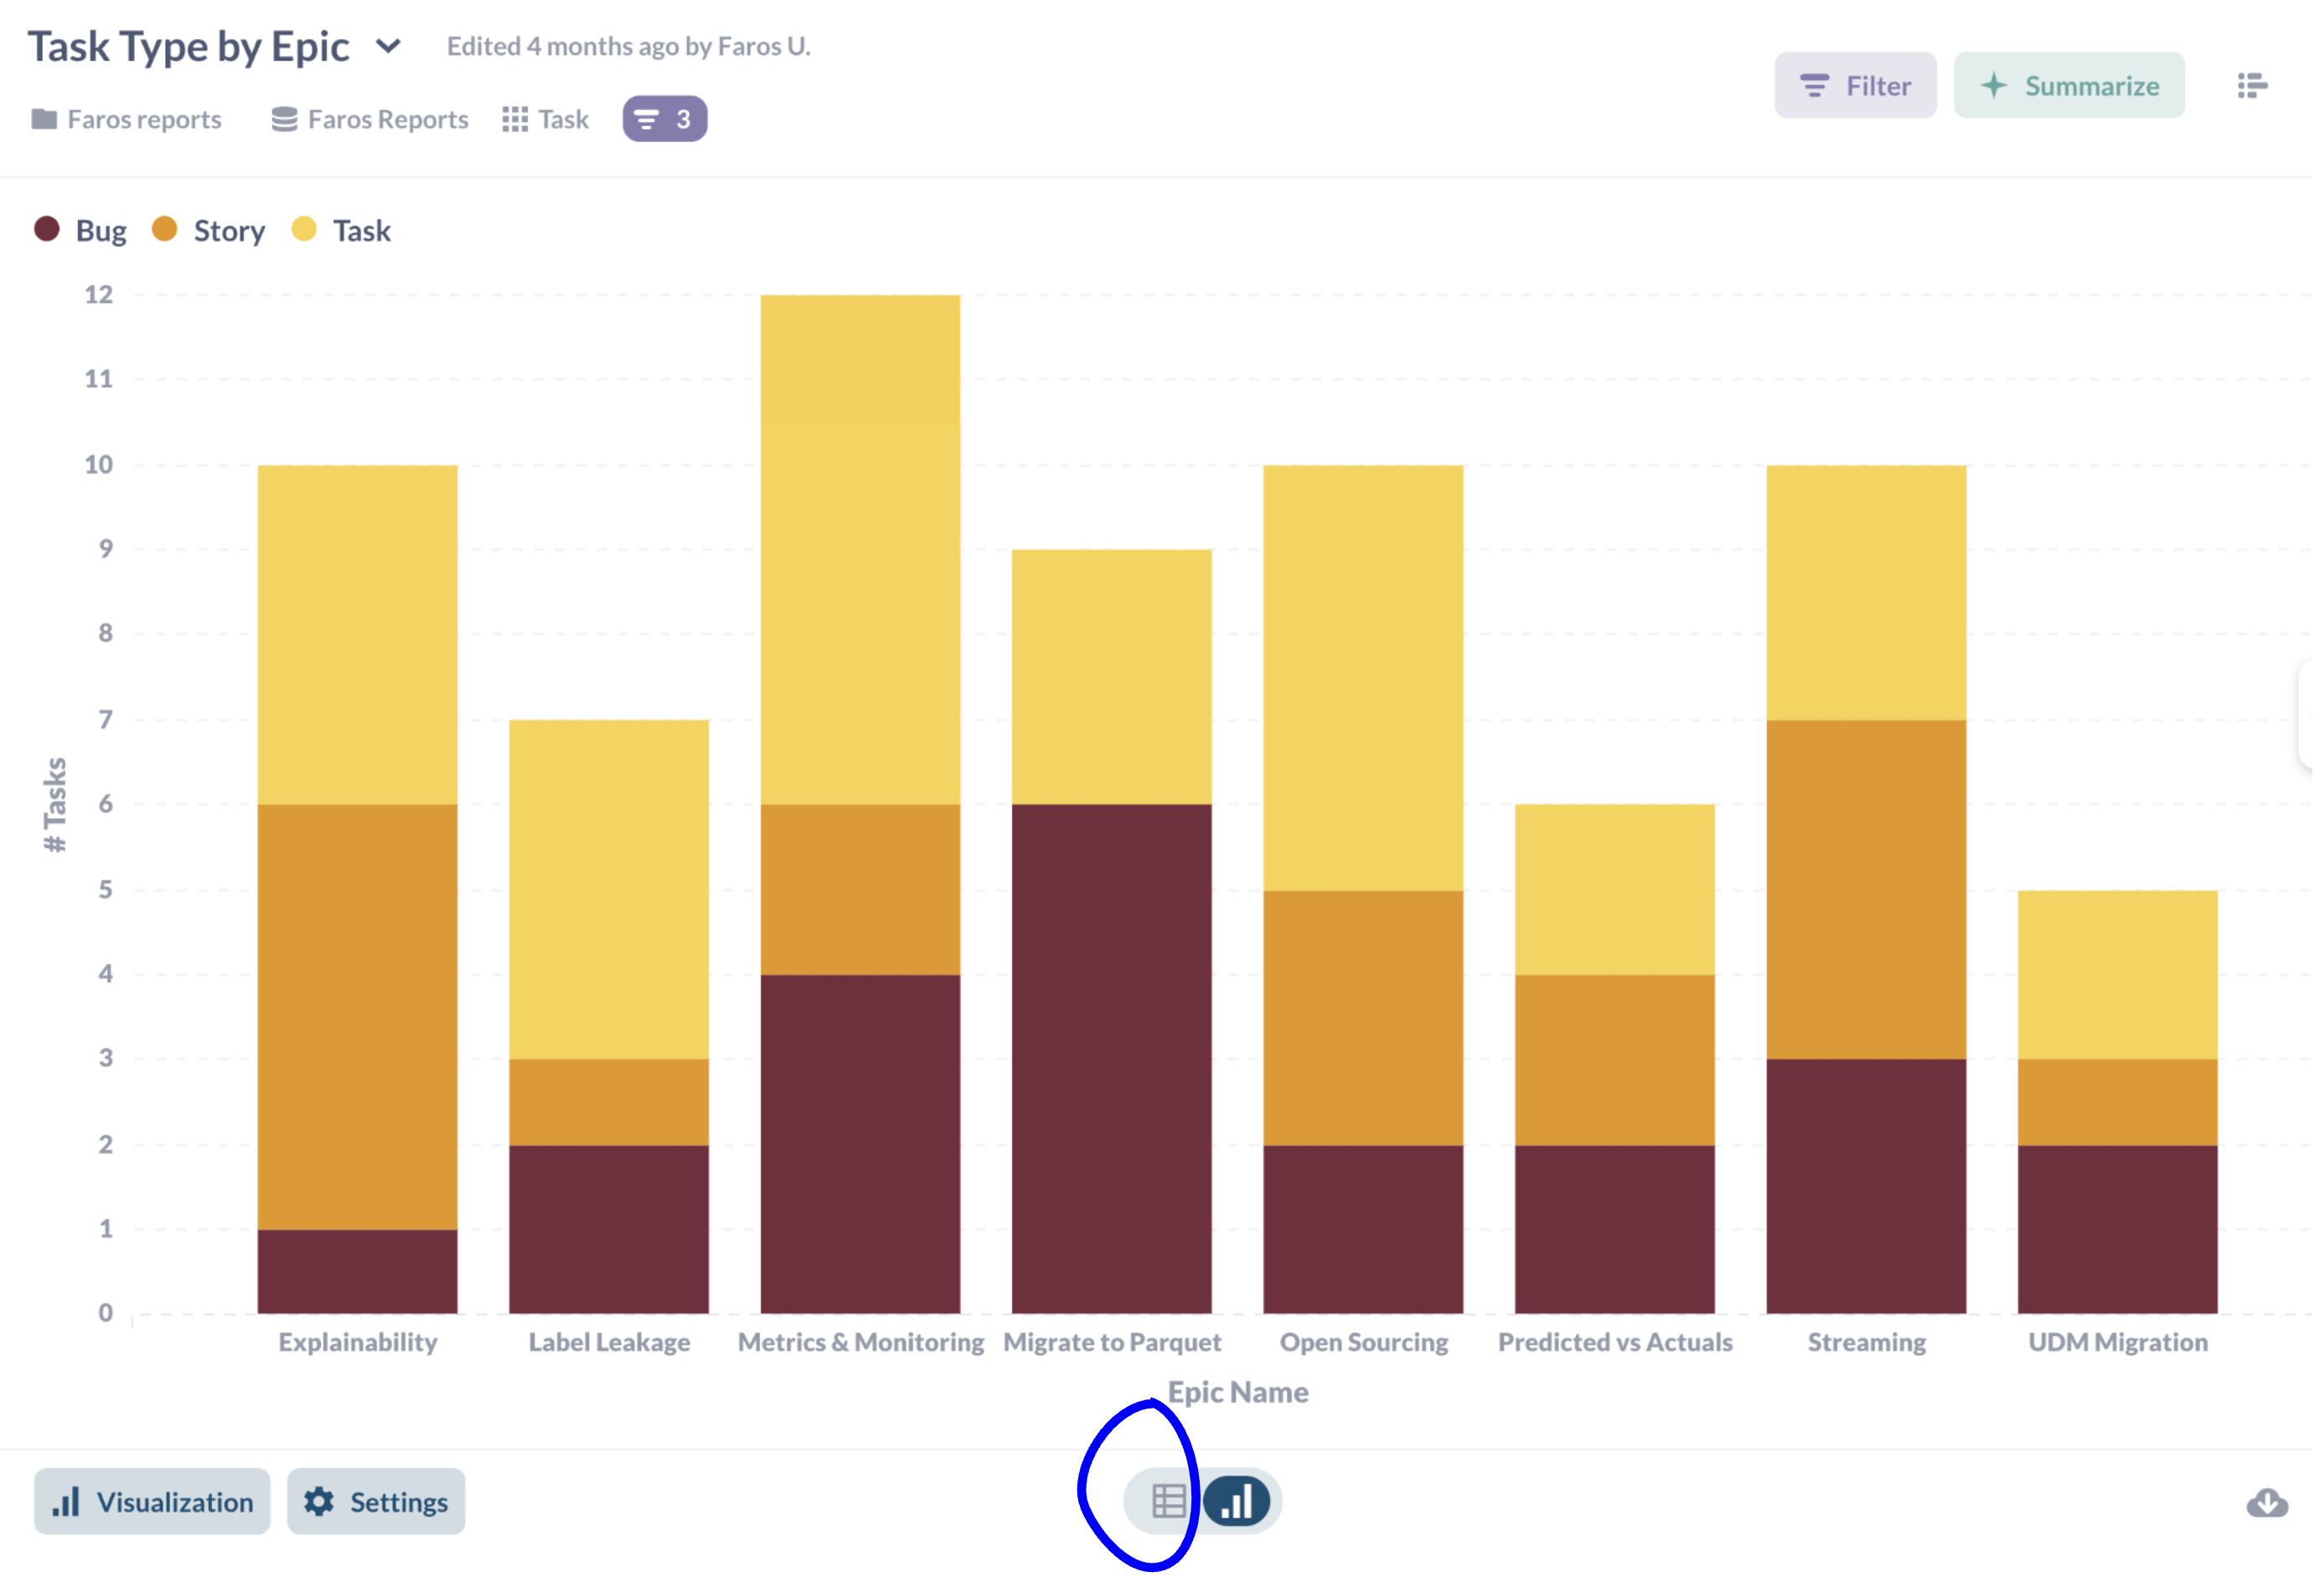
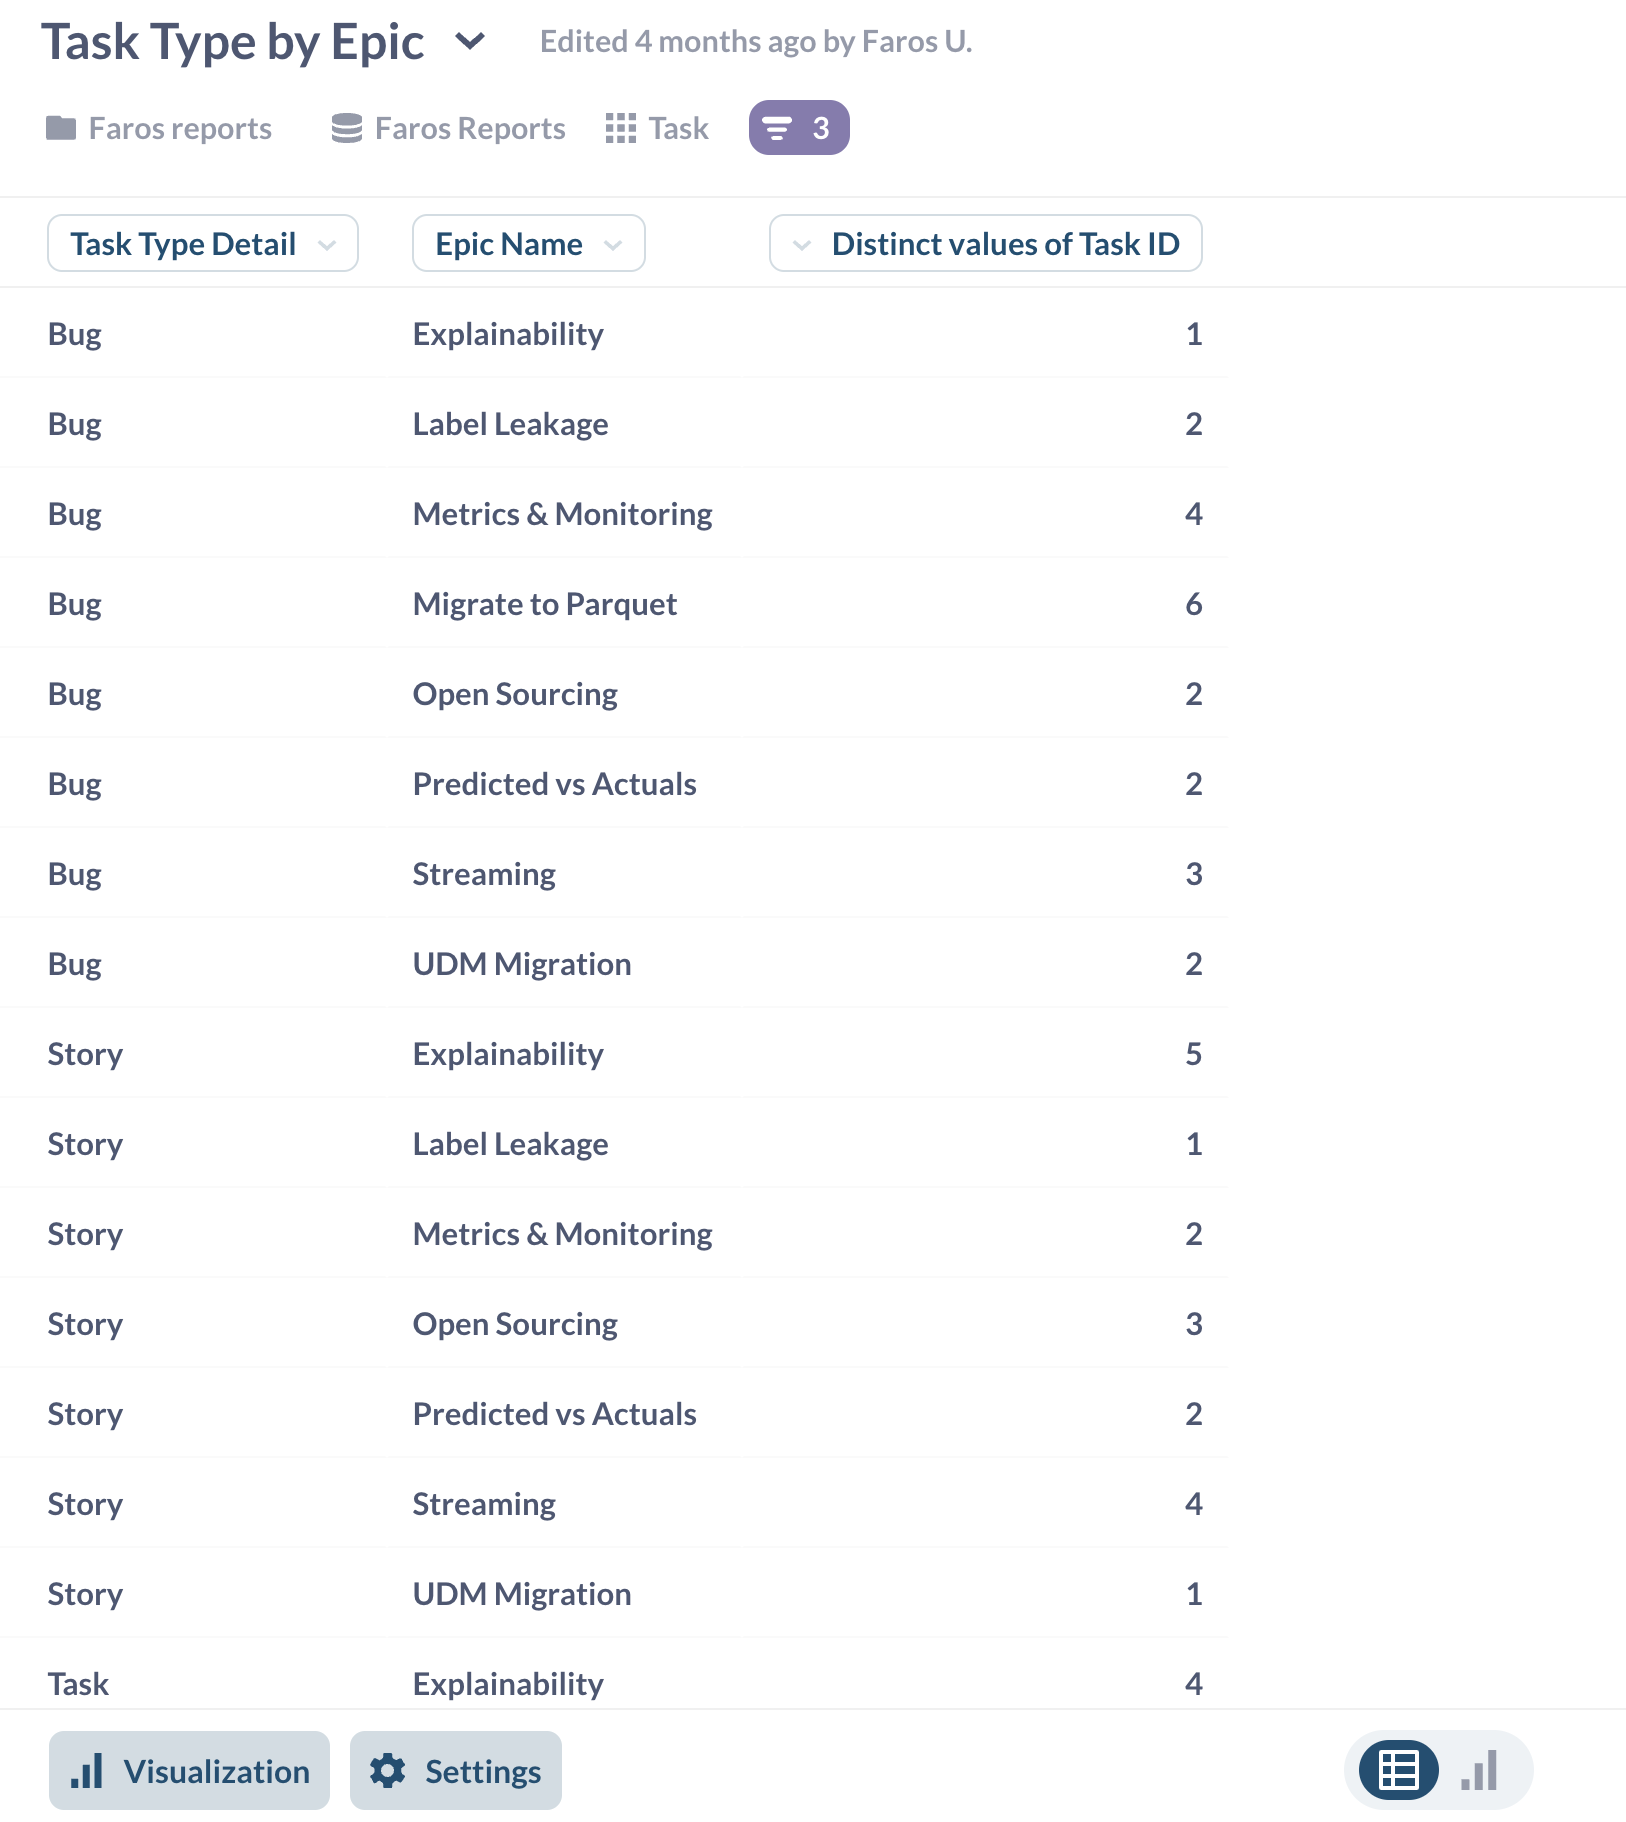
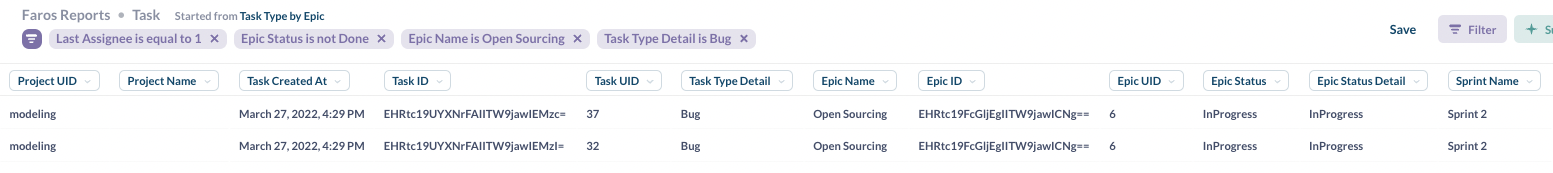
Now I can see the table view with the data used to compute every column in my chart.
2. What is the data that is aggregated to create the element in the chart?
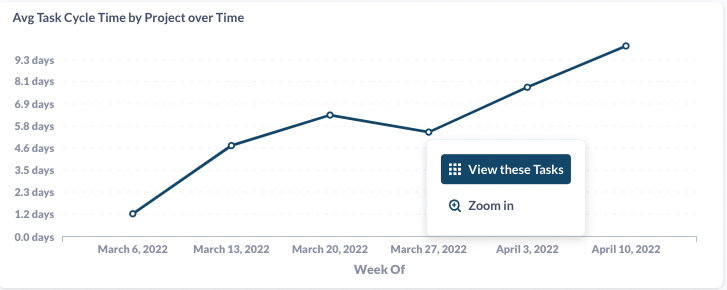
Let's say I am only interested in a portion of the data. Just identify the data of interest, for example Bugs filed on the Open Sourcing Jira Epic. Click on that section of the column, and notice the "View these tasks" option.
This functionality is available on all custom charts, but some of our standard charts provide drill down functionality instead. Fear not! See the tooltip below.
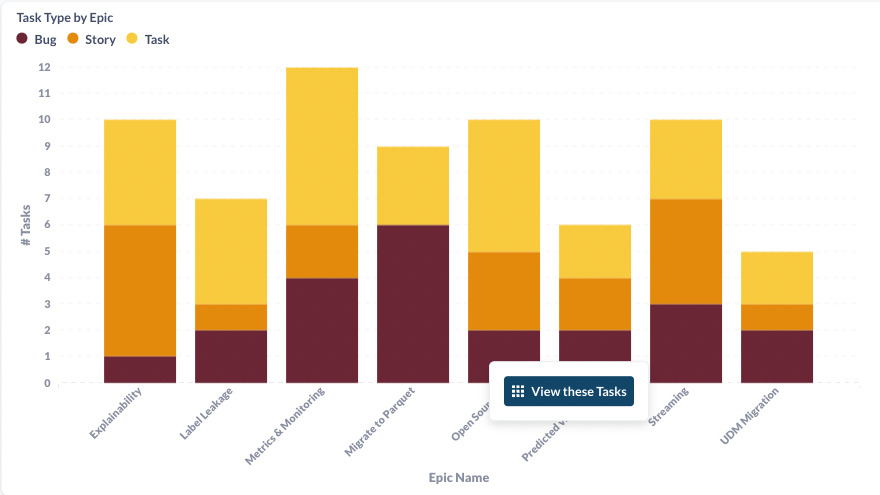
Click "View these tasks" and the underlying rows of data are available!
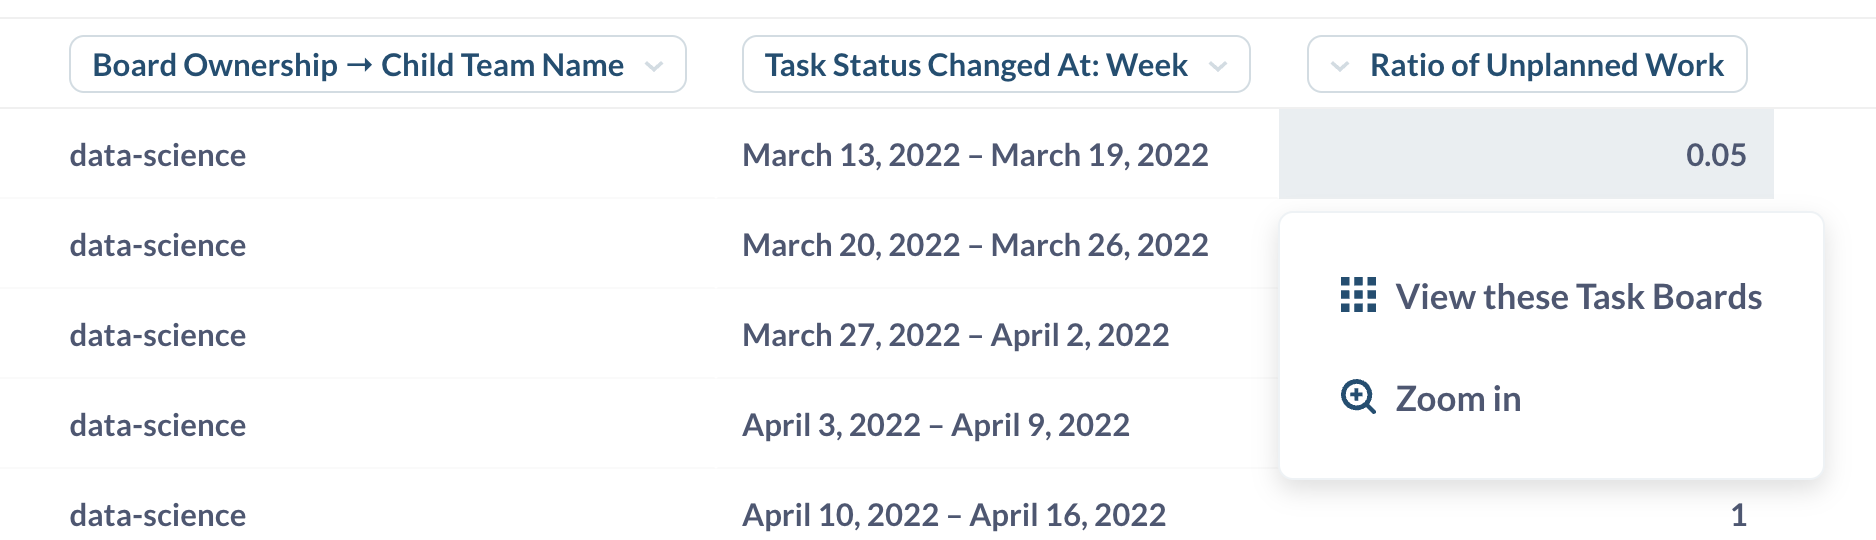
This Metabase feature works in other types of visualizations too:
If you notice a chart where you are not able to "View these" rows, that chart is probably configured to drill down to another team. Fear not! From the table view, "View these" rows is available! Just click on the "group by" column. Here, the data is grouped by "Ratio of Unplanned Work."
3. How did we calculate the chart?
This is a great metabase feature too. Just click "Show Editor"
.png")
And now I can see exactly how my chart was computed. In this example, the starting data table is the "Task" table. We can see how the Task table is filtered, summarized, and aggregated. Each of these areas is easy to edit - try adding a new filter!
.png")
Here we saw several ways to dig into a chart.
- How do I view all the numbers used to compute the data I see in the chart? (view in table format)
- What is the data that is aggregated to create the element in the chart? (view the data for that element)
- How did we calculate the chart? (show editor)
Happy charting! 🤗
Updated 4 months ago