
Guided Data Exploration
It's possible that you want to move beyond the out-of-the-box charts and dashboards but creating Custom charts and dashboards from scratch is a little too open ended. For these cases, Guided Data Exploration tool is the perfect Goldilocks solution! It provides you with more structured support in exploring your data and building useful queries on top of it.
Navigation
To find the Guided Data Exploration tool you have two options.
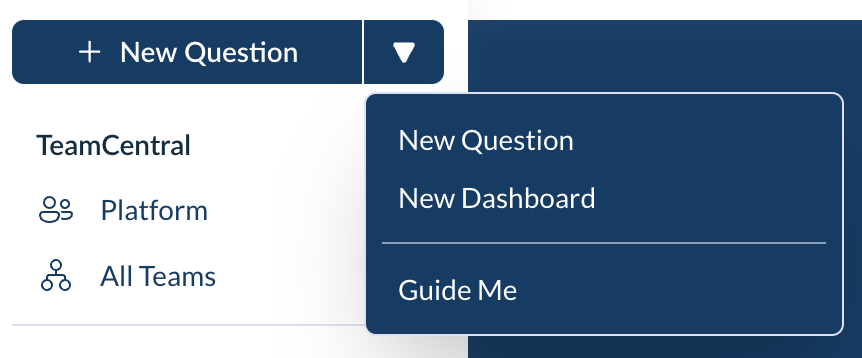
- In the New Question dropdown in the left hand menu you can select
Guide Me
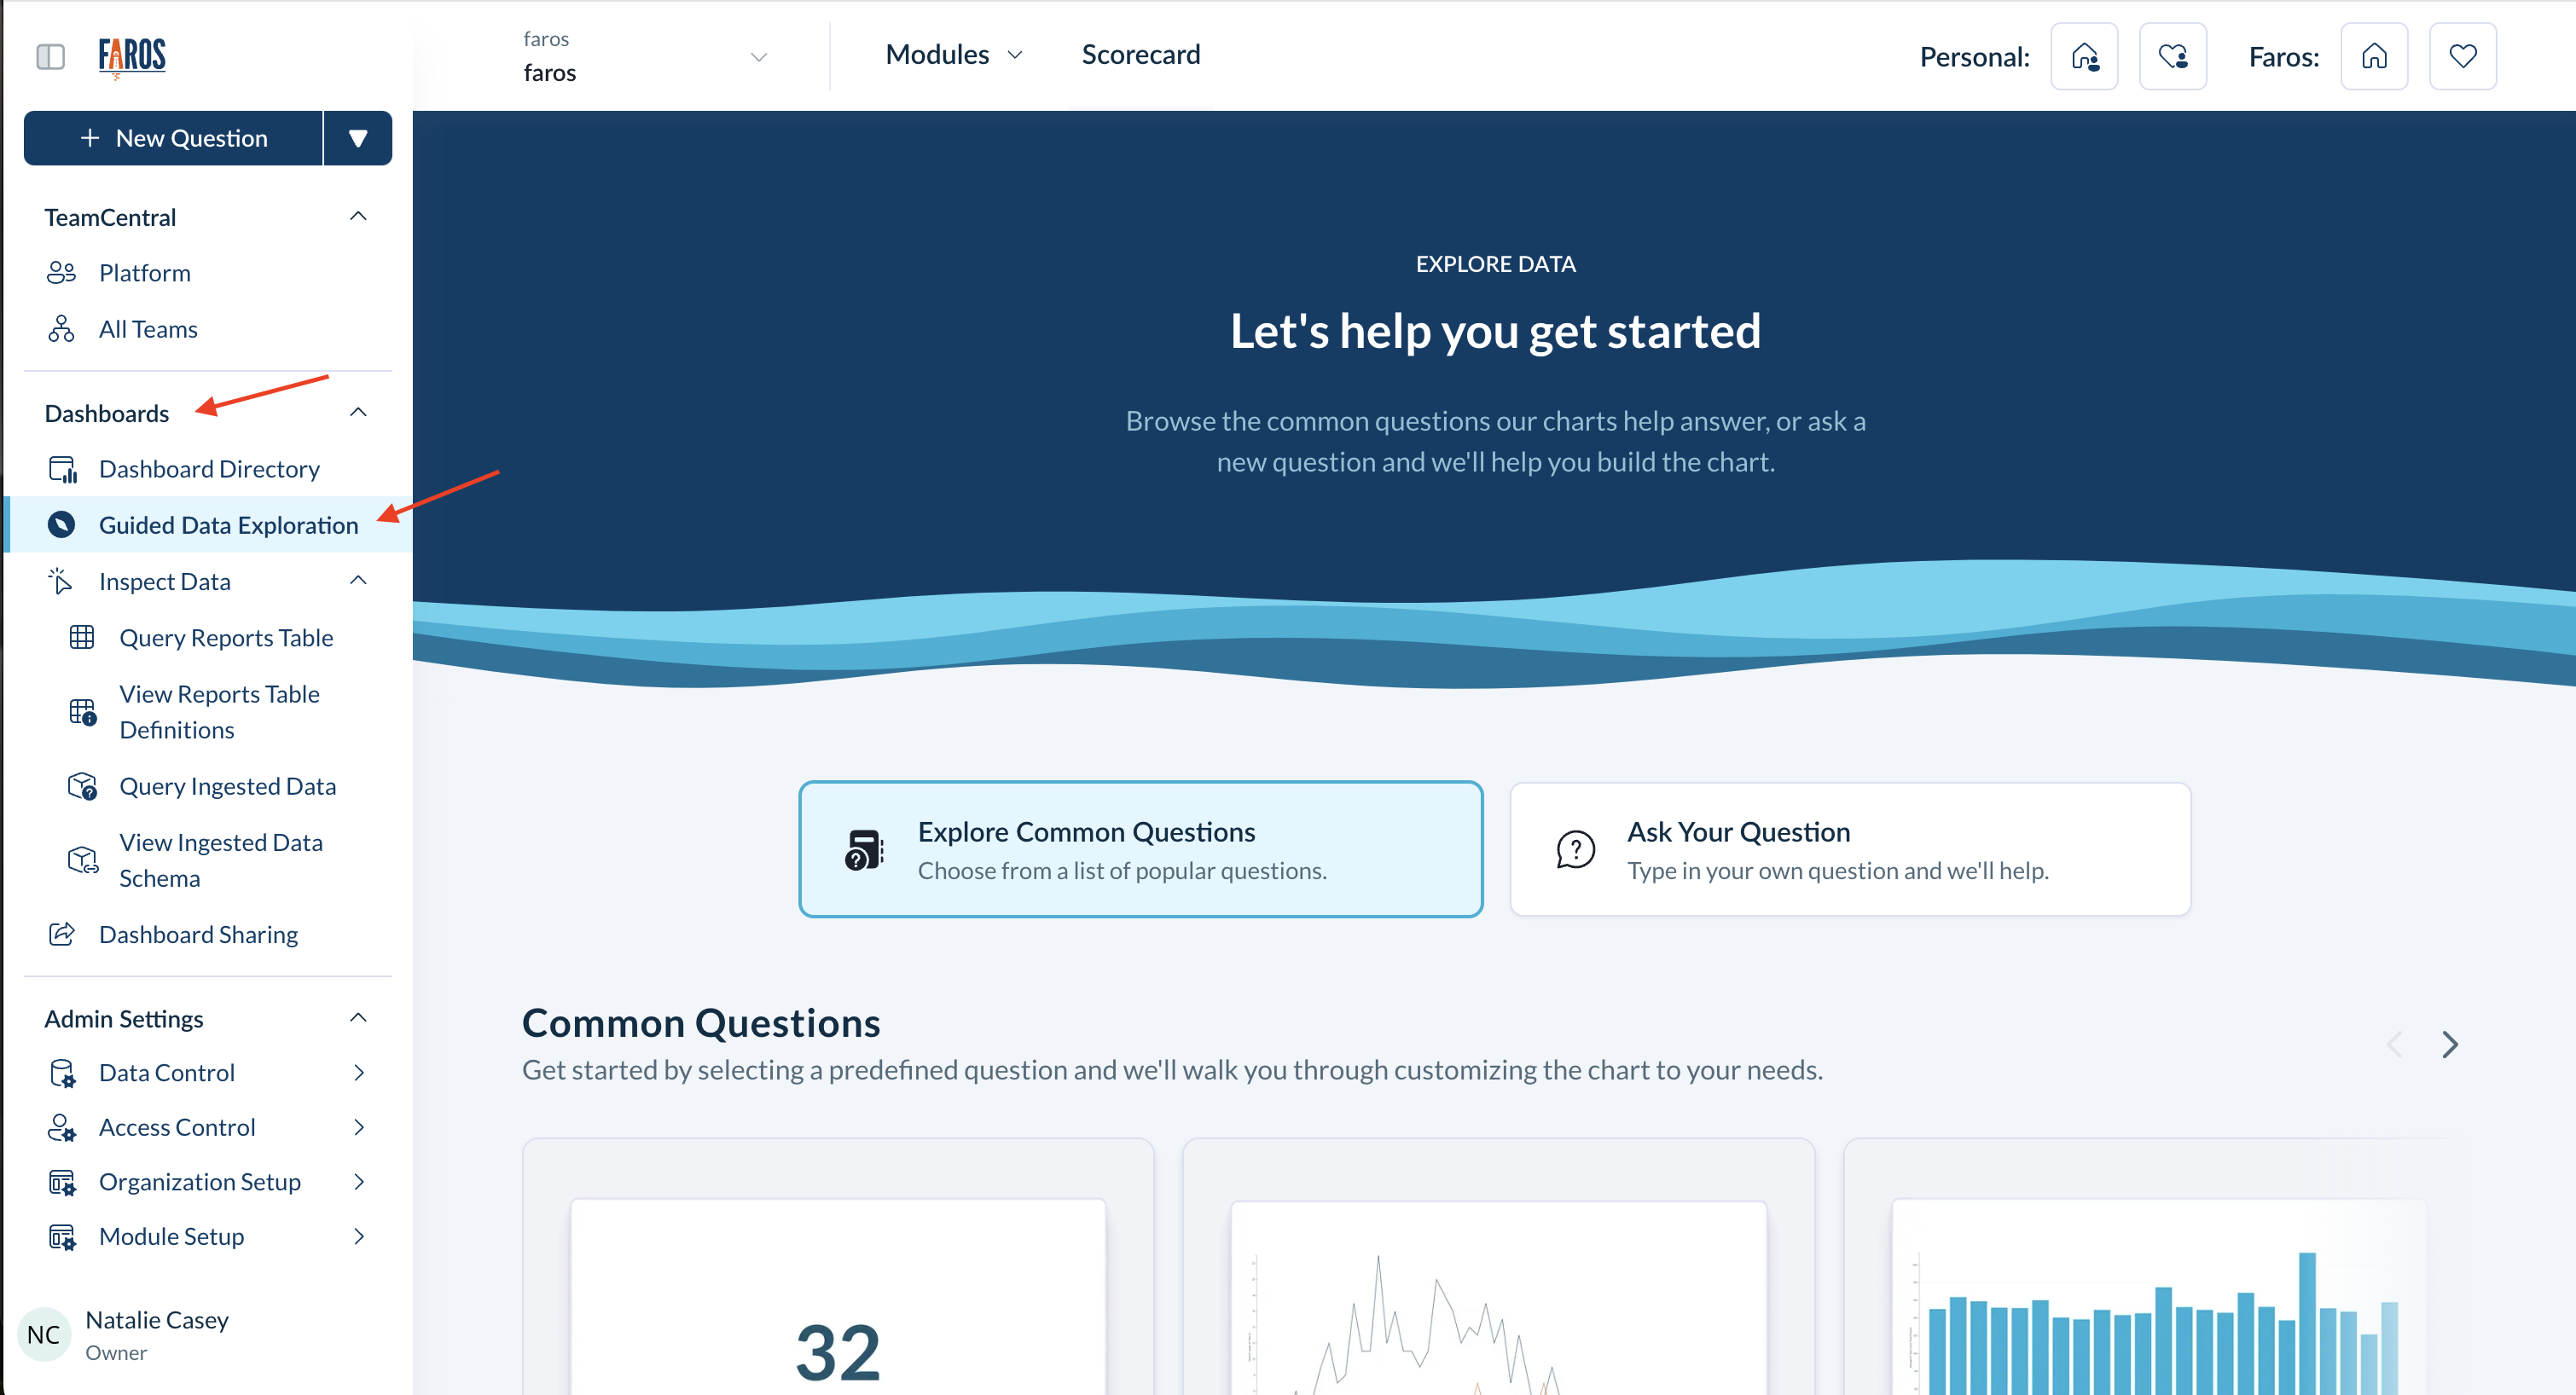
- In the left hand menu you can expand the
Dashboardssection then selectGuided Data Exploration
How it works
Within the wizard you can explore commonly used questions or ask a question through natural language. The wizard will help you construct an underlying query by walking you through each step of the process, like adding custom filters or changing the structure of the resulting data through aggregations.
Choose the type of data that you want to explore

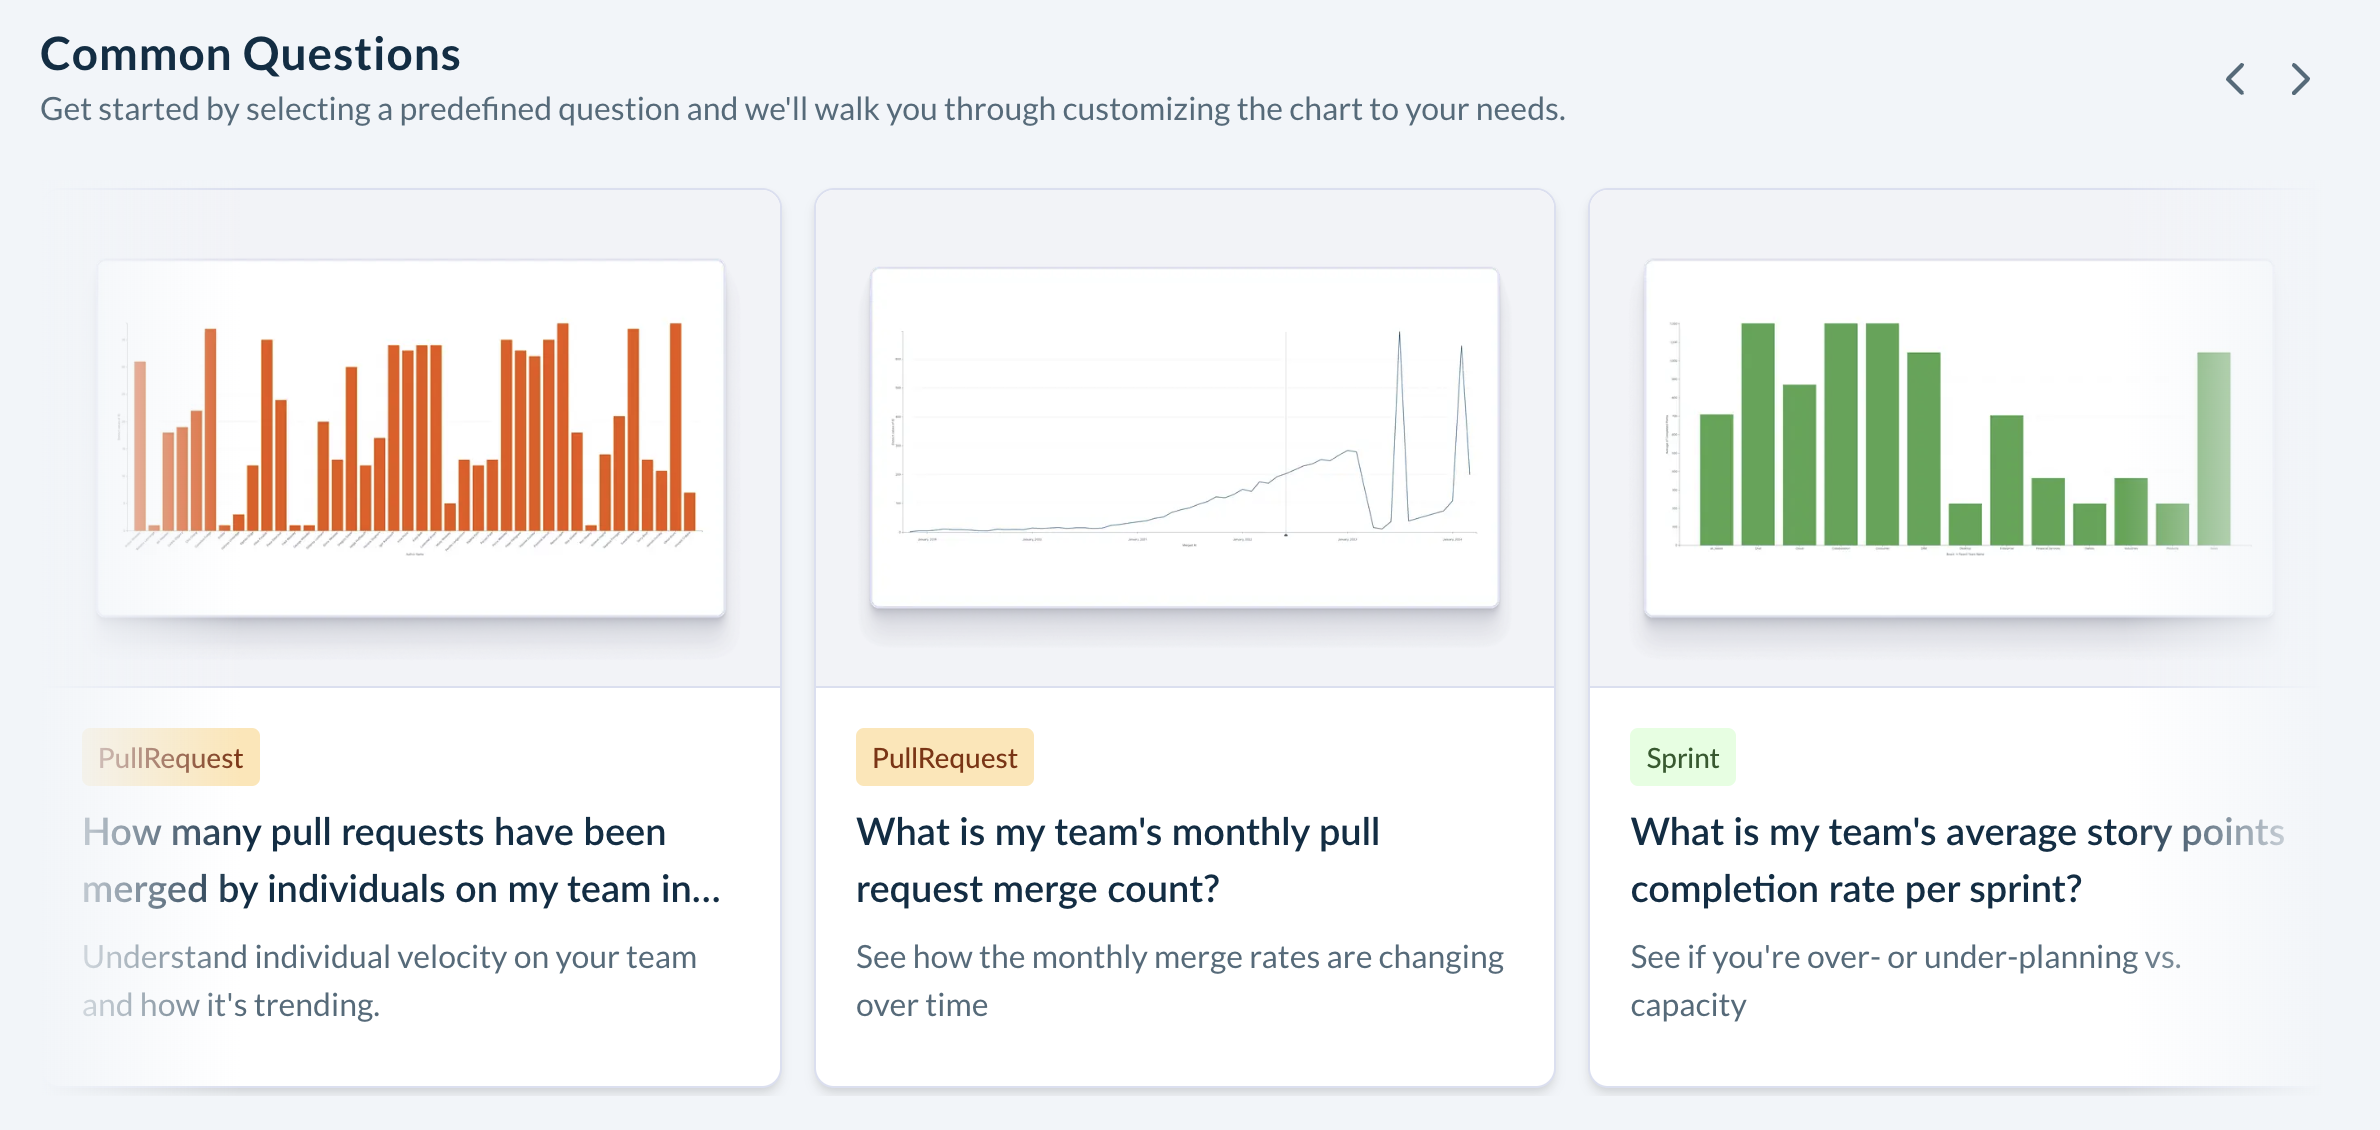
Look through commonly asked questions
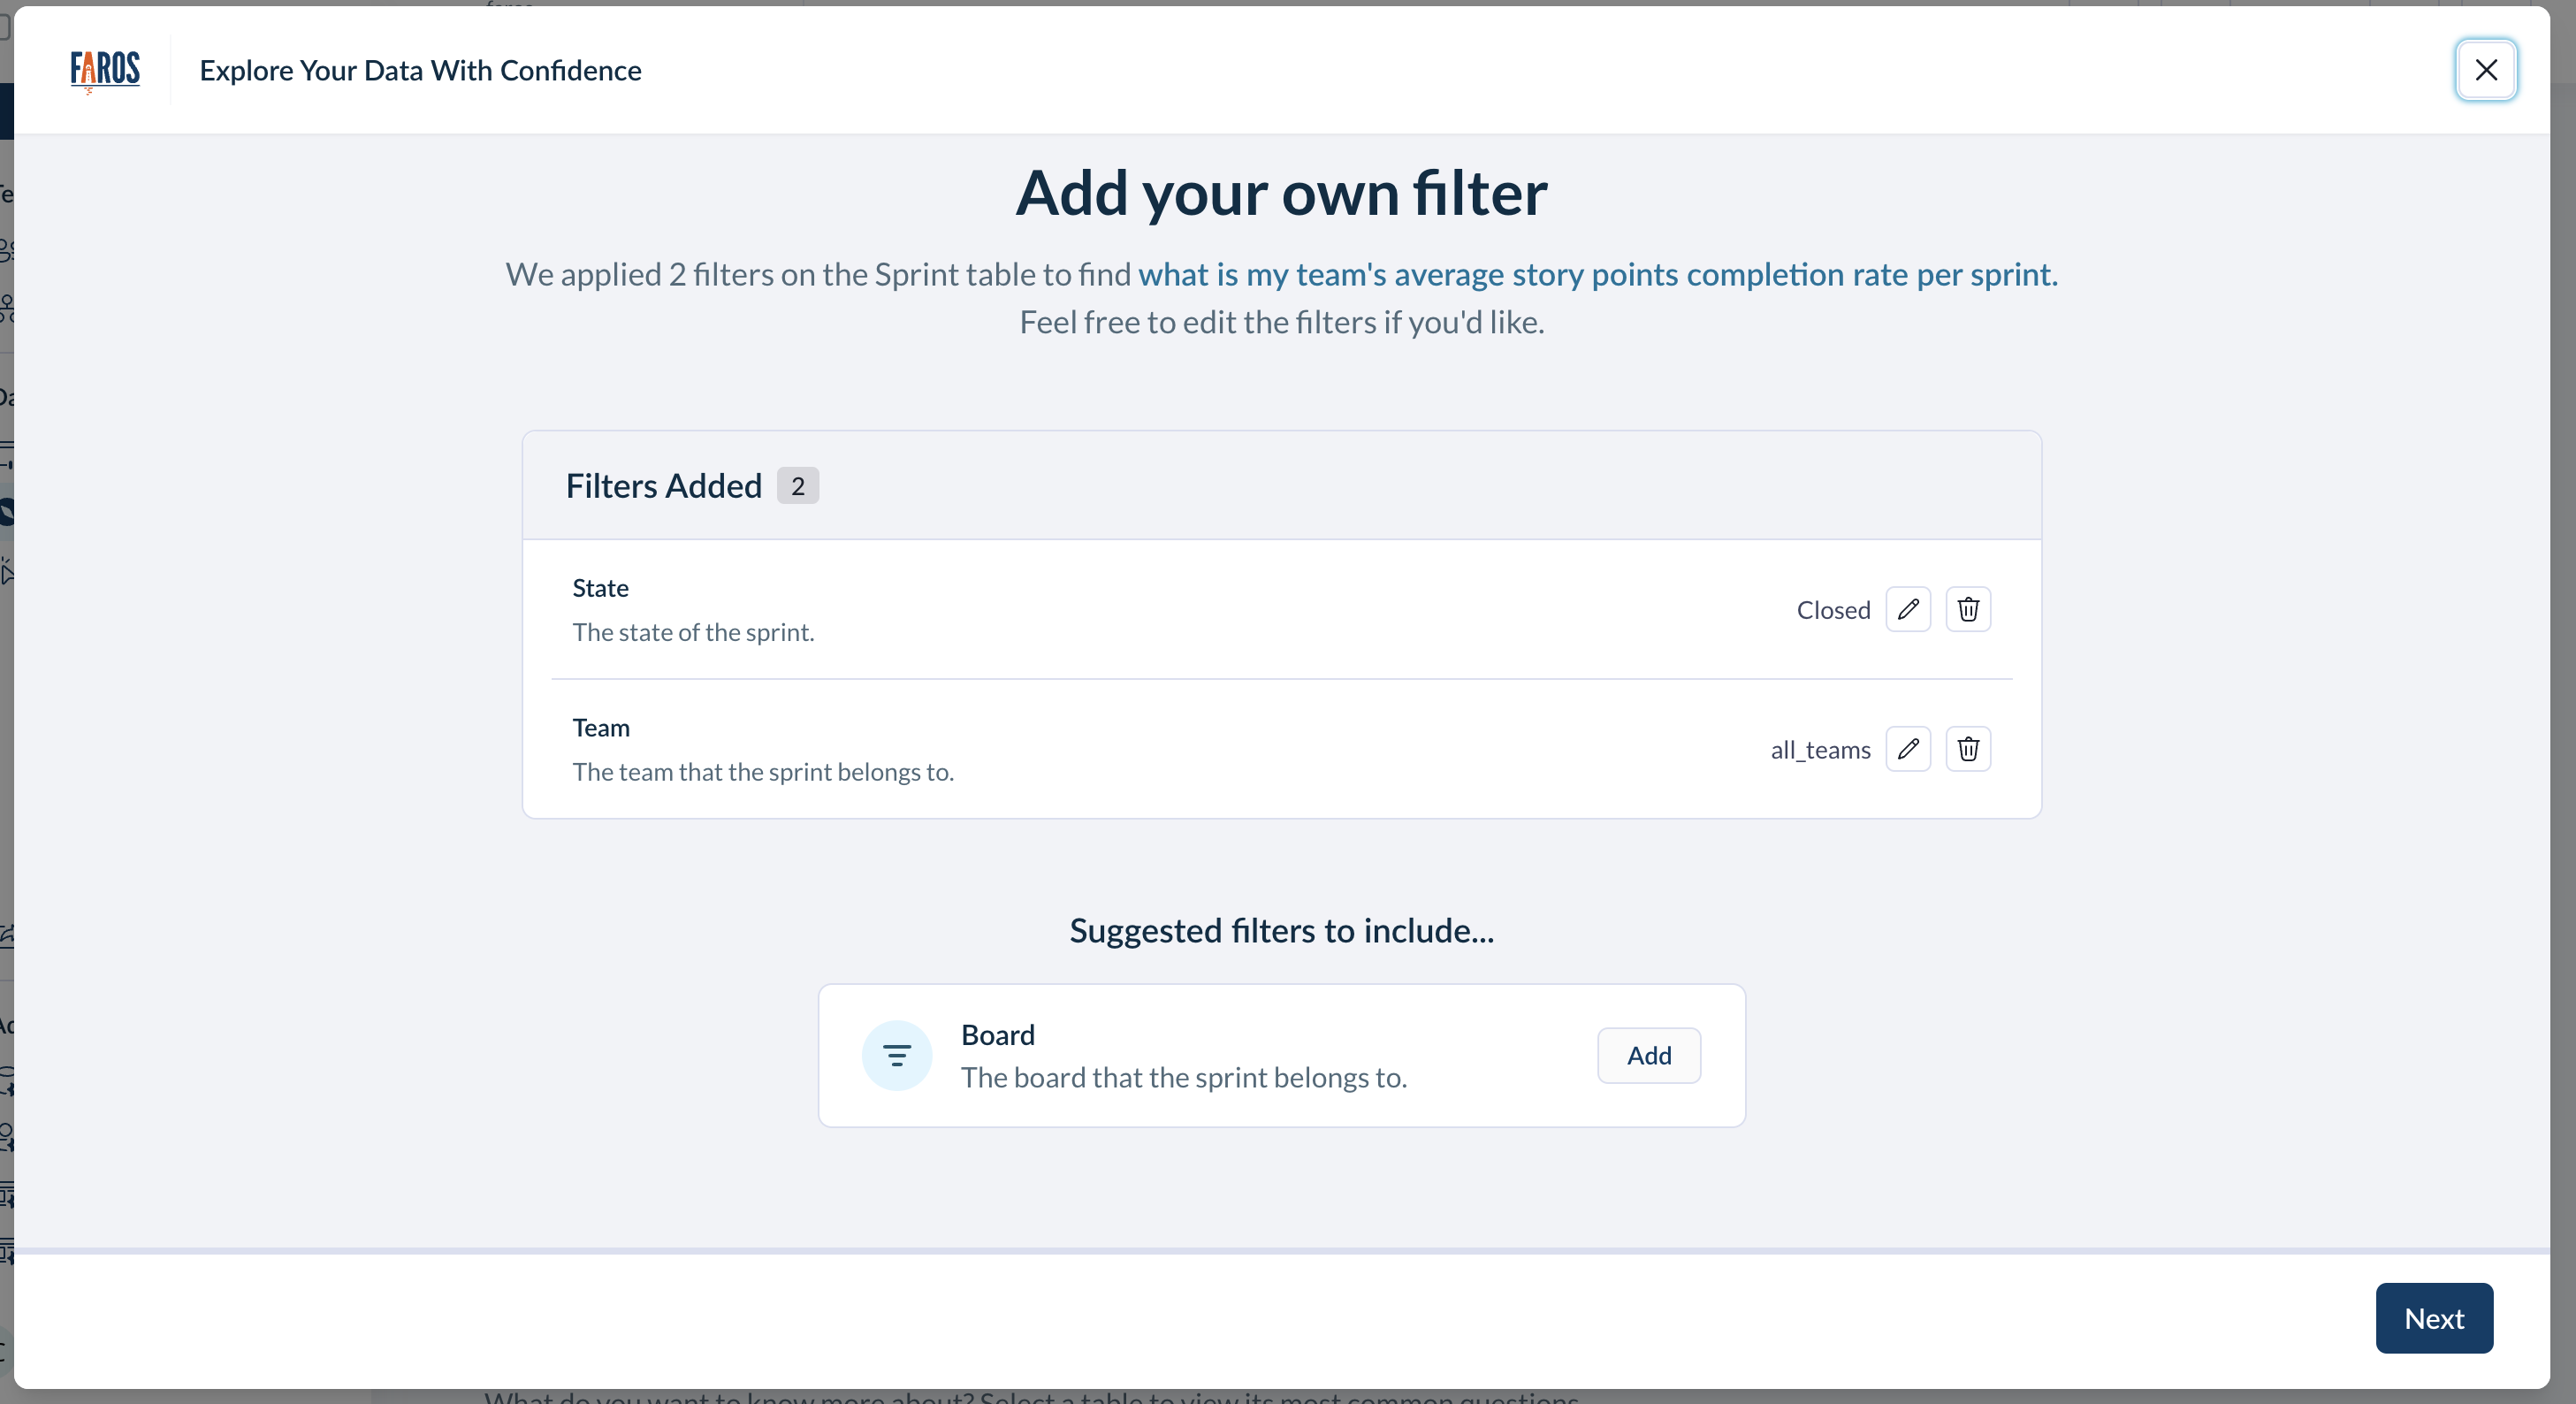
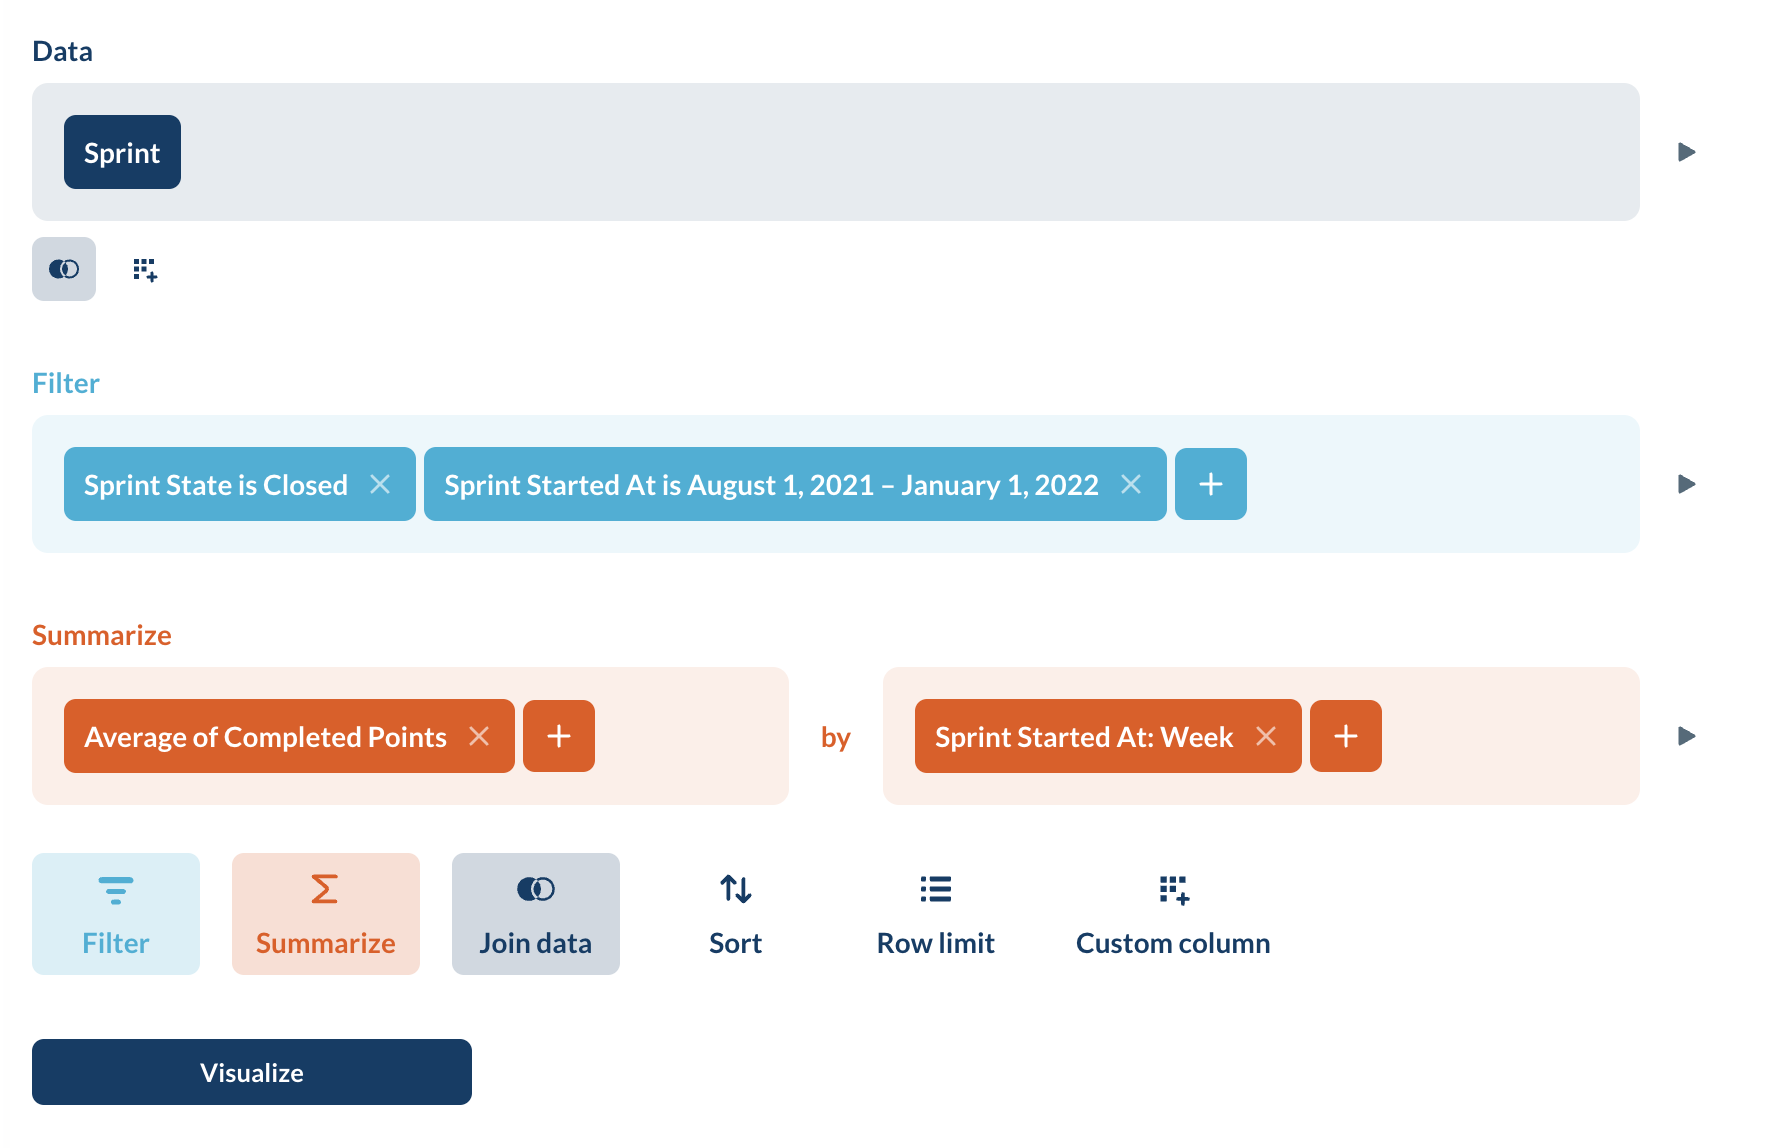
Let the tool guide you through adding filters and aggregations
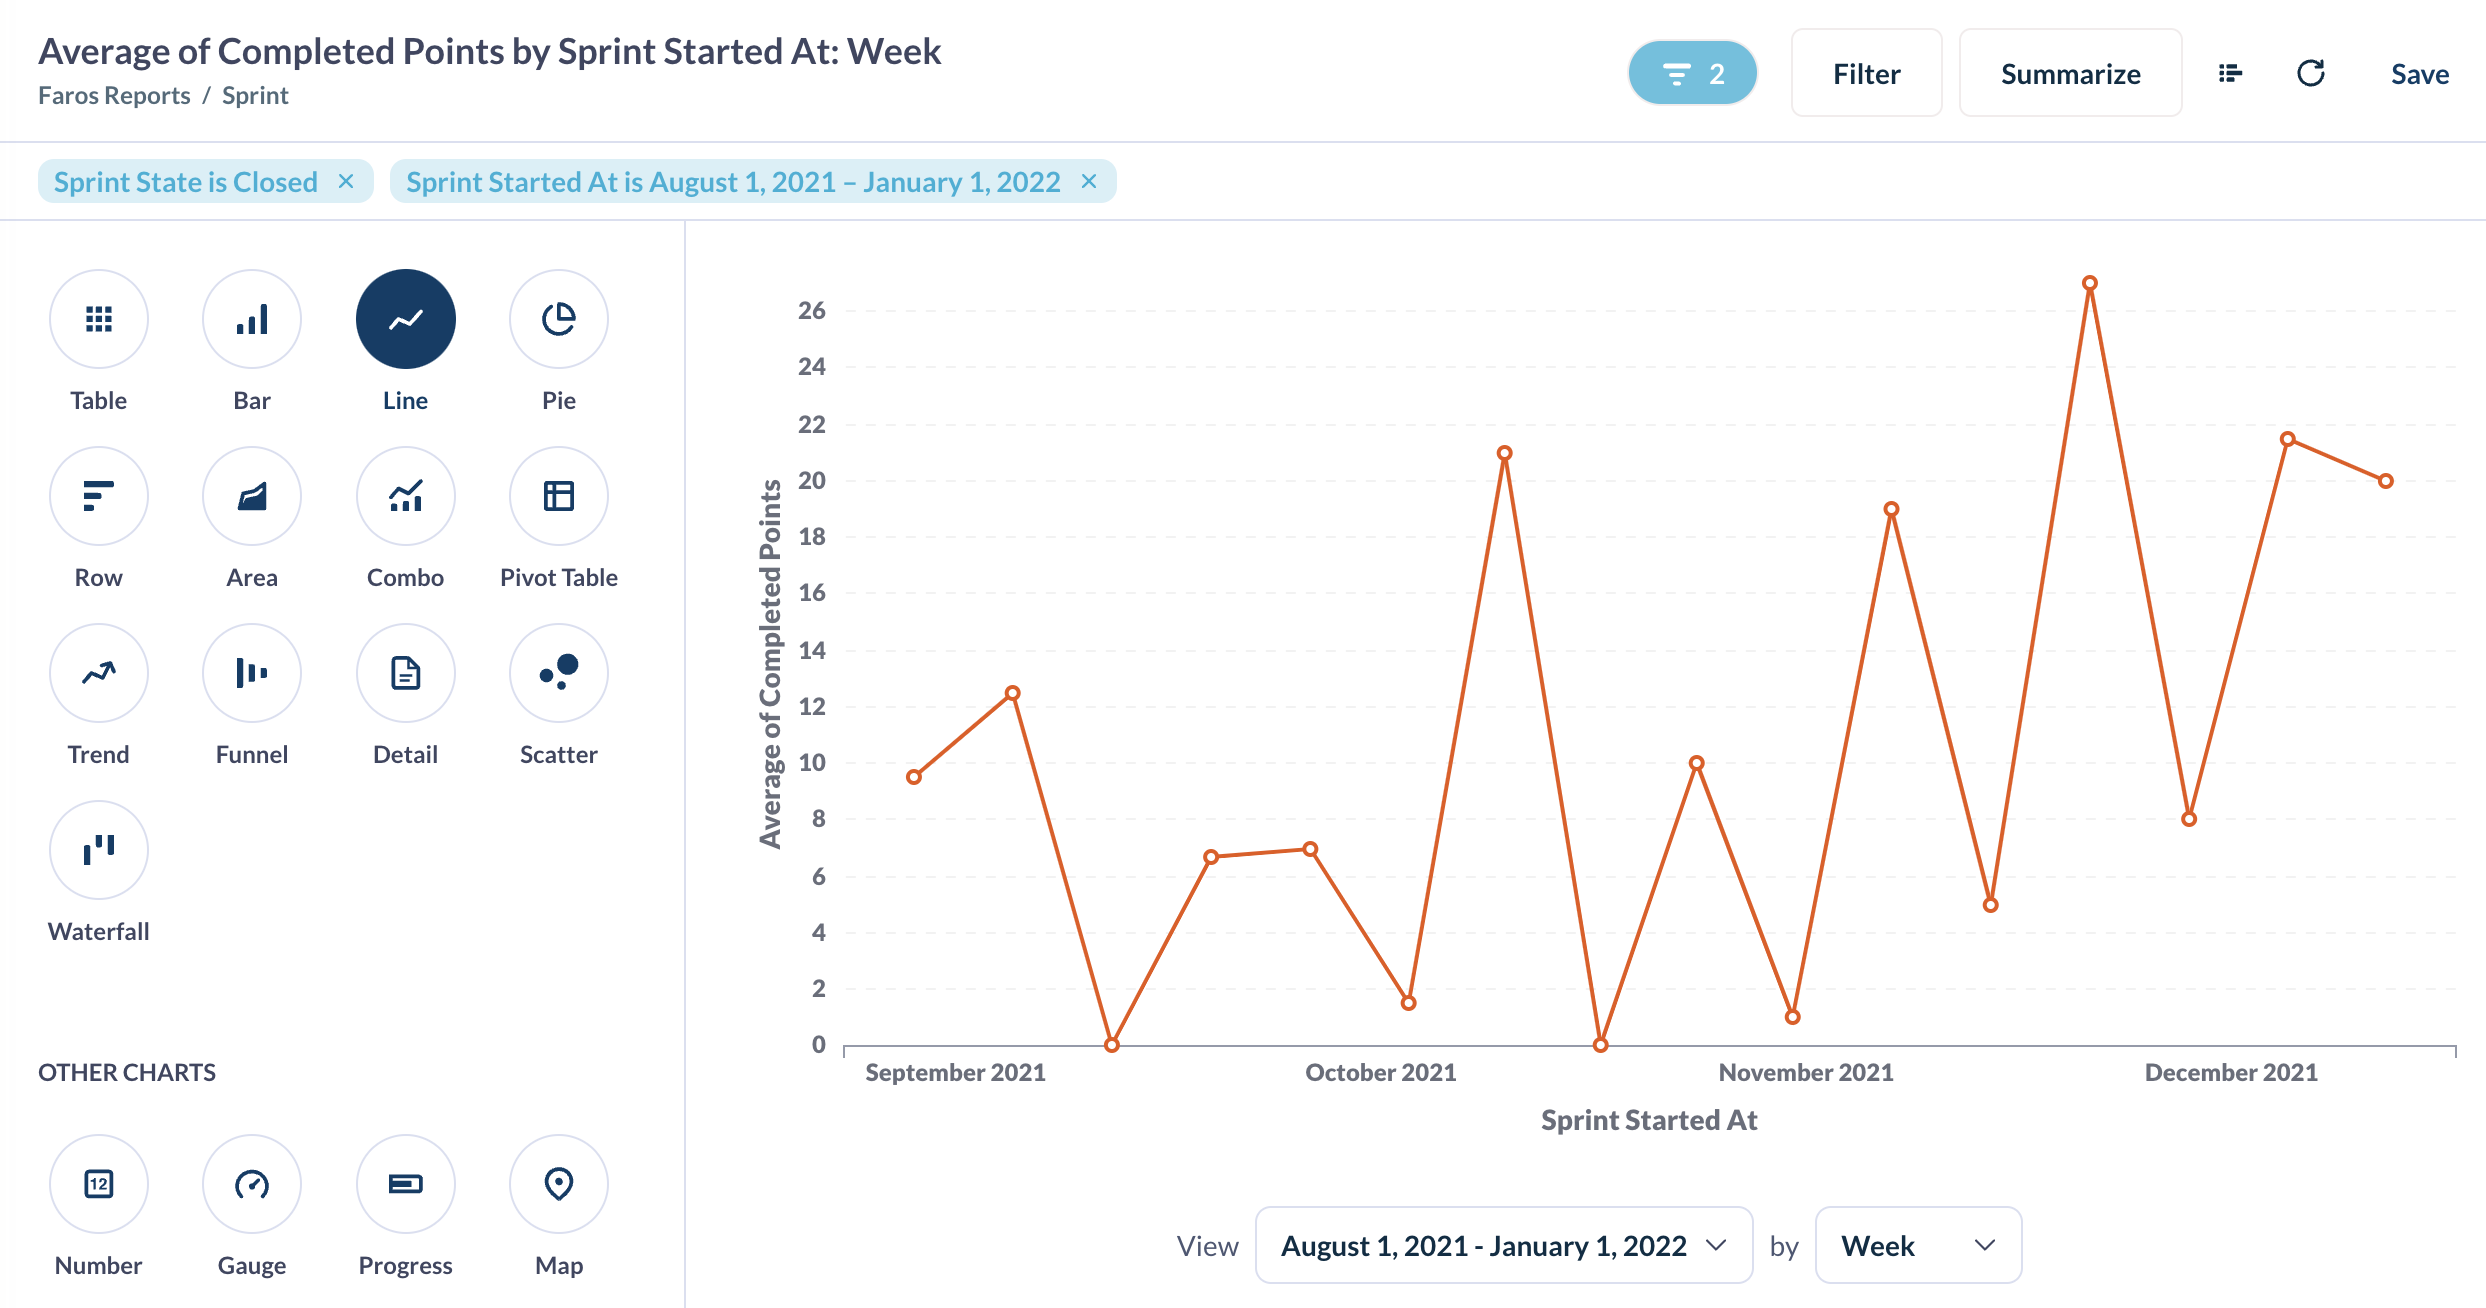
See your resulting query!
Update your visualizations
Next Steps
Once you can see your resulting query, you can start to learn how all the pieces fit together. Feel free to keep playing with it in the query mode or change the visualization. Once you get familiar with the resulting queries you may be able to start building them yourself, or you can keep using the Guided Exploration Wizard to learn more about your teams and their data.
Updated 5 months ago