
Initiative Tracking Module
The initiative tracking module allows engineering leaders to make sure engineering is appropriately staffed and working on the right priorities to achieve business outcomes.
You can keep critical work on track and understand what is running behind, leveraging this visibility to make better decisions with your partners in Product and Finance.
The Initiative Tracking Module is accessible under the Initiative Tracking folder within Faros Reports. It is a premium add-on in the Faros platform. Under Dashboards > Dashboards Directory, select Faros reports. It is also accessible via the Modules drop down at the top left of the Faros application.
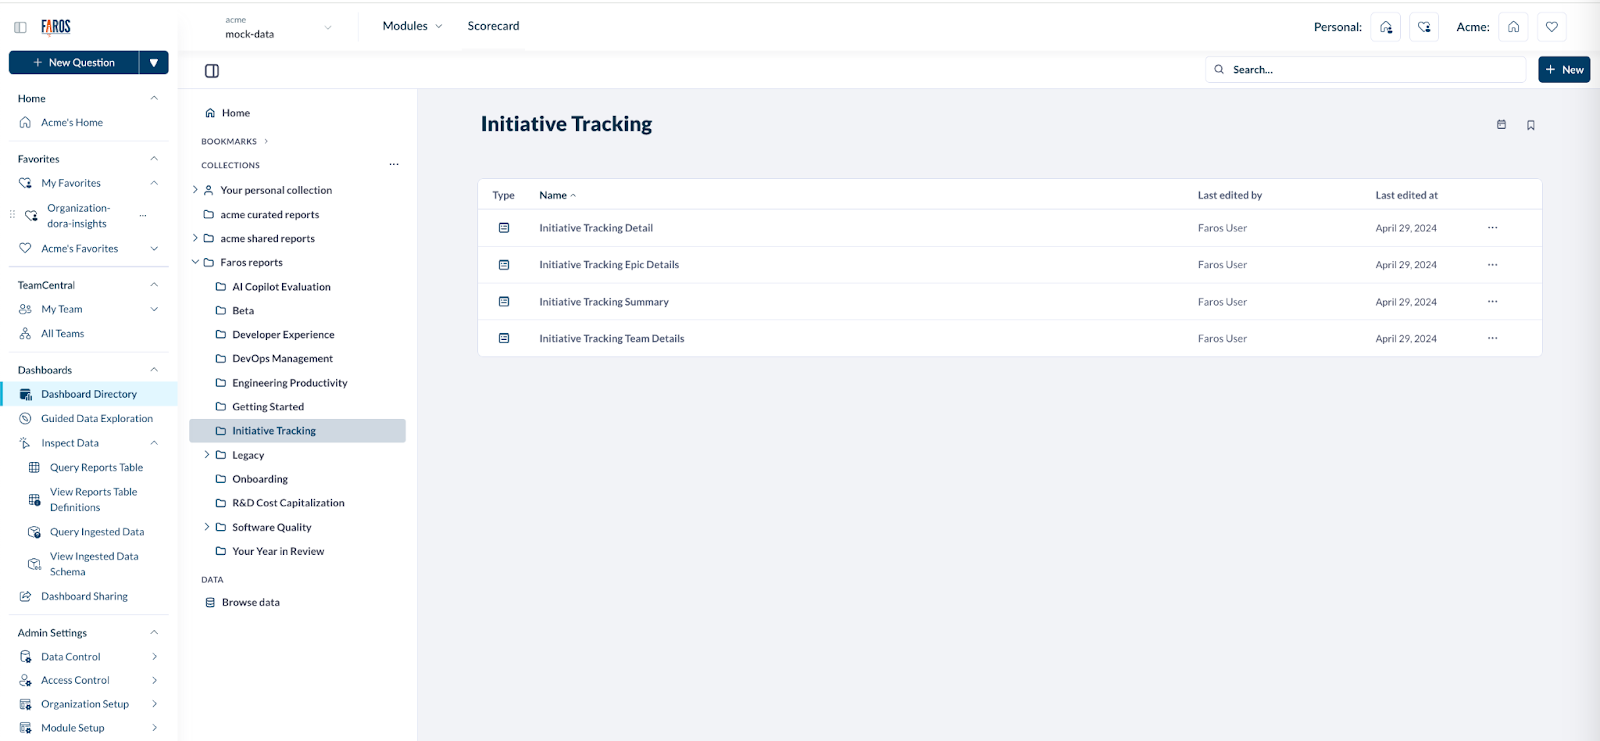
The Initiative Tracking module is composed of four dashboards, providing views at different levels and answering different questions:
-
The Initiative Tracking Summary Dashboard gives an overview of all company initiatives, their progress and comparative investments.
-
The Initiative Tracking Detail Dashboard provides insights on a specific initiative, including progress to goal, staffing, investment to date and underlying epics
-
The Initiative Tracking Epic Details Dashboard provides insights on a particular epic, including progress to goal, staffing, investment to date, underlying work (tasks) and teams involved
-
The Initiative Tracking Team Details Dashboard gives insights on what a particular team is working on, including time spent on key initiatives and underlying epics
We will go into detail about each one and how to set them up below.
The Initiative Tracking Summary Dashboard provides an overview of all key initiatives for your organization, their progress and comparative investments. You can identify at a glance which initiatives are on track and which ones are at risk of being delayed or run over budget, so corrective actions can be taken.

The dashboard is structured into four primary sections: initiatives health, investment to date and divergence with goals, initiatives summary, and initiatives investment breakdown.
All metrics can be filtered by team, initiative and a specific time period.
-
The desired team can be set using the Teams filter, and defaults to all teams. It is also possible to click on any of the team traces to drill down to a specific team
-
The desired time period is set by the Date filter at the top of the page, and defaults to the previous 3 months.
-
By default all initiatives are shown. You can select a specific initiative or set of initiatives as desired using the Initiative dropdown menu
The Initiatives Health section provides a visualization of initiatives based on their likelihood to run overtime or over budget. It also shows investments to date, remaining budget and trends compared to the previous month.
Metric | Description |
Initiatives Health | Projected outcome per initiative, based on current rate of progress. Each bubble represents an initiative. The size of the bubble is proportional to the allocated budget for that initiative. The percentage values reflect how much the actual time or budget is projected to exceed, or be lower than, planned expectations. Positive percentage values indicate over budget or time. Negative percentage values indicate on time or under budget. Large bubbles in the top right section of the chart are typically most concerning |
Time Investment to Date | Cumulative amount of time that has been invested in all selected initiatives up to the present date and monthly trend |
Remaining Dev Hours in Budget | Remaining amount of time based on allocated dev weeks. It shows how much time is left for completing development tasks within the allocated time. A negative number means being over time. |
Cost To Date | Total amount that has been invested in all selected initiatives up to the present date and monthly trend |
Remaining Cost in Budget | Remaining budget. It shows now much allocated budget is left for completing development tasks within the allocated budget. A negative number means being over budget. |
The Investments to Date and Divergence with Goals section shows actual investments vs budgeted for each initiative. In addition it tracks how projected delivery date and budget have deviated from what was planned for each initiative over time.
Metric | Description |
Time Investment Per Initiative | Actual time investment to date and allocated dev weeks per initiative. Highlights initiatives that are over time |
Predicted Delays In Delivery Based On Planned Date | Predicted delays in delivery for each initiative, taking into account the progression of activities over time and since from the initiative's outset and assuming a similar rate of progression moving forward. A negative number indicates an earlier than planned expected delivery |
Cost Per Initiative | Actual budget spent to date and allocated budget per initiative. Highlights initiatives that are over budget |
Predicted Budget Overrun Based On Planned Budget | Predicted budget overrun for each initiative, based on expenditures over time, assuming a similar rate of progression moving forward. A negative number indicates a delivery expected to be under budget |
The initiatives Summary table provides details on ongoing initiatives.
Metric | Description |
Initiatives Table | Each row represents an initiative. For each initiative, the following information is provided: name, owner, starting date, status, how much of the underlying tasks have been completed, dev hours allocated and spent to date, number of engineers involved, budget allocated and spent to date |
The Initiatives Breakdown section provides a comparative breakdown of investments in terms of people, time and budget for each initiative.
Metric | Description |
Total FTE Breakdown By Initiative | Breakdown of developers per initiative. It provides a visual representation of the number of developers involved in each initiative |
FTE Count By Team Per Initiative | Breakdown of developers in each team per initiative. It helps compare the contribution of different teams to each initiative |
Number Of FTEs Per Initiative Over Time | Number of developers per initiative over time. It helps visualize resource allocation for each initiative over time and see which ones are ramping up or scaling down |
Total Time (Dev Hours) Breakdown By Initiative | Breakdown of time investments per initiative. It provides a visual representation of relative time invested in each initiative |
Time Spent (Dev Hours) By Teams Per Initiative | Breakdown of time investments by team and initiative. It helps compare the contribution of different teams to each initiative |
Time Spent (Dev Hours) Per Initiative Over Time | Time investments per initiative over time. It helps visualize time investments for each initiative over time and see which ones are ramping up or scaling down |
Total Cost Breakdown By Initiative | Breakdown of budget allocated per initiative. It provides a visual representation of budget invested in each initiative |
Cost By Teams Per Initiative | Breakdown of budget invested by team and initiative. It helps compare the contribution of different teams to each initiative |
Cumulative Cost Of Initiatives Over Time | Budget invested per initiative over time. It helps visualize budget allocated for each initiative over time and see which ones are ramping up or scaling down |
The Initiative Tracking Detail Dashboard provides insights on a specific initiative and its underlying epics.You can get a quick sense of whether an initiative is on track or running behind and identify which underlying epics are causing delays and may require additional attention.

The dashboard is structured into four primary sections: initiative investment summary, initiative progress, epics health and investment by epics over time.
All metrics can be filtered by team, initiative and a specific time period.
-
The desired team can be set using the Teams filter, and defaults to all teams. It is also possible to click on any of the team traces to drill down to a specific team
-
The desired time period is set by the Date filter at the top of the page, and defaults to the previous 3 months.
-
By default all initiatives are shown. You can select a specific initiative or set of initiatives as desired using the Initiative dropdown menu.
The Initiative Investment Summary section summarizes how much has been invested on an initiative so far and how much is left for completion.
Metric | Description |
Time Spent To Date | Number of hours spent on initiative to date and monthly trend |
Remaining Dev Hours From Budget | Remaining number of hours based on allocated number of dev weeks for this initiative and monthly trend |
Cost Spent To Date | Budget spent to date and monthly trend |
Remaining Cost From Budget | Remaining budget based on allocated budget for this initiative |
Number of FTEs Involved | Total number of FTEs that contributed to at least one underlying task for this initiative |
The Initiative Progress section provides details on progress towards completion and break down by epics, status and team.
Metric | Description |
Percent Done For Initiative | Percentage of the initiative’s underlying activities that have been completed to date |
Percent Done By Epics | Percentage of the initiative’s underlying activities for each epic that have been completed to date |
Percentage Done Over Time | Completion rate of the underlying activities of an initiative over time |
Status Breakdown Per Epic | Breakdown for each underlying epic of an initiative of the status of activities for this epic |
Status Breakdown Per Team | Breakdown for each team of the status of the activities belonging to this initiative |
The Epics Health section dives deeper into the health of underlying epics so you get a better sense of which ones are on track and which ones are running behind, and even more importantly how that impacts the delivery of the initiative.
Metric | Description |
Projected Epics Contribution to Time and Budget Overruns | Projected contribution of each epic to time or budget overrun for this initiative. Each bubble represents an epic and its size is the allocated budget. Bubbles on the top right are epics which contribute the most to the initiative being late or over budget |
Epics At Risk - Time Spent vs Work Remaining | Epics that are most at risk based on time spent and work remaining. Each bubble represents an epic and its size is the total number of its underlying activities. Bubbles on the top right are epics for which a lot of time has already been spent with a lot of work still remaining |
Epic Contribution to Time Overrun | Breakdown of how each epic contributes to the time overrun for the initiative, based on allocated dev hours. The taller a bar, the larger the contribution to overrun. It helps identify areas where time overrun are occurring and which may require better resource allocation and planning |
Epic Contribution to Cost Overrun | Breakdown of how each epic contributes to budget overrun for the initiative, based on allocated budget. The taller a bar, the larger the contribution to overrun. It helps identify areas where time overrun are occurring and which may require better resource allocation and planning |
The Investment by Epics Over Time section provides a comparative breakdown of investments in terms of people, time and budget for each epic in this initiative.
Metric | Description |
Number of FTEs Per Month | Breakdown of developers per epic. It provides a visual representation of the number of developers involved in each epic |
Number Of FTEs Broken Down By Teams | Breakdown of developers in each team per epic. It helps compare the contribution of different teams to each epic |
Number Of FTEs Over Time | Number of developers per epic over time. It helps visualize resource allocation for each epic over time and see which ones are ramping up or scaling down |
Time Spent (Dev Hours) Per Month | Breakdown of time investments per epic. It provides a visual representation of relative time invested on each epic |
Time Spent (Dev Hours) Broken Down By Teams | Breakdown of time investments by team and epic. It helps compare the contribution of different teams to each epic |
Activities Completed Over Time | Activities completed per epic over time. It helps visualize work being completed for each epic over time and see which ones are ramping up or scaling down |
Cost Spent Per Month | Breakdown of budget allocated per epic. It provides a visual representation of budget invested in each epic |
Cost Spent Broken Down By Teams | Breakdown of budget invested by team and epic. It helps compare the contribution of different teams to each epic |
Budget Spent Over Time | Budget invested per epic over time. It helps visualize budget allocated for each epic over time and see which ones are ramping up or scaling down |
The Initiative Tracking Epic Details Dashboard provides insights on a specific epic. It helps narrow down on what may cause an epic to run over time and budget so that corrective actions can be taken.
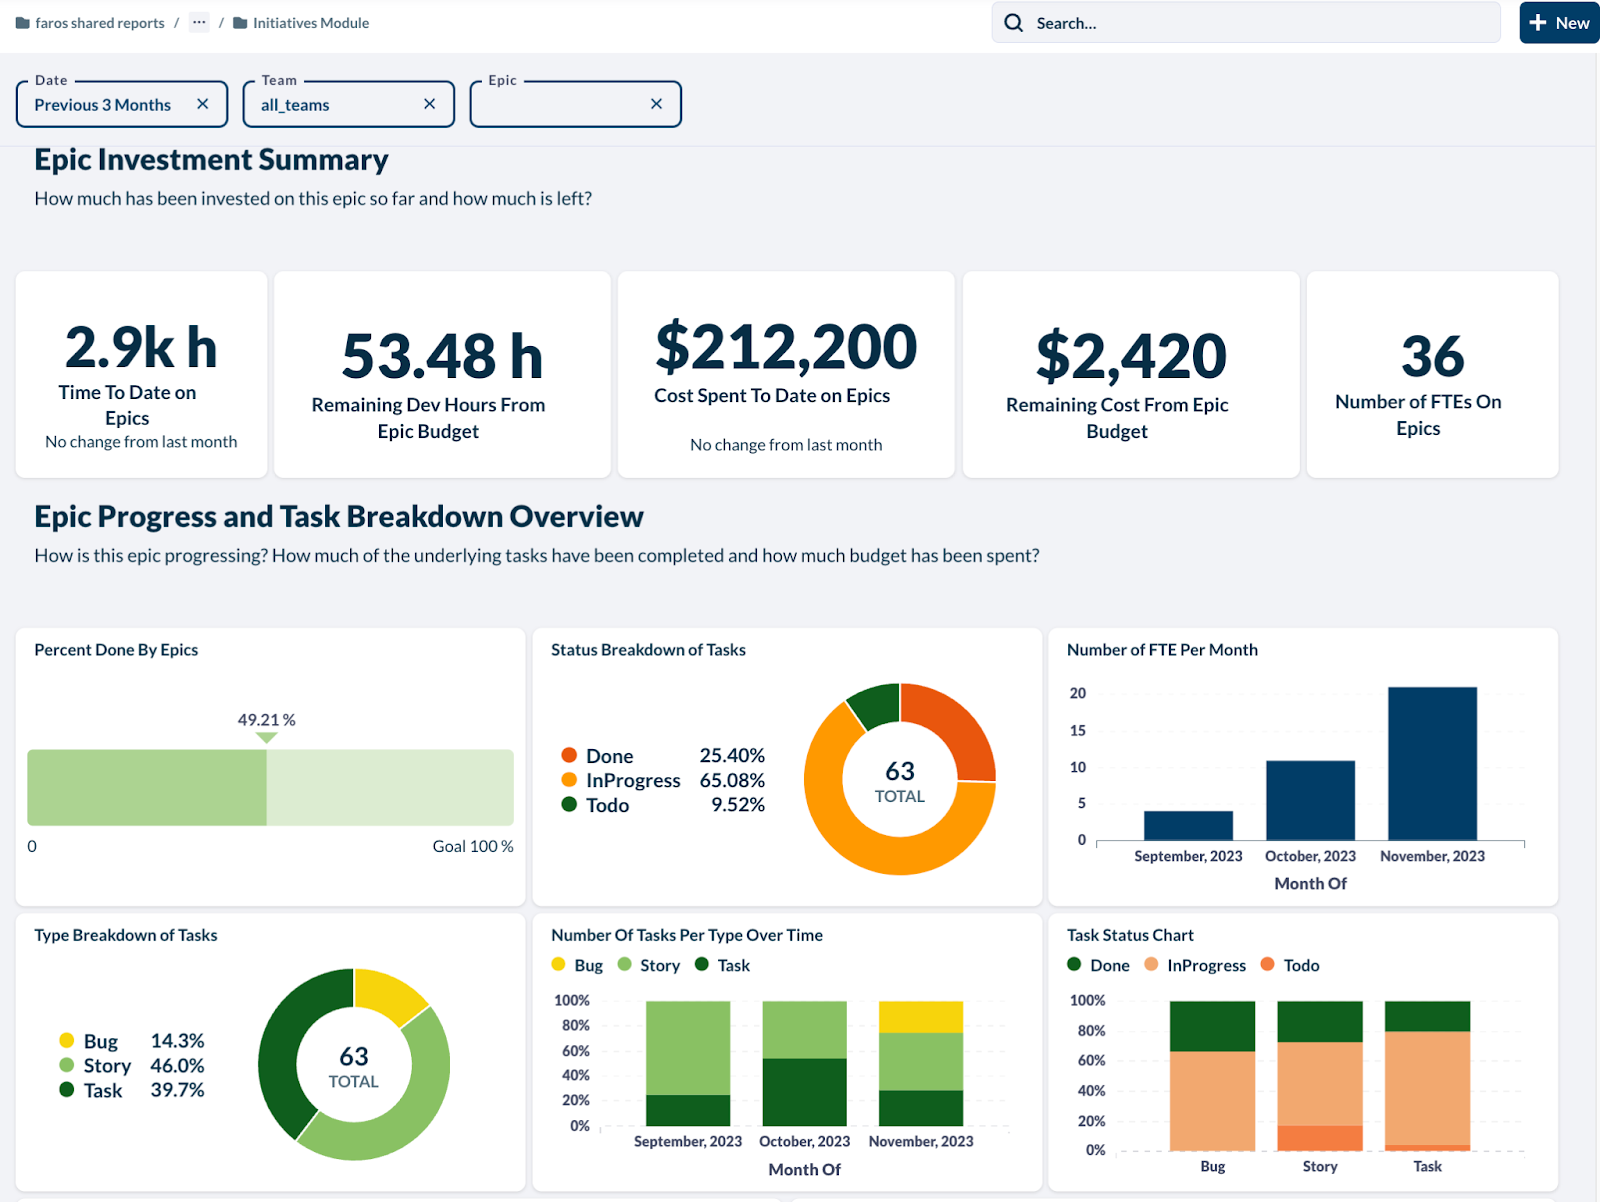
The dashboard is structured into four primary sections: epic investment summary, epic progress and task breakdown overview, investment on epic over time, and details of underlying tasks and most active contributors.
All metrics can be filtered by team, epic and a specific time period.
-
The desired team can be set using the Teams filter, and defaults to all teams. It is also possible to click on any of the team traces to drill down to a specific team
-
The desired time period is set by the Date filter at the top of the page, and defaults to the previous 3 months.
-
By default all epics are shown. You can select a specific epic or set of epics as desired using the Epic dropdown menu.
The Epic Investment Summary section summarizes how much has been invested on an epic so far and how much is left for completion.
Metric | Description |
Time Spent To Date | Number of hours spent on epic to date and monthly trend |
Remaining Dev Hours From Budget | Remaining number of hours based on allocated number of dev weeks for this epic and monthly trend |
Cost Spent To Date | Budget spent to date on epic and monthly trend |
Remaining Cost From Budget | Remaining budget based on allocated budget for this epic |
Number of FTEs Involved | Total number of FTEs that contributed to at least one underlying task for this epic |
The Epic Progress and Task Breakdown Overview section provides details on progress towards completion and break down by type of tasks, status and team.
Metric | Description |
Percent Done For Epic | Percentage of the epic’s underlying tasks that have been completed to date |
Status Breakdown of Tasks | Breakdown of the epic’s underlying tasks by status |
Number of FTE Per Month | Number of FTEs working on this epic each month |
Type Breakdown of Tasks | Breakdown of the epic’s underlying tasks by type |
Number Of Tasks Per Type Over Time | Breakdown of the type of tasks in the epic over time |
Task Status Chart | Breakdown of the status of the tasks in the epic over time |
Tasks Completed Over Time | Number of tasks in this epic completed over time |
Cumulative Cost Over Time | Budget spent on this epic over time |
The Investment on Epic Over Time section provides a view on time and budget spent on this epc over time as well as a view of teams contributing to this epics and their impact on time and budget overrun.
Metric | Description |
Time Spent Per Month On Epics | Total time spent on epic per month |
Time Spent By Teams Over Time | Time spent on epic per month, broken down by team |
Total Time Spent By Teams | Total time spent on epic, broken down by team |
Cost Spent Per Month On Epics | Budget spent on epic per month |
Cost Spent By Teams Over Time | Budget spent on epic per month, broken down by team |
Total Cost Spent By Teams | Budget spent on epic, broken down by team |
Team Contribution to Time Overrun | Breakdown of how each team contributes to the time overrun for the epic, based on allocated dev hours. The taller a bar, the larger the contribution to overrun. It helps identify teams running behind and which may require better resource allocation and planning |
Team Contribution to Cost Overrun | Breakdown of how each team contributes to budget overrun for the epic, based on allocated budget. The taller a bar, the larger the contribution to overrun. It helps identify teams running over budget and which may require better resource allocation and planning |
The Details of Underlying Tasks and Most Active Contributors section provides granular information on the tasks of this epic and who is most involved.
Metric | Description |
Task Level Details | List of tasks belonging to this epic with their priority, type, status, time spent and cost |
Top 5 FTEs with Maximum Tasks Assigned | Developers who have been assigned the most task for this epic |
Top 5 FTEs with Maximum Time Spent | Developers who have spent the most time on this epic |
The Initiative Tracking Team Details Dashboard provides insights on what a particular team is working on, including key initiatives and underlying epics. I can help investigate whether a team is staffed appropriately to accomplish its goals.
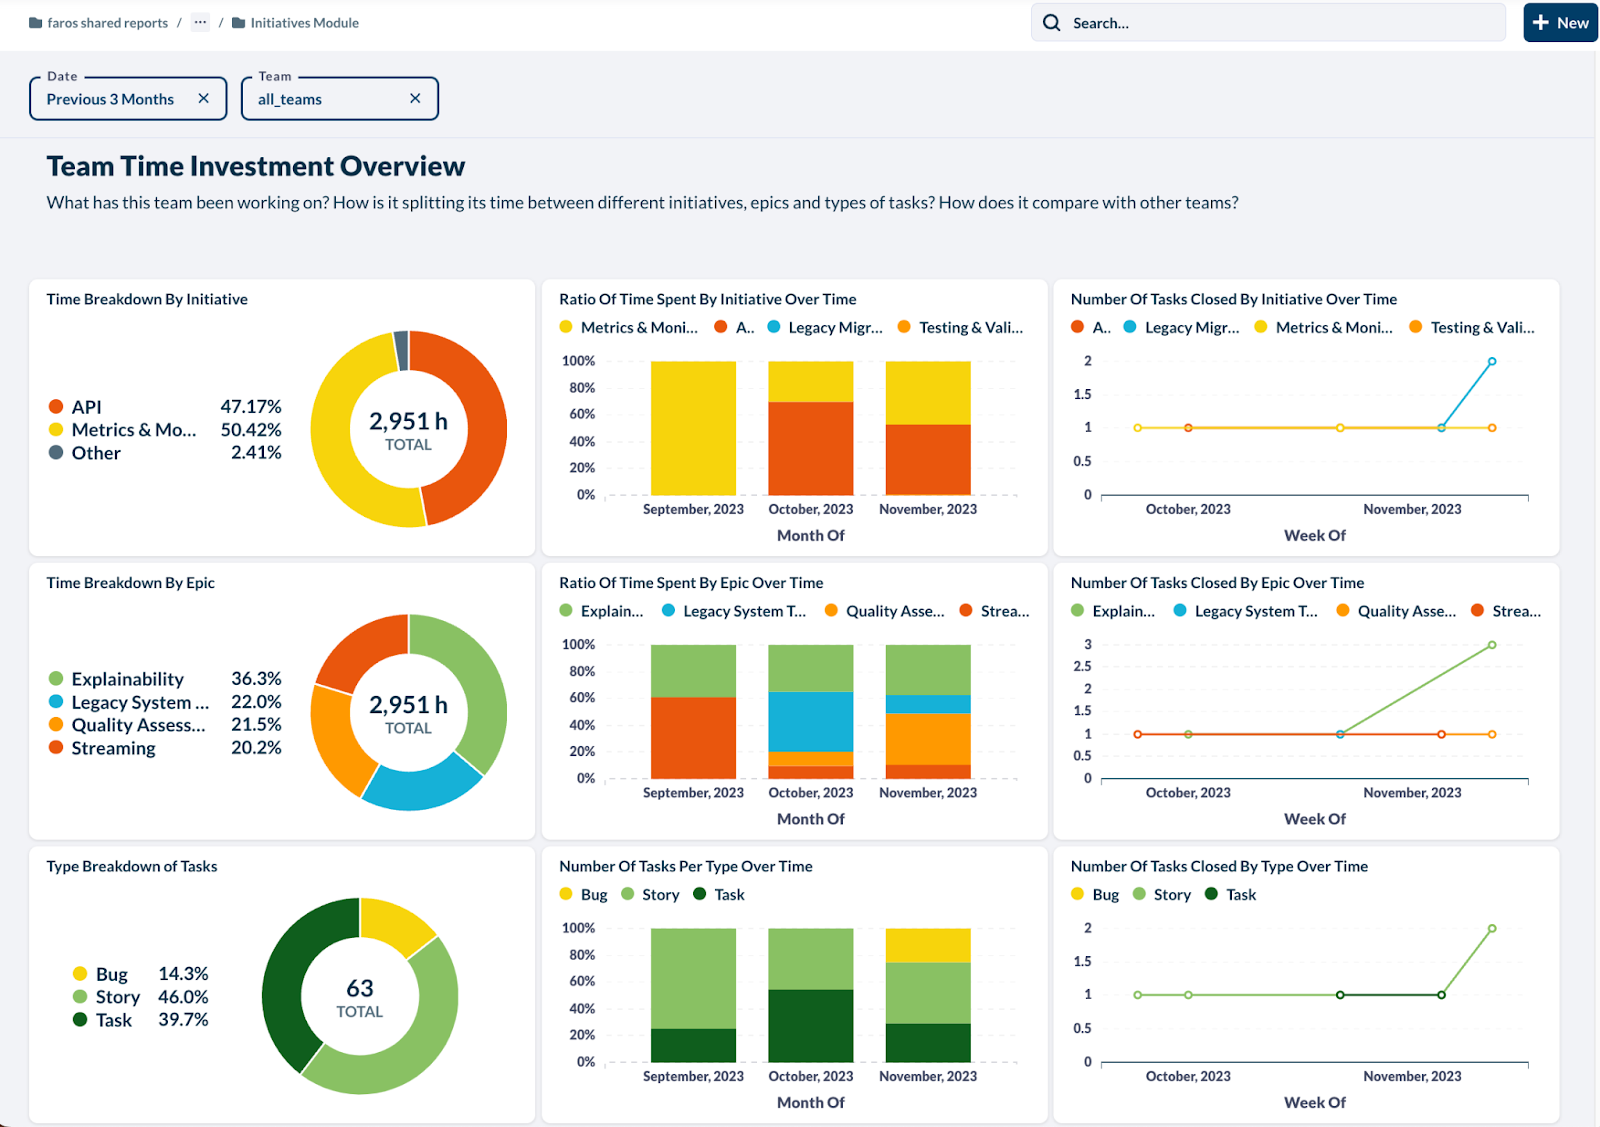
The dashboard is structured into four primary sections: team time investment overview, team time investments compared to other teams, team contributions to time and budget overruns and details of recent tasks and most active contributors
All metrics can be filtered by team and a specific time period.
-
The desired team can be set using the Teams filter, and defaults to all teams. It is also possible to click on any of the team traces to drill down to a specific team
-
The desired time period is set by the Date filter at the top of the page, and defaults to the previous 3 months.
The Team Time Investment Overview section provides visibility into the initiatives, epics and tasks a team has been working on.
Metric | Description |
Time Breakdown By Initiative | Time spent broken down by initiative. This helps visualize which initiatives a team has spent most time on |
Ratio Of Time Spent By Initiative Over Time | Ration of time spent by initiative over time. This helps visualize which initiatives are consistently being worked on by a team and which initiatives the team is more punctually involved with |
Number Of Tasks Closed By Initiative Over Time | Number of tasks closed by team over time and by initiative. This helps visualize which initiatives is a team ramping up on or winding down on |
Time Breakdown By Epic | Time spent broken down by epic. This helps visualize which epics a team has spent most time on |
Ratio Of Time Spent By Epic Over Time | Ration of time spent by epic over time. This helps visualize which epics are consistently being worked on by a team and which epics the team is more punctually involved with |
Number Of Tasks Closed By Epic Over Time | Number of tasks closed by team over time and by epic. This helps visualize which epics is a team ramping up on or winding down on |
Type Breakdown of Tasks | Tasks handled by a team, broken down by type. This helps see if a team is mostly focusing on keeping the lights on and fixing bugs or working on new features |
Number Of Tasks Per Type Over Time | Ratio of time spent on different types of tasks over time. This helps see if a team has a healthy mix of bugs and other types of tasks and how is this mix evolving over time |
Number Of Tasks Closed By Type Over Time | Number of tasks closed by team over time and by type. This helps see if a team has a healthy mix of bugs and other types of tasks and how is this mix evolving over time |
The Team Time Investments Compared to Other Teams section lets you compare the investments and key priorities of different teams.
Metric | Description |
Time Spent Broken Down By Initiative Per Team | Breakdown of time spent per initiative, for each team. This is helpful to compare the investment profiles of different teams |
Time Spent Broken Down By Epic Per Team | Breakdown of time spent per epic, for each team. This is helpful to compare the investment profiles of different teams |
Ratio Of Tasks Per Type Per Team | Breakdown of tasks by type, for each team. This is helpful to compare the type of work handled by different teams |
The Team Contributions To Time and Budget Overruns section highlights which initiatives and epics are most dependent on this team and what is the team running behind on.
Metric | Description |
Team Contribution to Time Overrun By Initiative | Breakdown of how a team contributes to the time overrun of different initiatives, based on allocated dev hours. The taller a bar, the larger the contribution to the overrun. It helps identify initiatives this team is running behind on and which may require better resource allocation and planning |
Team Contribution to Cost Overrun By Initiative | Breakdown of how a team contributes to the budget overrun of different initiatives, based on allocated budget. The taller a bar, the larger the contribution to the overrun. It helps identify initiatives this team is running over budget on and which may require better resource allocation and planning |
Team Contributions to Time Overrun By Epic | Breakdown of how a team contributes to the time overrun of different epics, based on allocated dev hours. The taller a bar, the larger the contribution to the overrun. It helps identify epics this team is running behind on and which may require better resource allocation and planning |
Team Contributions to Time Overrun By Epic | Breakdown of how a team contributes to the budget overrun of different epics, based on allocated budget. The taller a bar, the larger the contribution to the overrun. It helps identify epics this team is running over budget on and which may require better resource allocation and planning |
The Details of Recent Tasks and Most Active Contributors section provides granular information on the tasks handled by a team and who is most involved.
Metric | Description |
Recently Closed Tickets | List of tasks handled by this team with their priority, type, status, time spent and cost |
Top 5 FTEs with Maximum Tasks Assigned | Developers who have been assigned the most tasks |
Top 5 FTEs with Maximum Tasks Assigned By Initiative | Developers who have been assigned the most tasks, broken down by initiative |
Top 5 FTEs with Maximum Tasks Assigned By Epic | Developers who have been assigned the most tasks, broken down by epic |
Top 5 FTEs with Maximum Time Spent | Developers who have spent the most time on tasks |
Top 5 FTEs with Maximum Time Spent By Initiative | Developers who have spent the most time on tasks, broken down by initiative |
Top 5 FTEs with Maximum Time Spent By Epic | Developers who have spent the most time on tasks,, broken down by epic |
The Initiative Tracking Module focuses on bringing visibility into Initiatives. Initiatives are large projects which are critical to the business. They can involve multiple teams and multiple projects. Their size and duration can vary, but typically an initiative would be large enough to be monitored at the Leadership level where they constitute the most common zoom level to report on the progress and outputs of the product and engineering organization.
In Faros, Initiatives are defined based on a filtering logic on tasks. A prerequisite for using the Initiative Tracking Module is thus to connect your Task Management System. You will then be able to create Initiatives directly in Faros as explained below.
The following should be set up on Faros in order to get the full functionality of the Initiatives module:
-
Task Management, TMS: Talks will be linked to a specific initiative
-
Organization and Team Members: This is needed for selecting who's the owner of the initiative and correctly linking activities to participants
The Set up for the Initiative Tracking module is accessible under the Admin Settings > Module Setup.
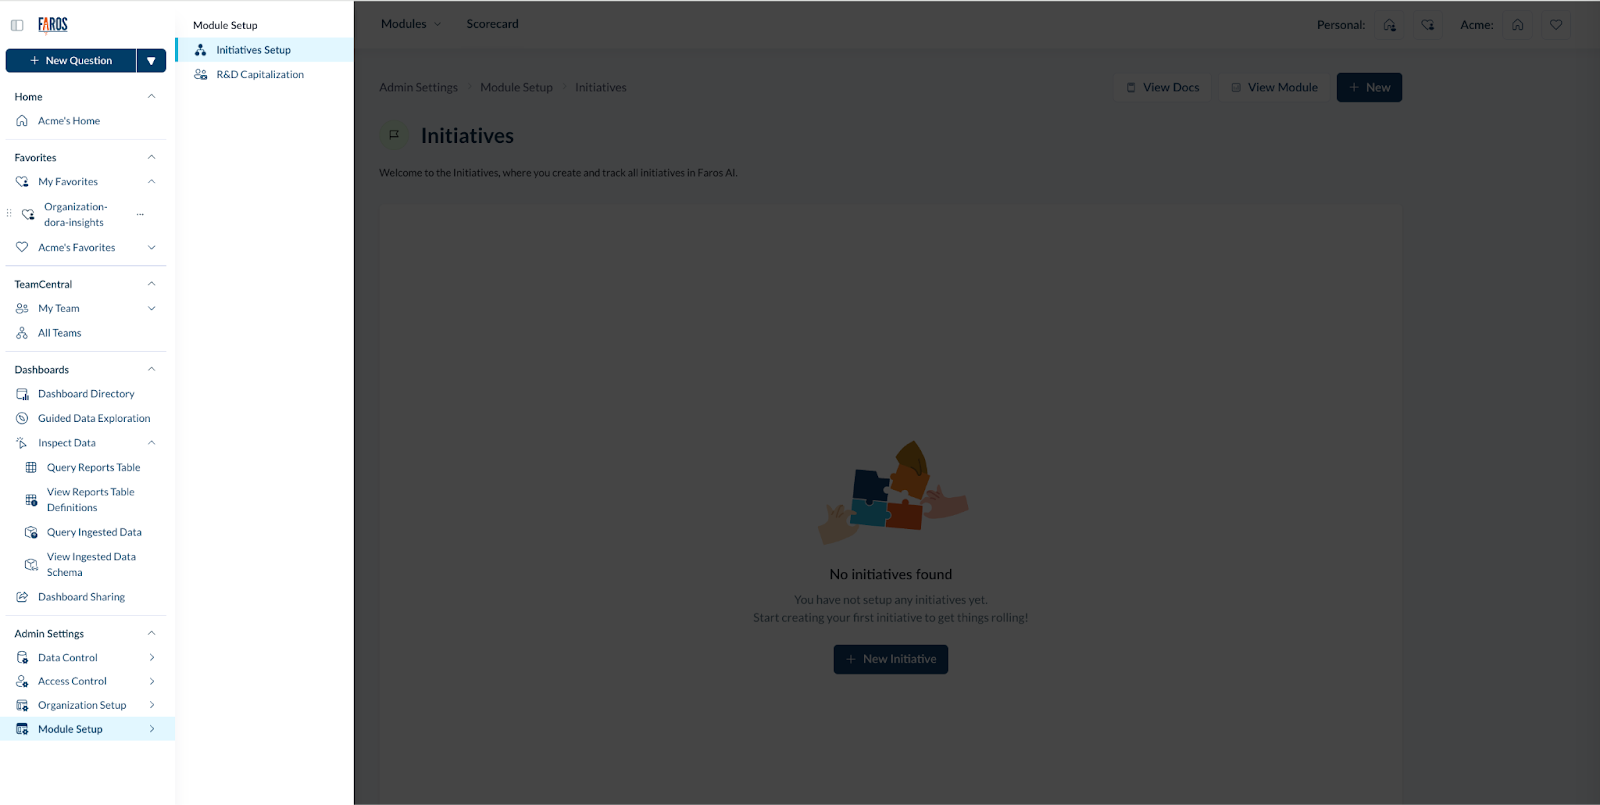
Click the “New Initiative” button in the middle of the page or the “New” button on the top right, and fill the required information on the side panel.
For each initiative you can describe the initiative (name, owner etc), define which tasks belong to the initiative via filtering logic on tasks and input expected dev hours and budget so you can track and monitor progress over time compared to plans.
You can edit the configuration at any time and it will be reflected in the dashboards on the next sync.
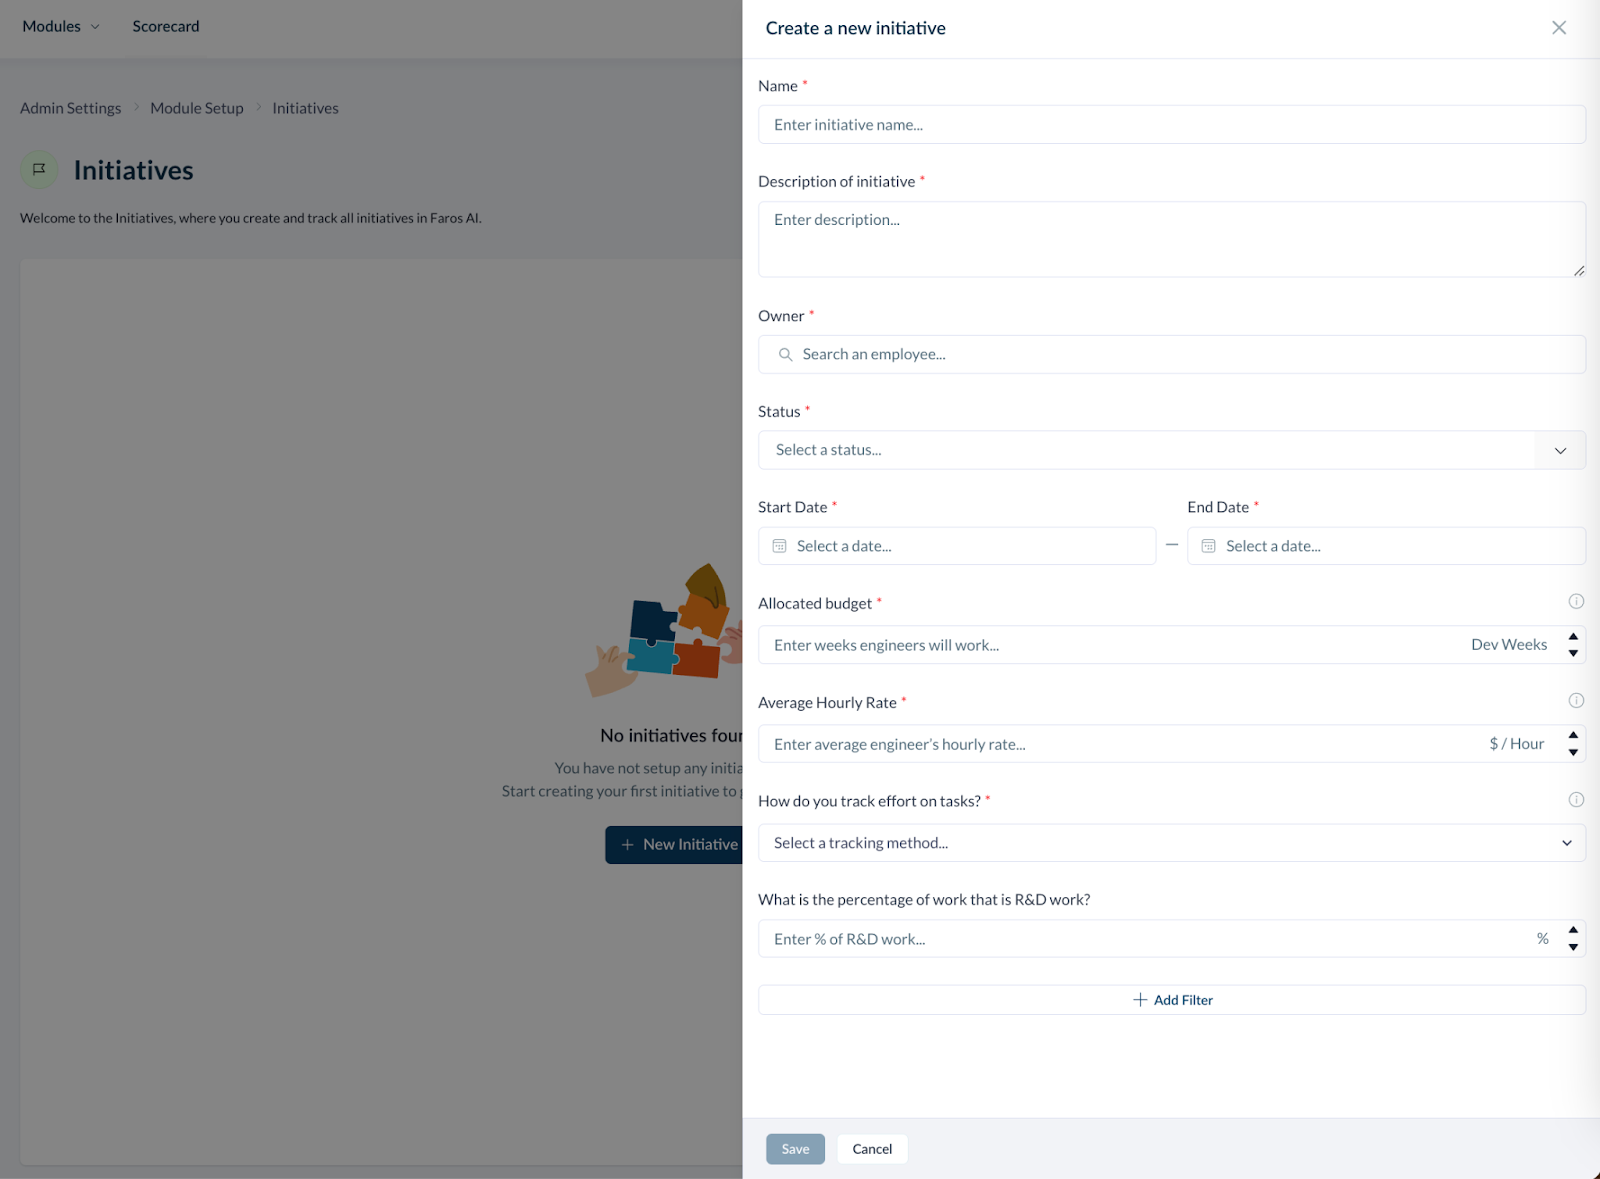
To create an Initiative, start by inputting the following information:
Name | Name of the initiative |
Description of initiative | Description of the initiative |
Owner | Employee owner for the initiative |
Status | Either Planned, In Progress, Completed or Canceled |
Start Date | Date initiative started |
End Date | Date initiative is expected to be completed |
Allocated Budget | Number of dev weeks allocated for the initiative |
Average Hourly Rate | Average hourly rate for the engineers working on the initiative |
Next, you will need to indicate how effort is tracked on the filtered tasks by selecting one of three options:
1. Time in progress: Hours are calculated based on the amount of time the Task has been in progress
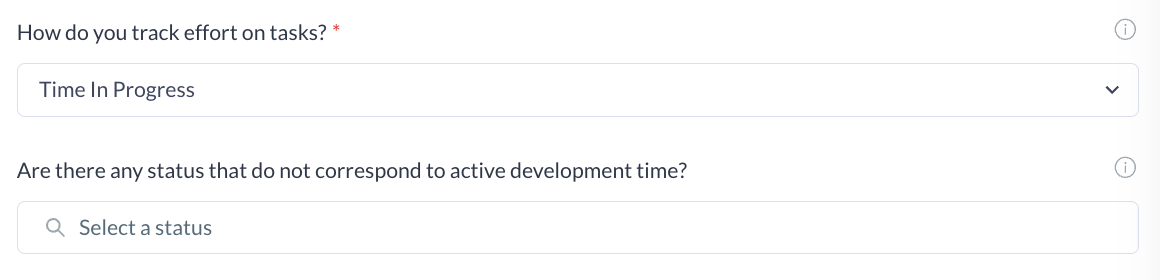
You can also indicate if you have custom statuses that do not correspond to active development time, such as “Waiting”. Time spent in these stages will not be taken into account, making the effort calculation more accurate.
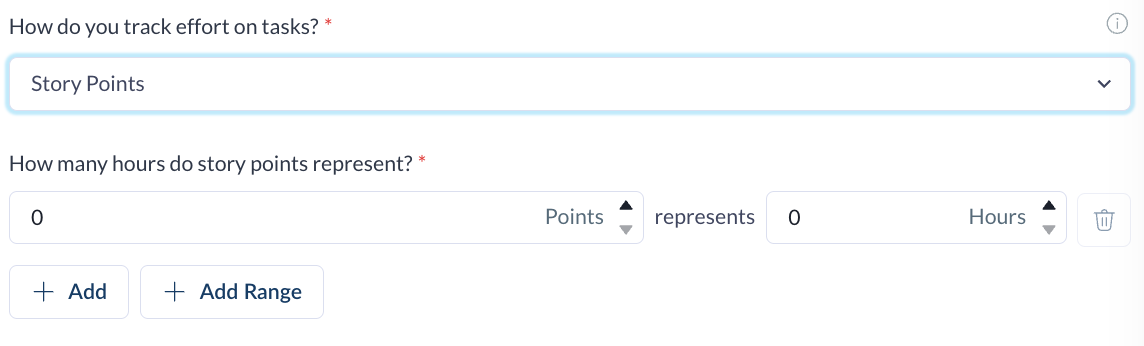
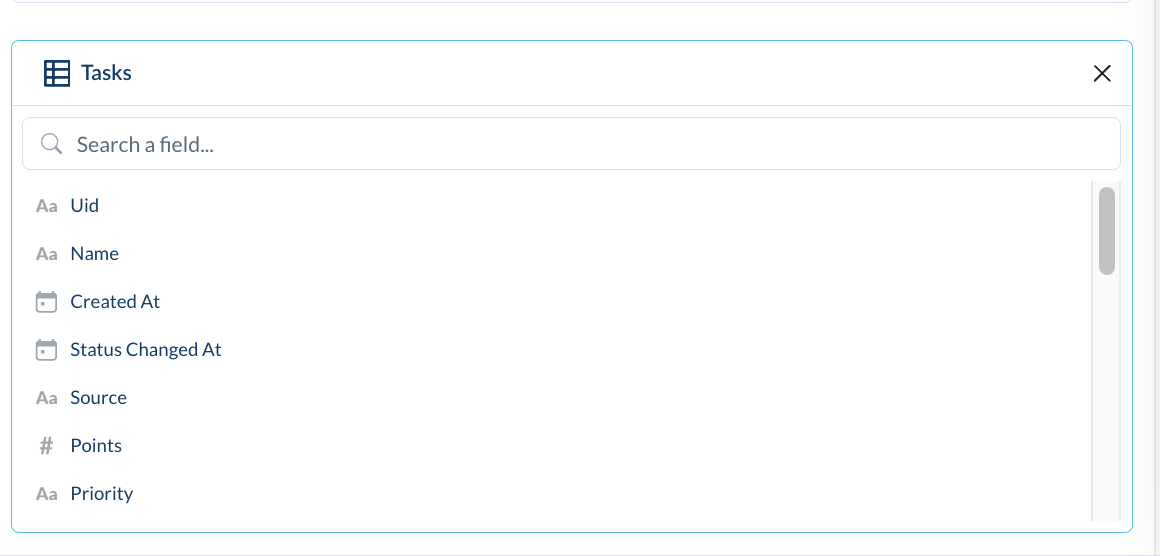
2. Story Points: Hours are calculated mapping story points to hours. When selected you will also need to indicate which field on the Task stores the points and how each possible value or range of values is mapped to hours, as shown below:
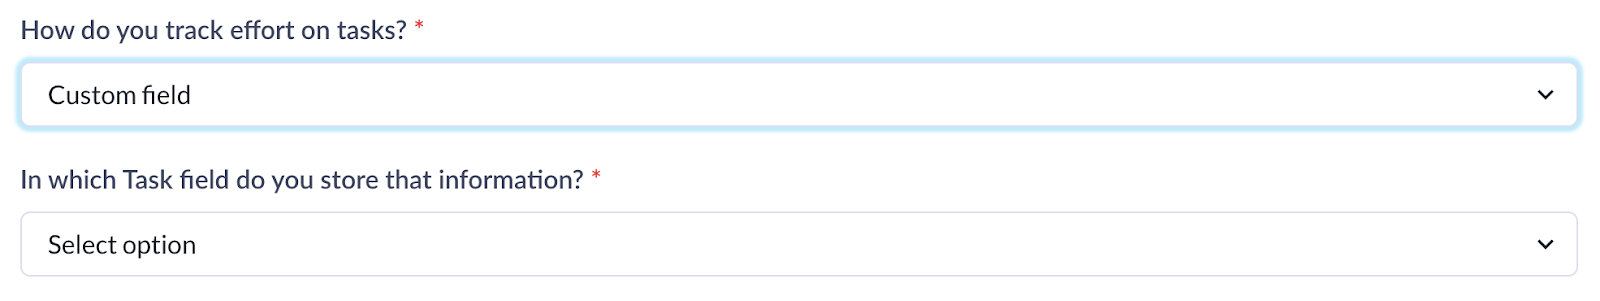
3. Custom Field: Choose this option if you already have a field on Task storing effort (hours) and select which field it is:
Optionally, you can indicate the percentage of work in this initiative that can be considered R&D Work. This will be leveraged to automate R&D Cost Capitalization by the R&D Cost Capitalization Module. You can also set this value later when setting up this module.
Finally, you can use customizable filter conditions for selecting which tasks should be linked to this initiative:
Additional notes on how effort is calculated for each initiative:
-
The “started at” value for an activity comes from the first time the task was moved to “In Progress”.
-
The “ended at” value for an activity will only be filled if the task current status is “Done” with the time the status was changed to it.
-
The “status” value for an activity is a direct mapping from the task status (Todo->Planned, InProgress->InProgress, Done->Completed)
-
The “participant” value for the activity will reference to the task last assignee (the tms_User needs to be correctly linked to an org_Employee - see Platform Prerequisites above).
-
When selecting the “Time in Progress” option, extra computation is performed to make sure time is not counted multiple times when several tasks are “in progress” in parallel. Time for overlapping tasks (for the same developer) is allocated to the first task in the overlapping tasks set that changes status after this time in common starts. We assume that is the one the developer was actually working on during that overlapping time. This way time is attributed to only one task for any given hour of the week.
-
When selecting the “Time in Progress” option, only business hours are taken into account (Monday to Friday, 9am to 5pm PST). Evenings and week-end hours are not counted. If you have different business hours, please contact the Faros team.
Updated 5 months ago