
AI Copilot Evaluation Module
Summary
What is this module for?
Maximizing the value of coding assistants such as GitHub Copilot, Amazon Q Developer, and more.
More Details
This module provides a view into adoption, developer sentiment, and downstream impact of coding assistants (GitHub Copilot, Amazon Q Developer, etc) to help your organization:
- Track adoption and use over time
- Measure time savings and economic benefit
- Identify which teams benefit the most and how saved time is being reinvested
- Monitor speed, quality, and security to mitigate unintended consequences and maximize value
To access this module, go to Dashboards > Dashboards Directory > Faros Reports > AI Copilot Evaluation Module.
You can also access it from the Modules drop-down at the top of the screen.
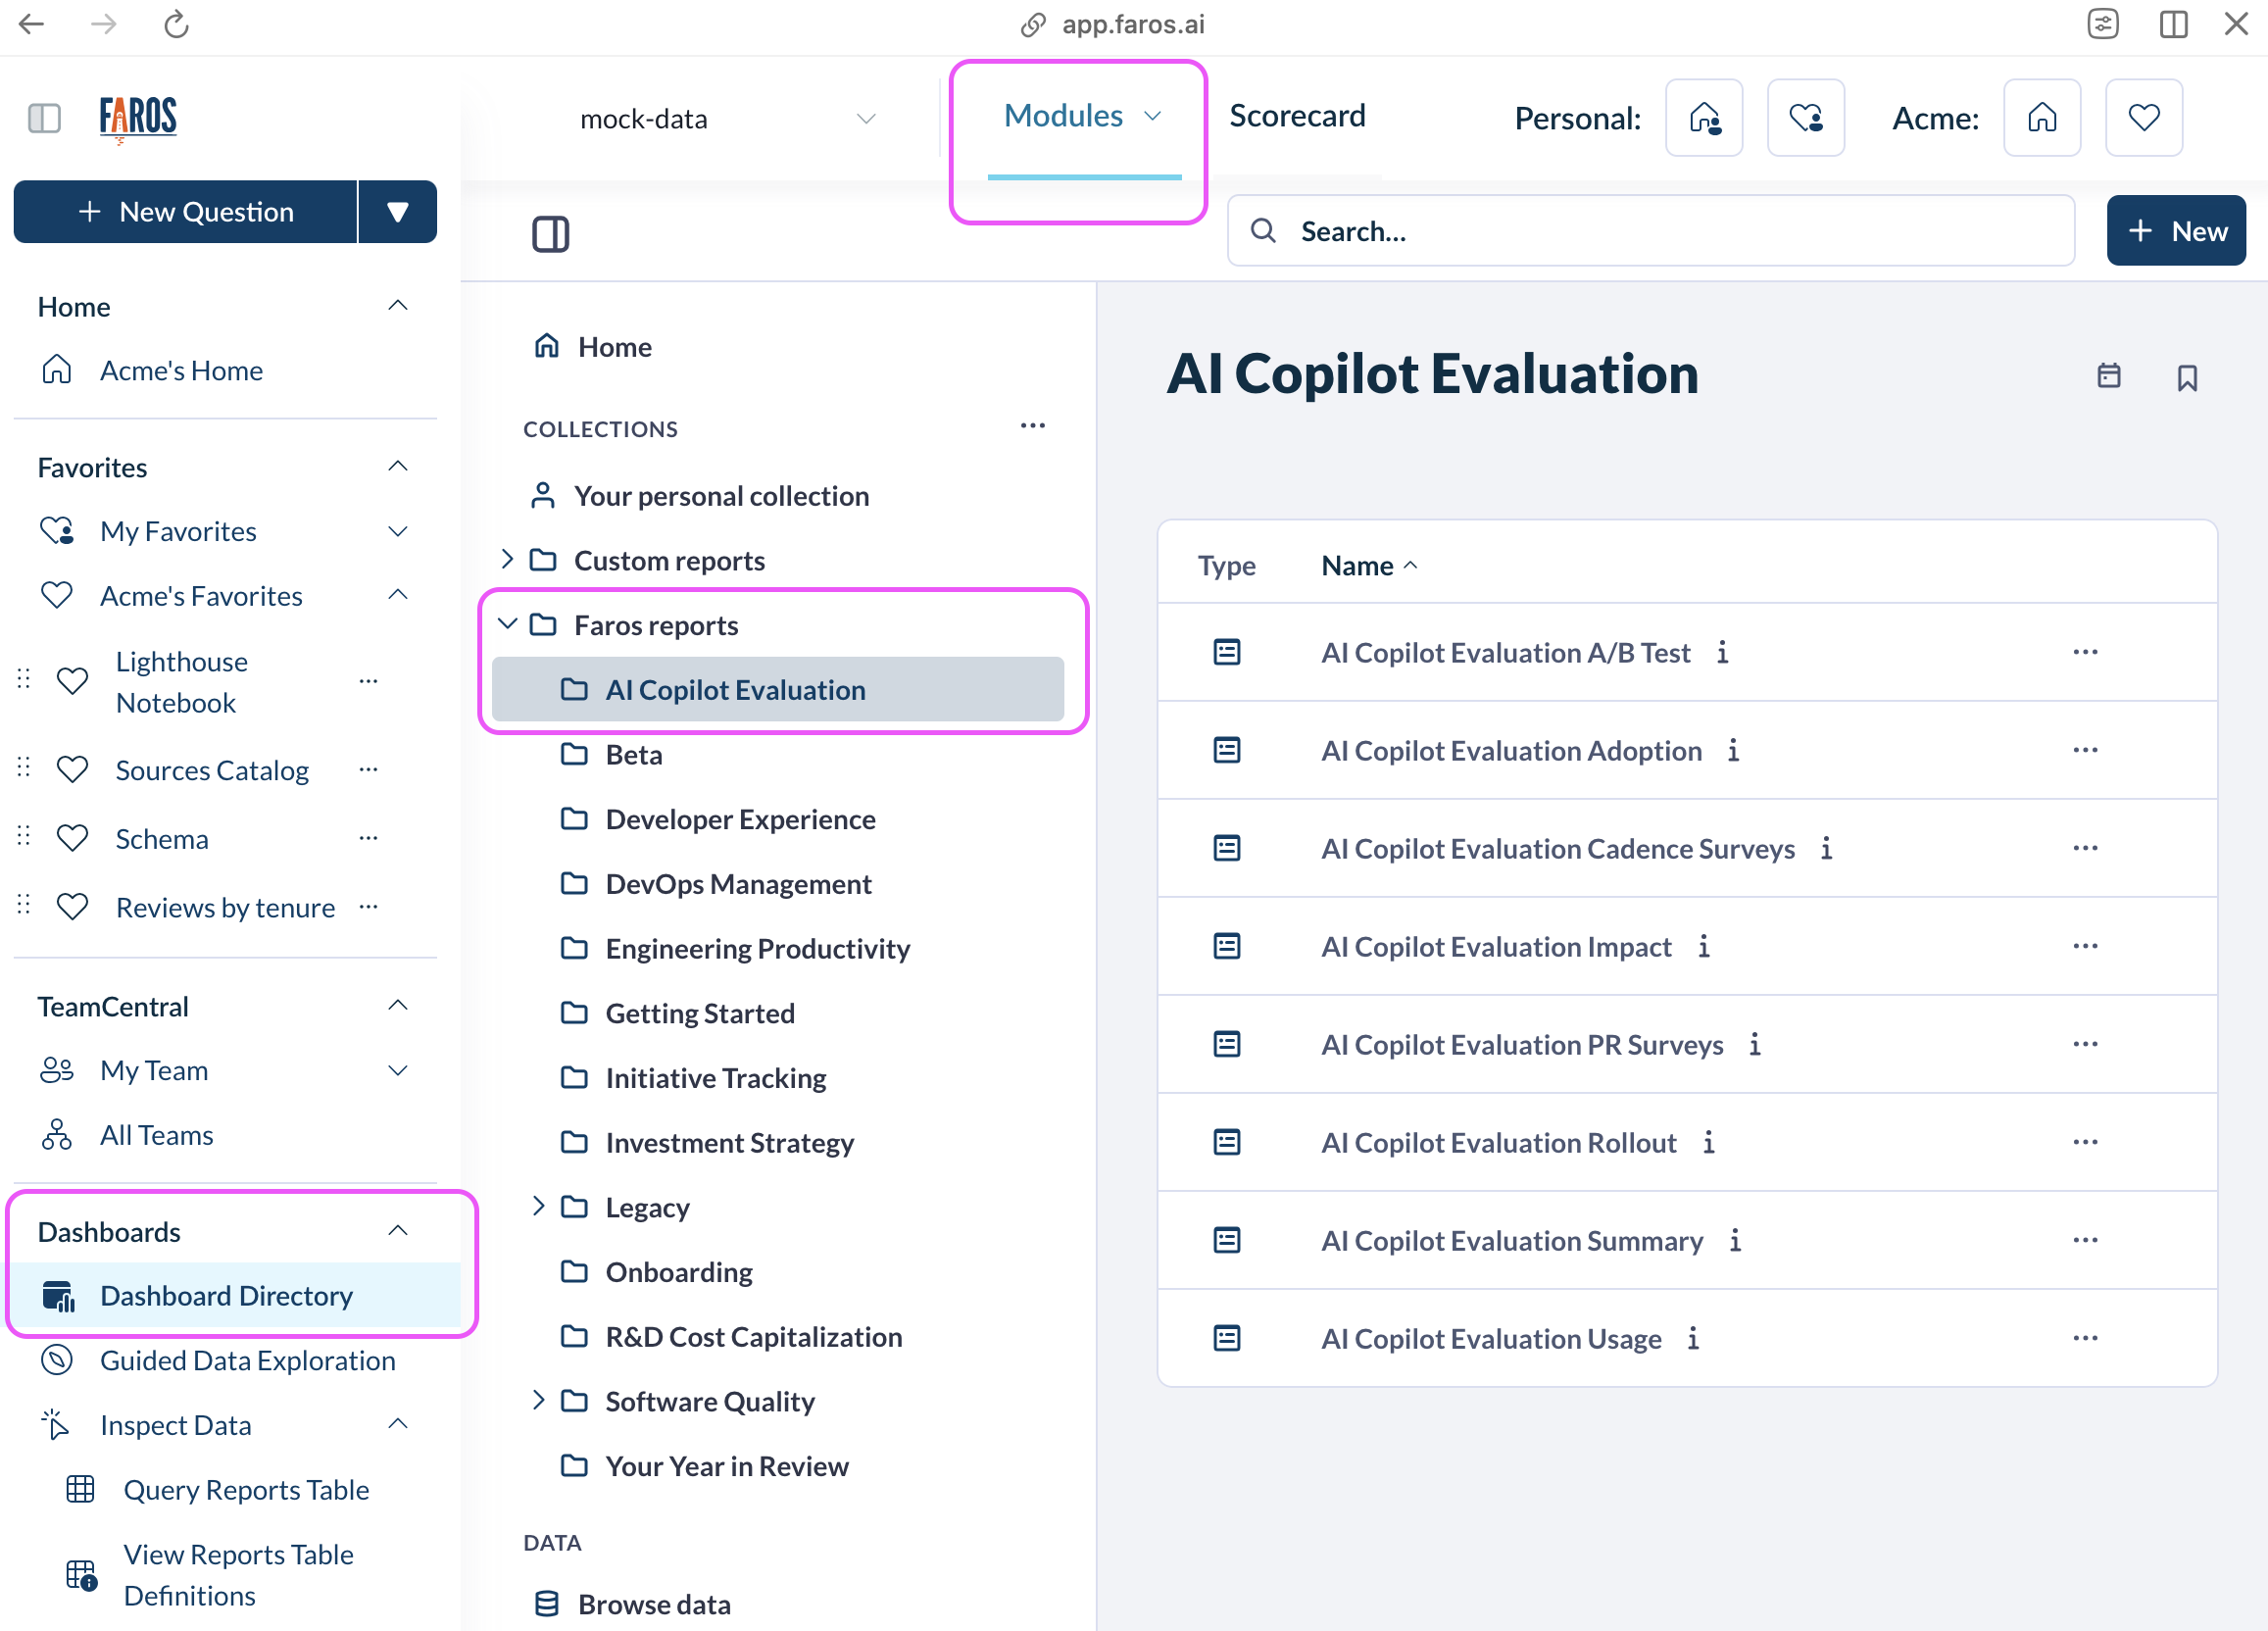
The AI Copilot Evaluation module is composed of 7 dashboards which map to your coding assistant value journey, from initial roll-out to larger scale deployments and long-term value optimization.
| Dashboard | Description |
|---|---|
| Summary Dashboard | A high level overview of the ROI provided by your coding assistant in terms of adoption, usage, time savings, and economic benefit from these savings |
| Adoption Dashboard | Tracks how many licenses have been attributed to your developers and how many are actively being used. It also provides detailed data on the usage of your coding assistant |
| A/B Test Dashboard | This dashboard is helpful for organizations evaluating coding assistants via a small scale pilot. It helps you compare different velocity and quality metrics that are likely to be most immediately impacted by using coding assistants |
| Rollout Dashboard | Helps you analyze how key velocity and quality metrics are changing for your developers as coding assistants are rolled out more broadly and for a longer period of time |
| Impact Dashboard | Gives insights into impact on more downstream velocity and quality metrics such as lead time or incidents for teams reaching a high level of coding assistant use |
| Cadence Surveys Dashboard | Gives you visibility into developer satisfaction, frequency of use, and time savings. It is based on surveys you can run at custom frequencies (for example, monthly) |
| PR Surveys Dashboard | Gives you similar data for surveys run in the flow of work, for example when a PR is submitted |
See below for additional details on each dashboard.
The AI Copilot Evaluation Summary Dashboard provides an overview of the following metrics to track usage & savings associated with coding assistants (GitHub Copilot, Amazon Q Developer, etc):
- Adoption
- Activity (Usage)
- Time Savings
- ROI
All metrics can be filtered down by team and a specific time period.
By default, the dashboard filters to All Teams and Previous 3 Months.
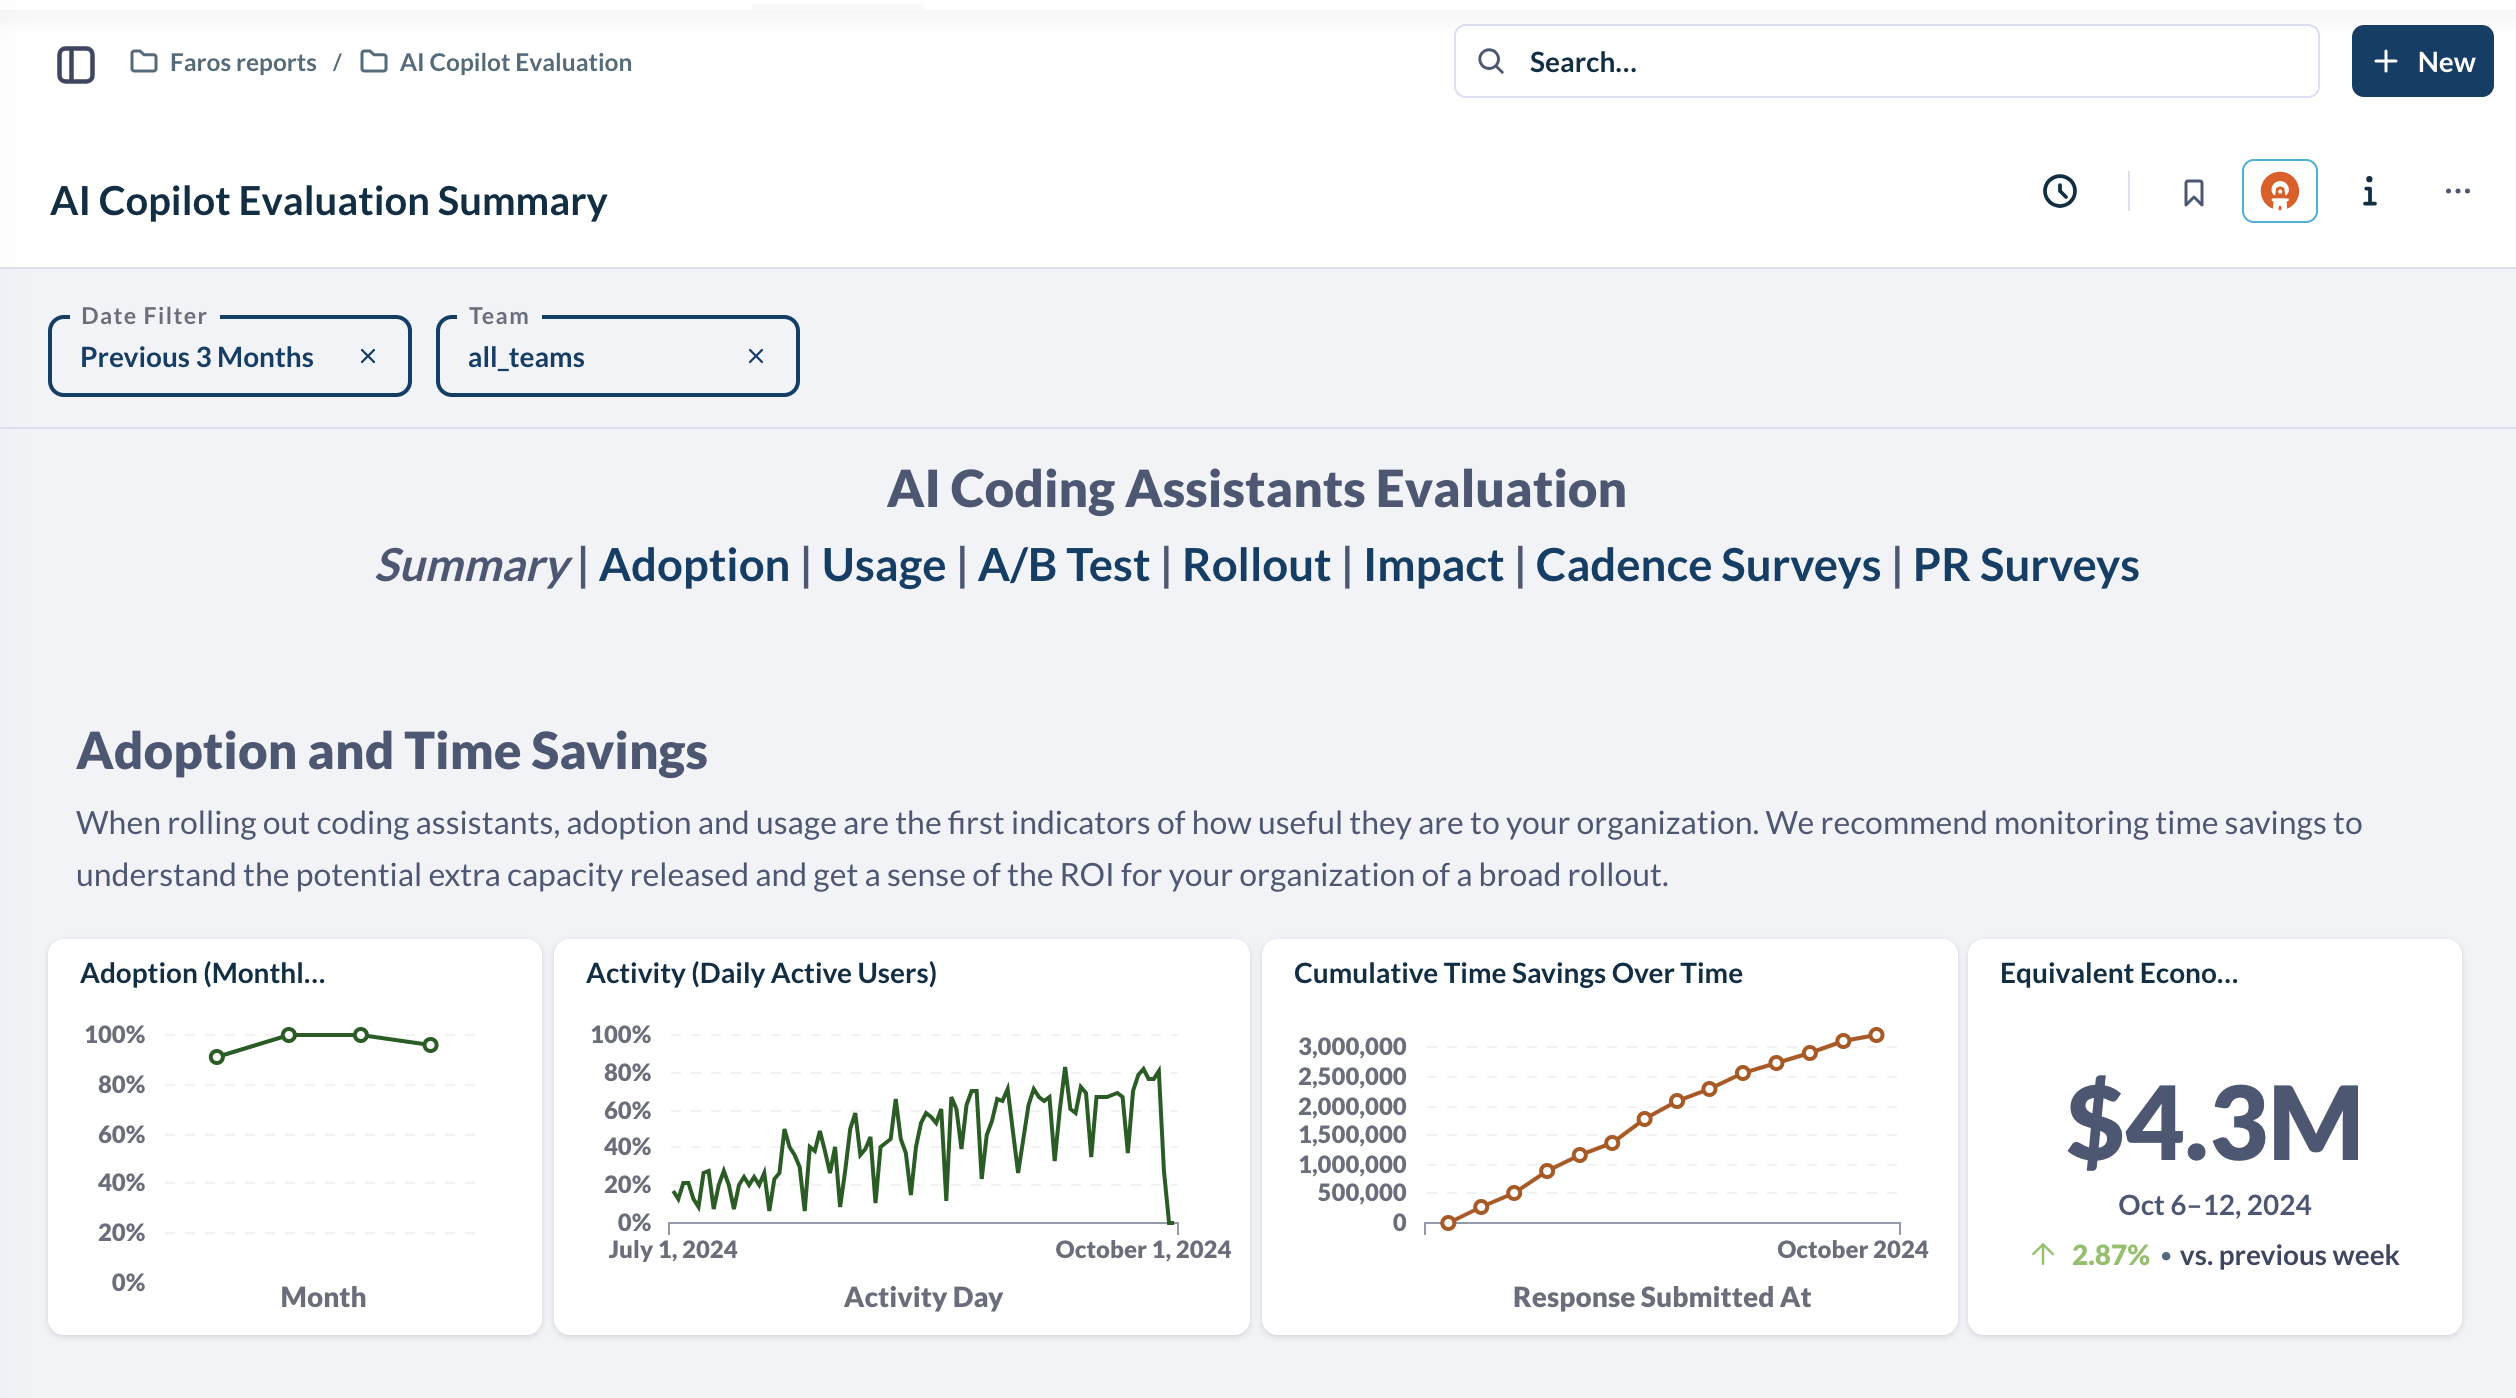
When rolling out coding assistants, adoption and activity are the first indicators of how useful they are to your organization.
Additionally, time savings can be used to understand the potential extra capacity released & the resulting ROI for your organization with a broad rollout of these tools.
The Summary Dashboard is composed of the following metrics:
| Metric | Description | Calculation |
|---|---|---|
| Adoption | Percentage of Monthly Active Users | Monthly active users (at least 1 use of coding assistant in the last month) / Enabled Users (users with a license) |
| Activity | Percentage of Daily Active Users | Daily active users (at least 1 use of coding assistant in a day)/ Enabled users (users with a license) |
| Cumulative Time Savings Over Time | Cumulative Time Savings for all developers in the selected organization | Sum of time savings collected from surveys over this time period |
| Equivalent Economic Benefit | Weekly cost savings for your organization (Note: to calculate ROI, divide this number by the weekly cost of the coding assistant tool) | Time Savings * flat engineering rate of $80 |
The AI Copilot Evaluation Adoption Dashboard tracks:
- How many licenses have been attributed to your developers
- How many licenses are actively being used
- Detailed data on the usage of your coding assistant
- Details on your power users and unused licenses
All metrics can be filtered down by team and specific time period. For GitHub Copilot, it can also be filtered down by GitHub Org.
-
The desired time period is set by the Date filter at the top of the page, and defaults to the previous 3 months.
-
The desired team(s) can be set using the Teams filter, and defaults to all teams.
-
The GitHub Org can be set using the GitHub Org filter, and defaults to all orgs (if you use GitHub Copilot only.
Adoption
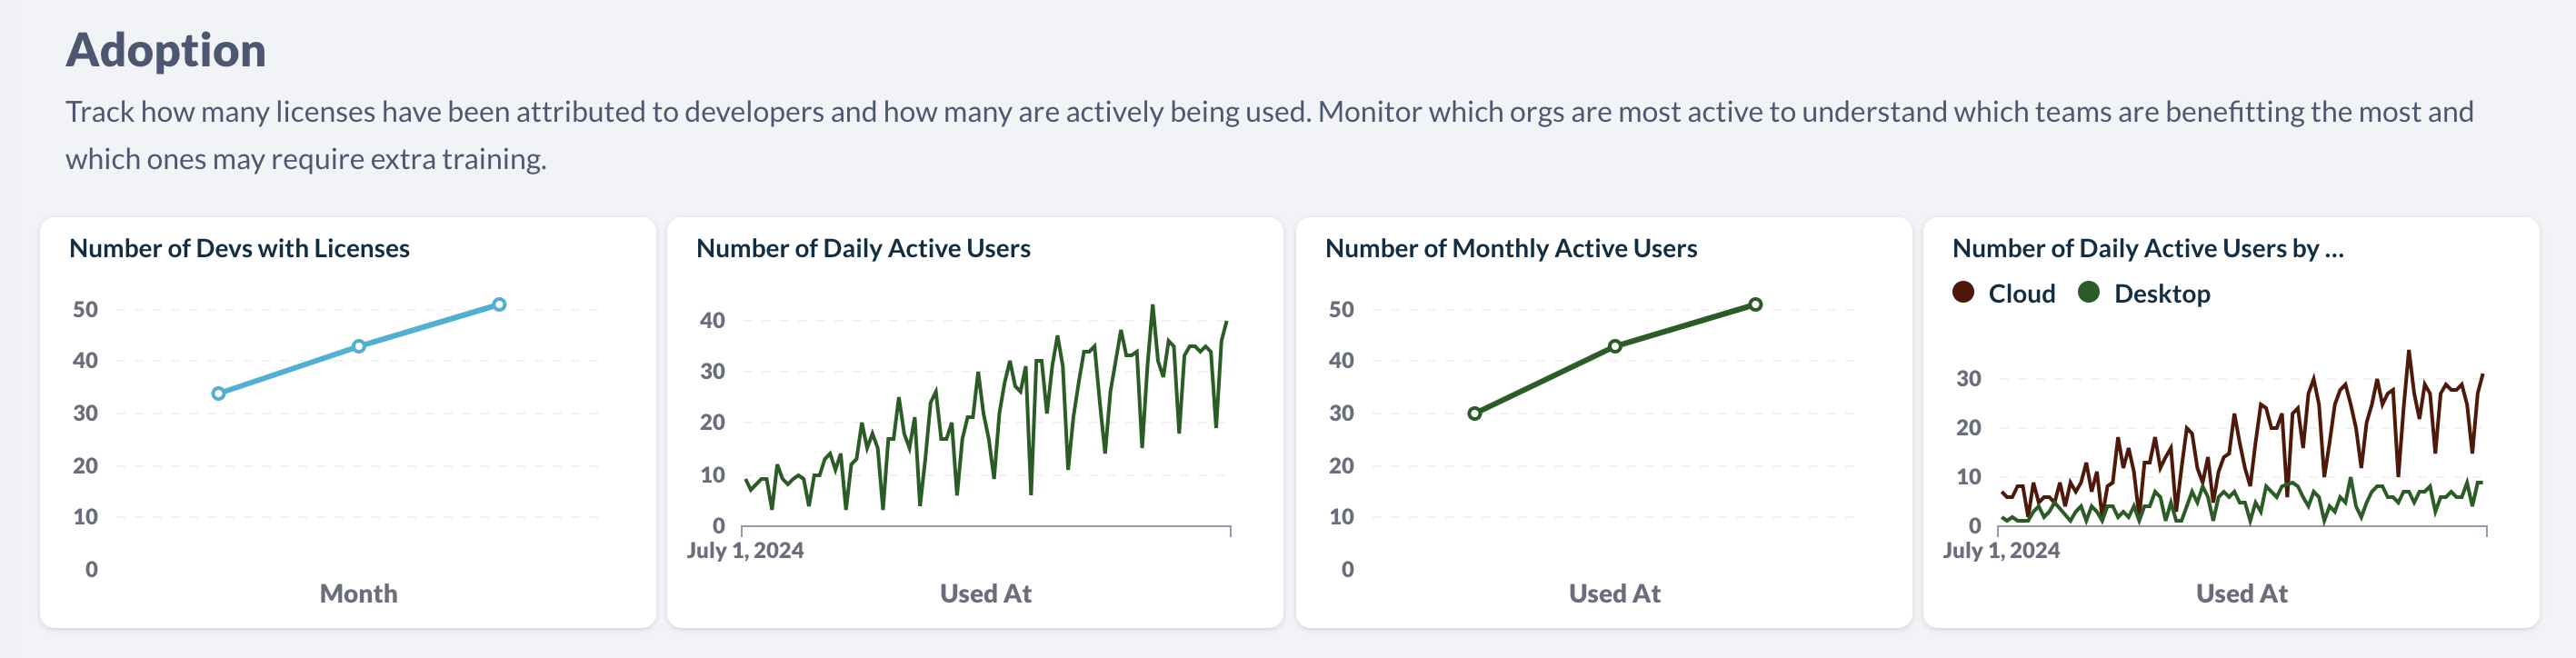
The Adoption section helps you track how many licenses have been attributed to developers and how many are actively being used. It is helpful to track which teams are benefiting the most from the tool. It is composed of the following metrics:
Metric
| Description |
Number of Devs with Licenses | Numbers of developers with a license for a coding assistant tool |
Number of Monthly Active Users | Number of users with at least 1 use of a coding assistant in a month |
Number of Daily Active Users | Number of users with at least 1 use of a coding assistant in a day |
Number of Daily Active Users by Sub-Org | Number of users with at least 1 use of a coding assistant in a day, broken down by sub-org |
Power Users
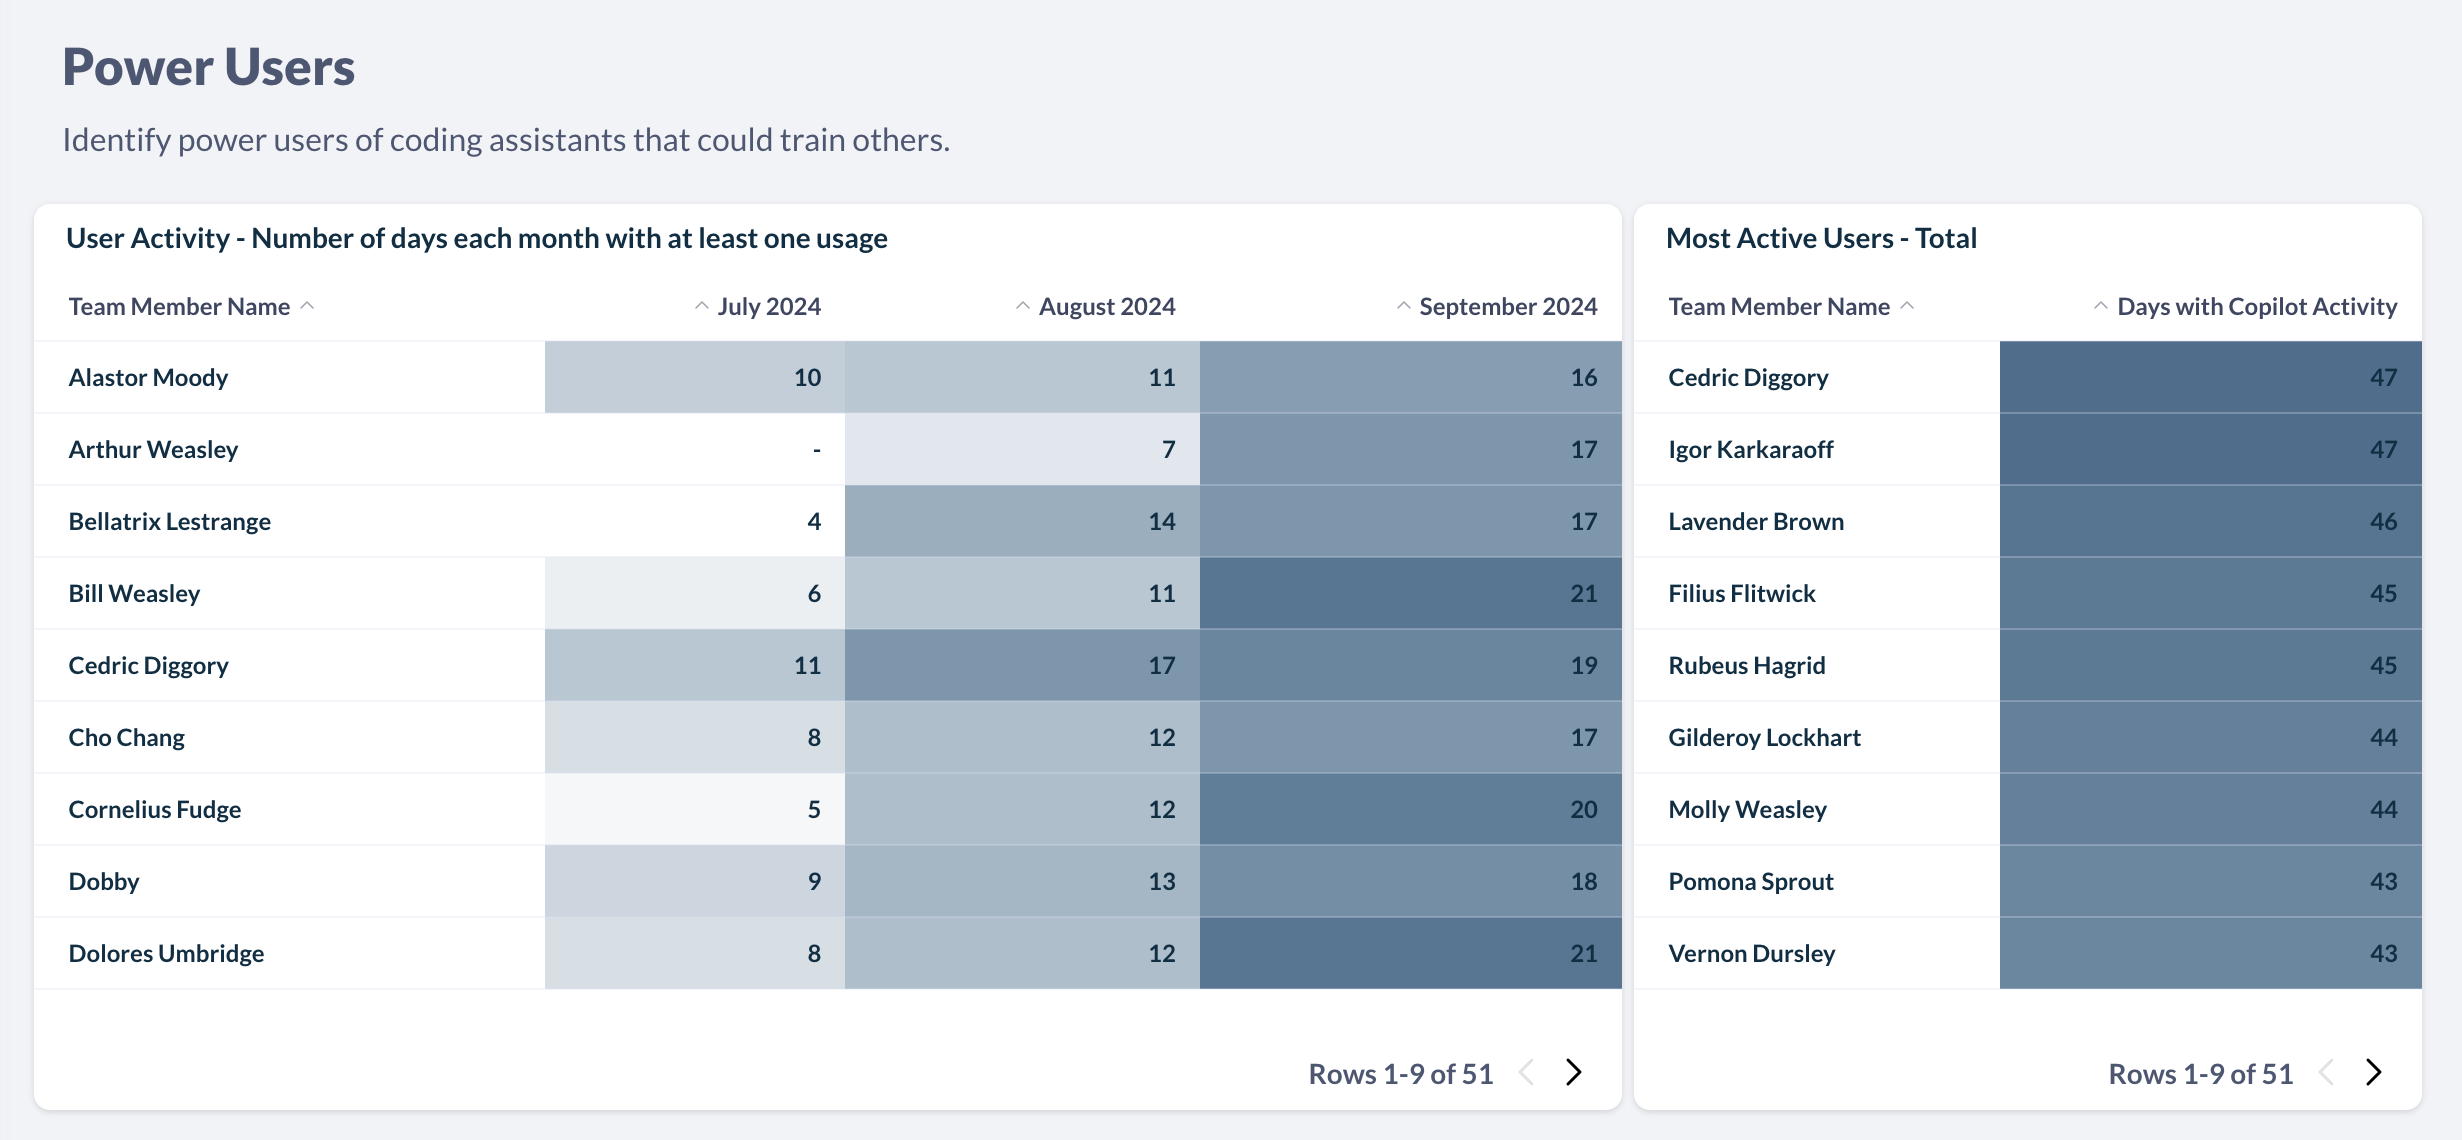
The Power Users section helps you identify power users of coding assistants that could train others. Power users are defined as developers who had usage on 15 different days or in 30 different hours in a calendar month.
Unused Licenses
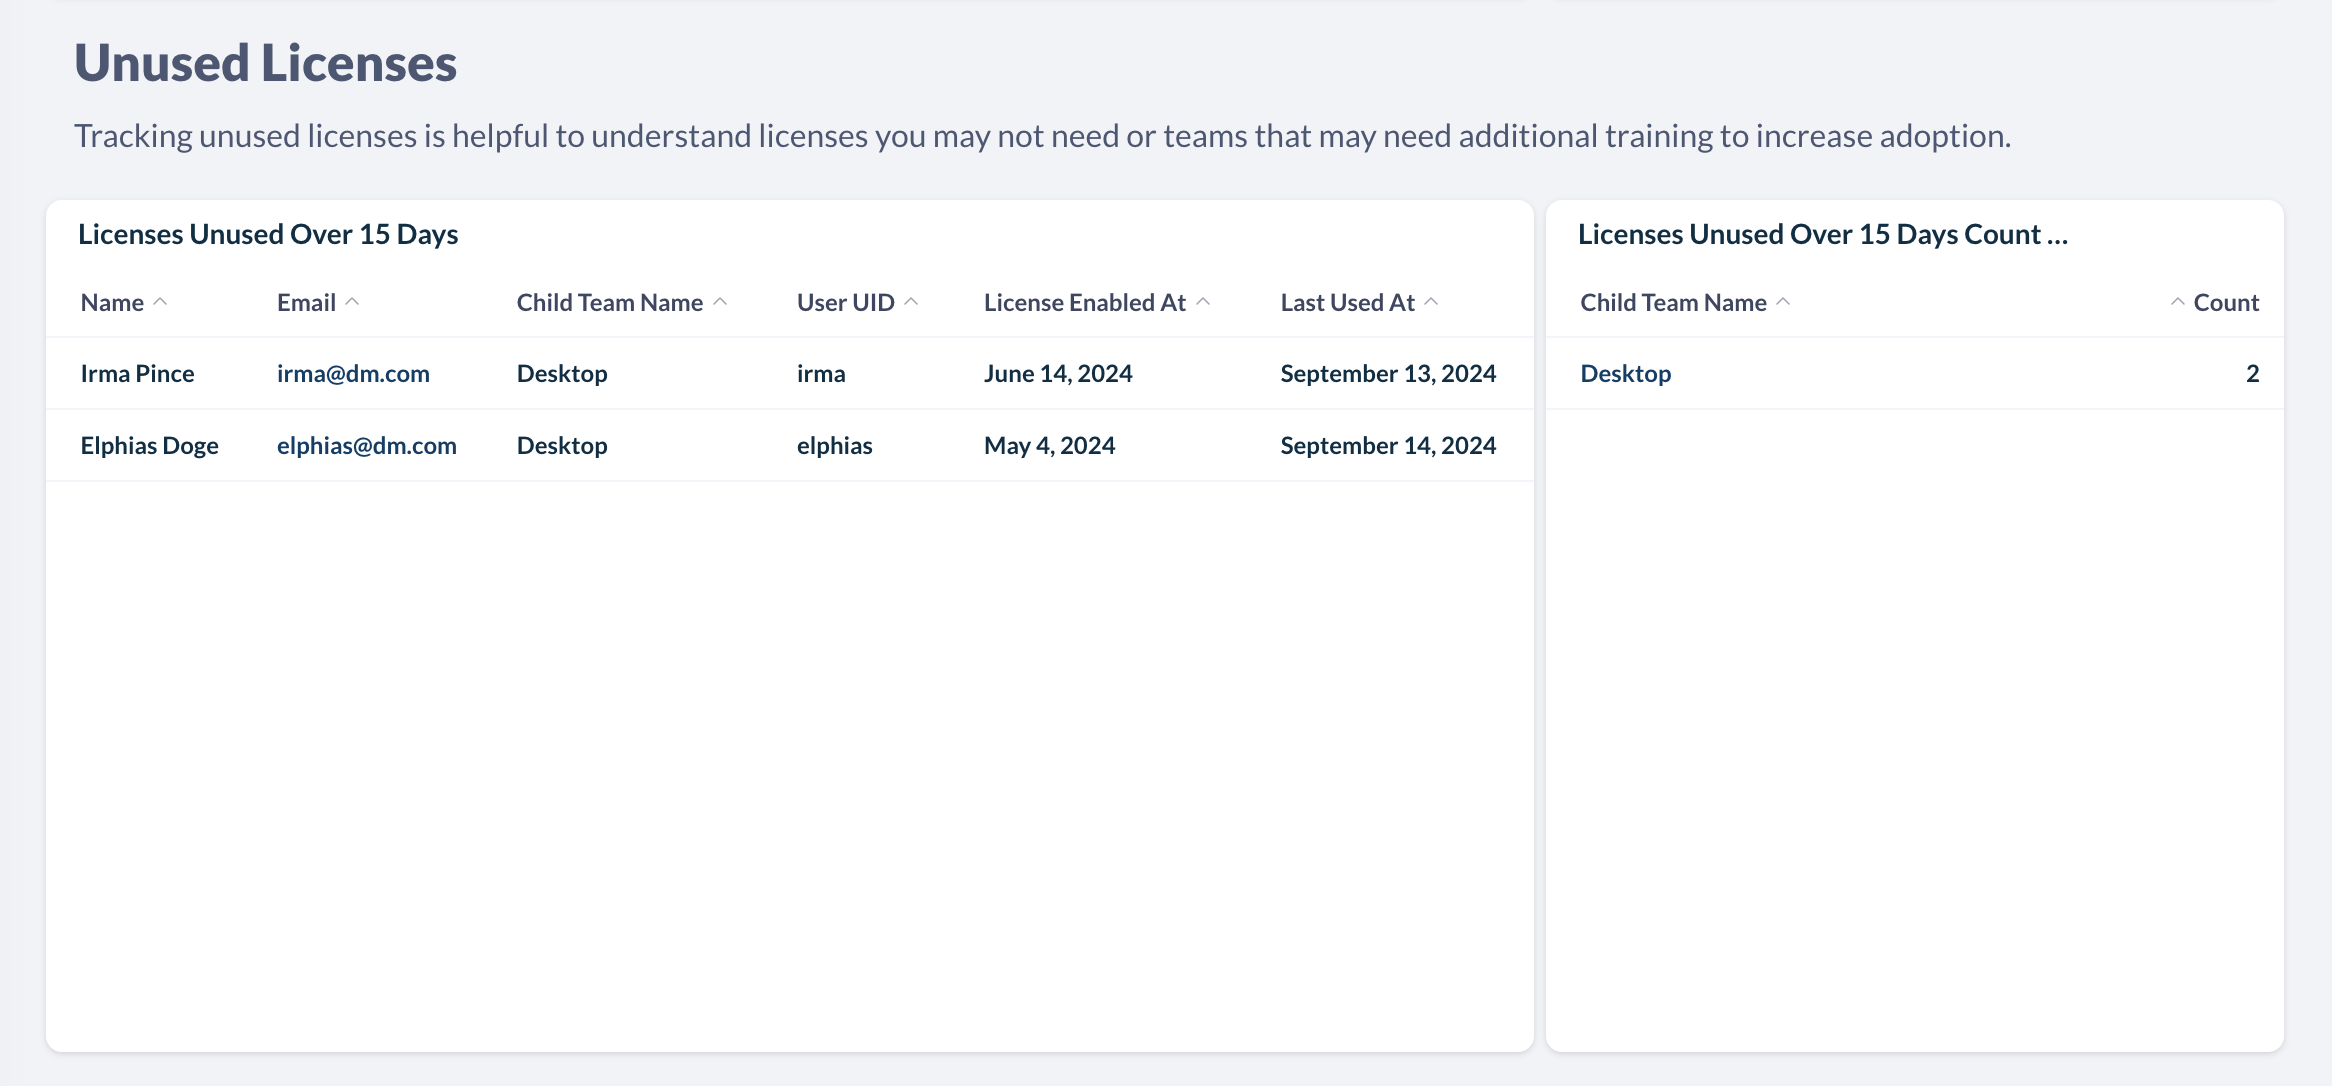
Tracking unused licenses is helpful to understand licenses you may not need or teams that may need additional training to increase adoption.
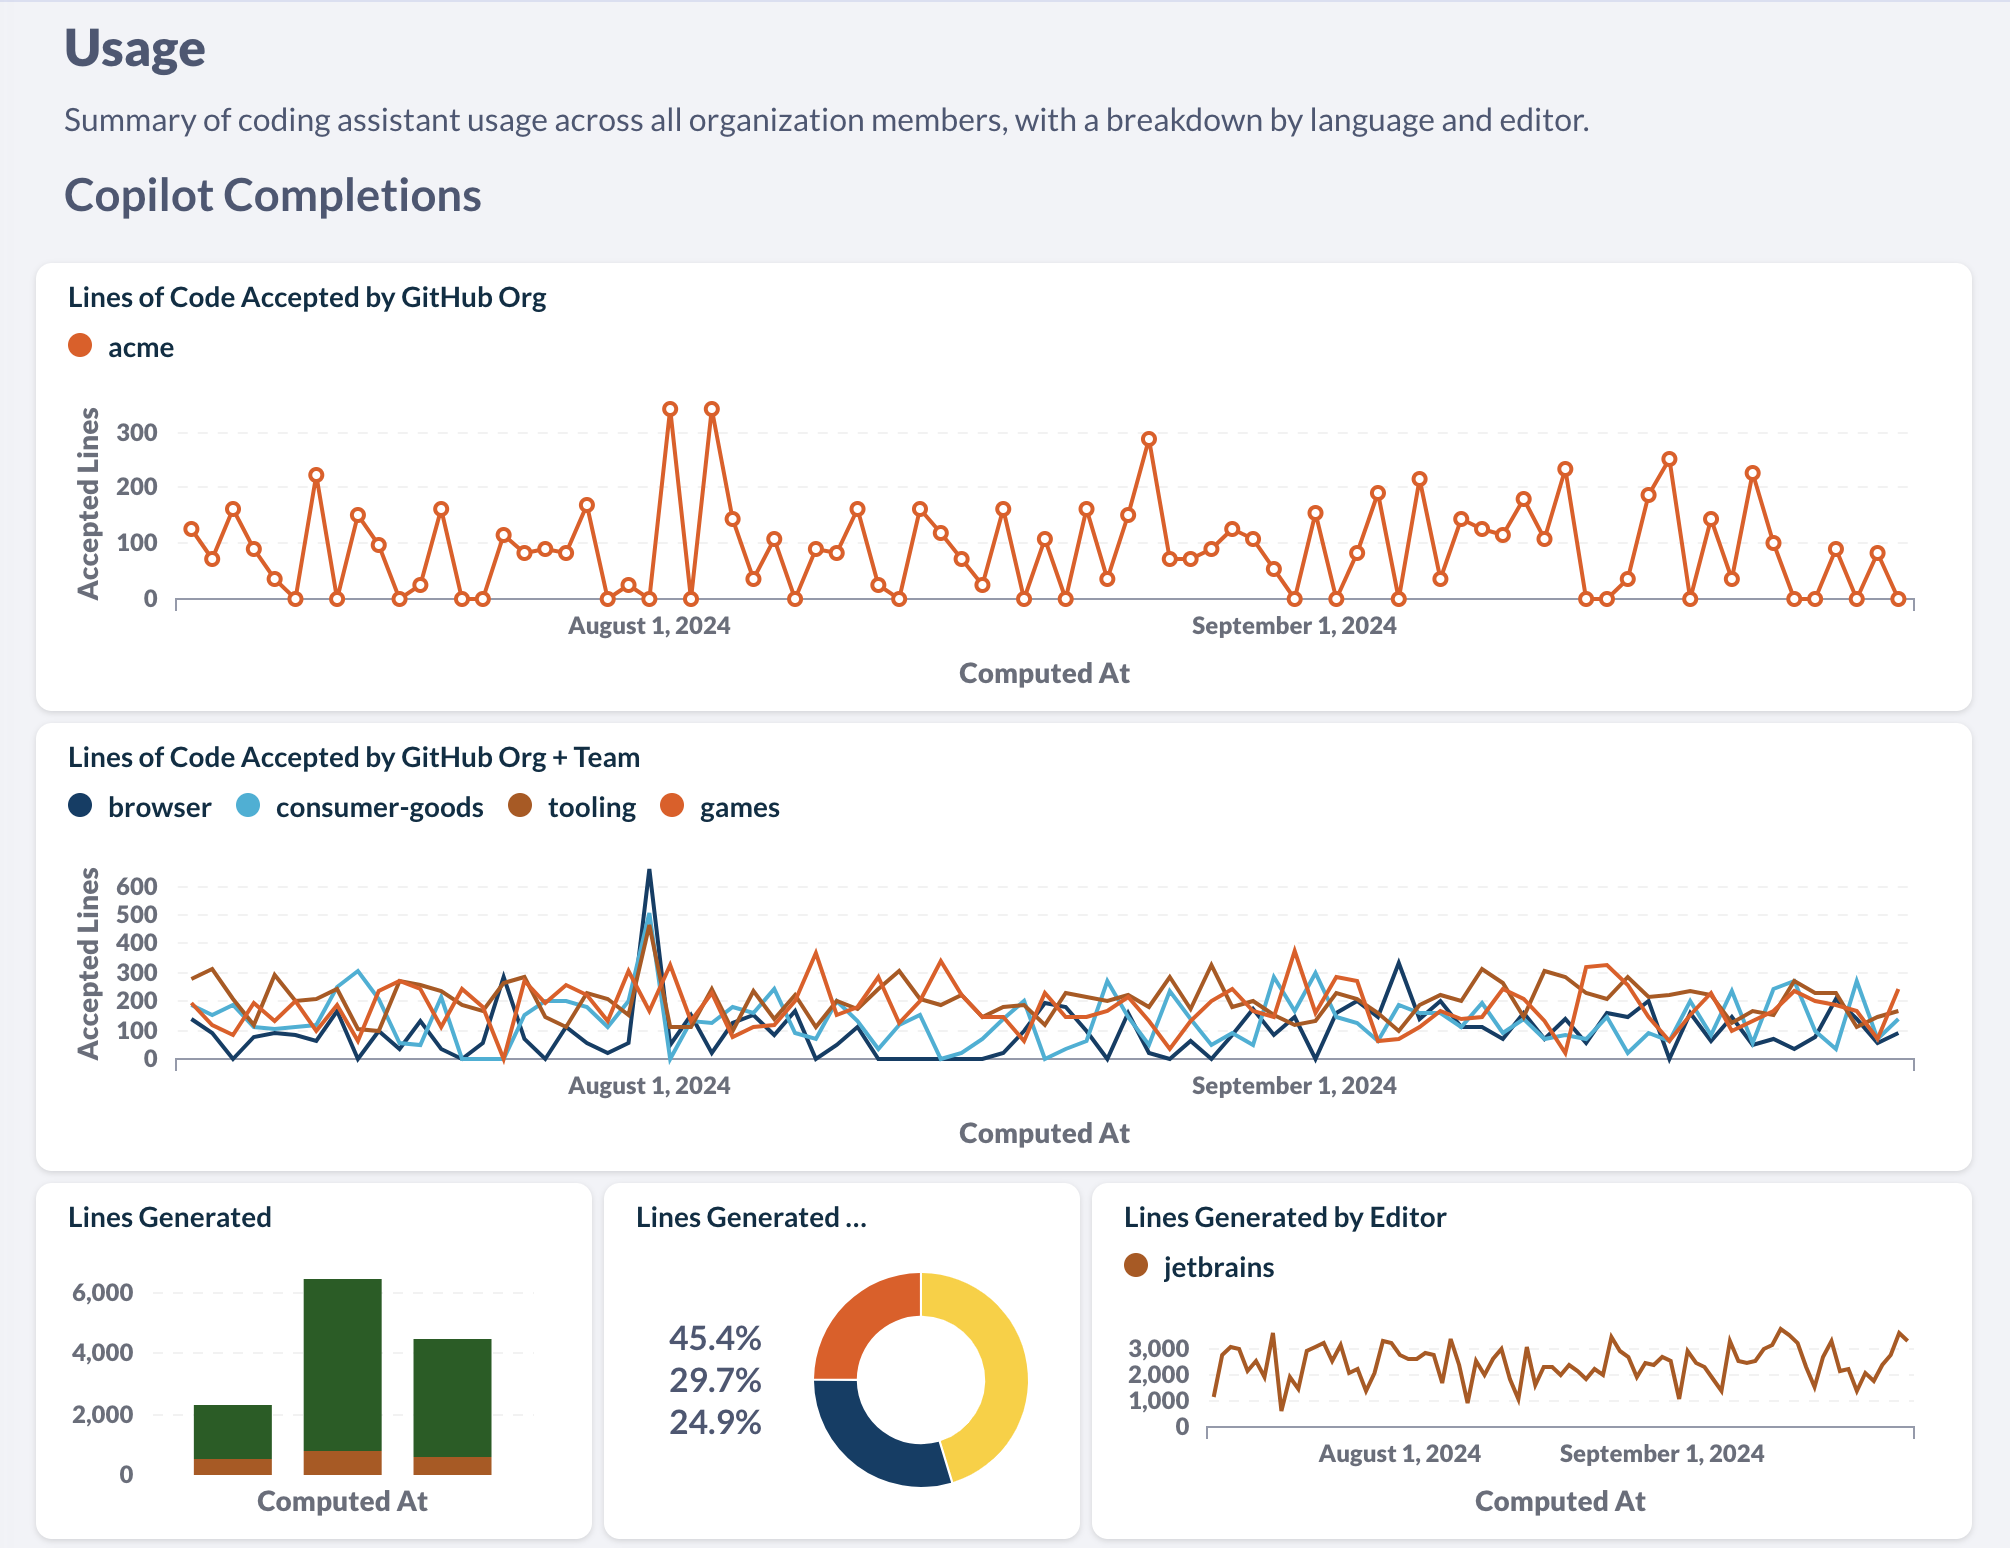
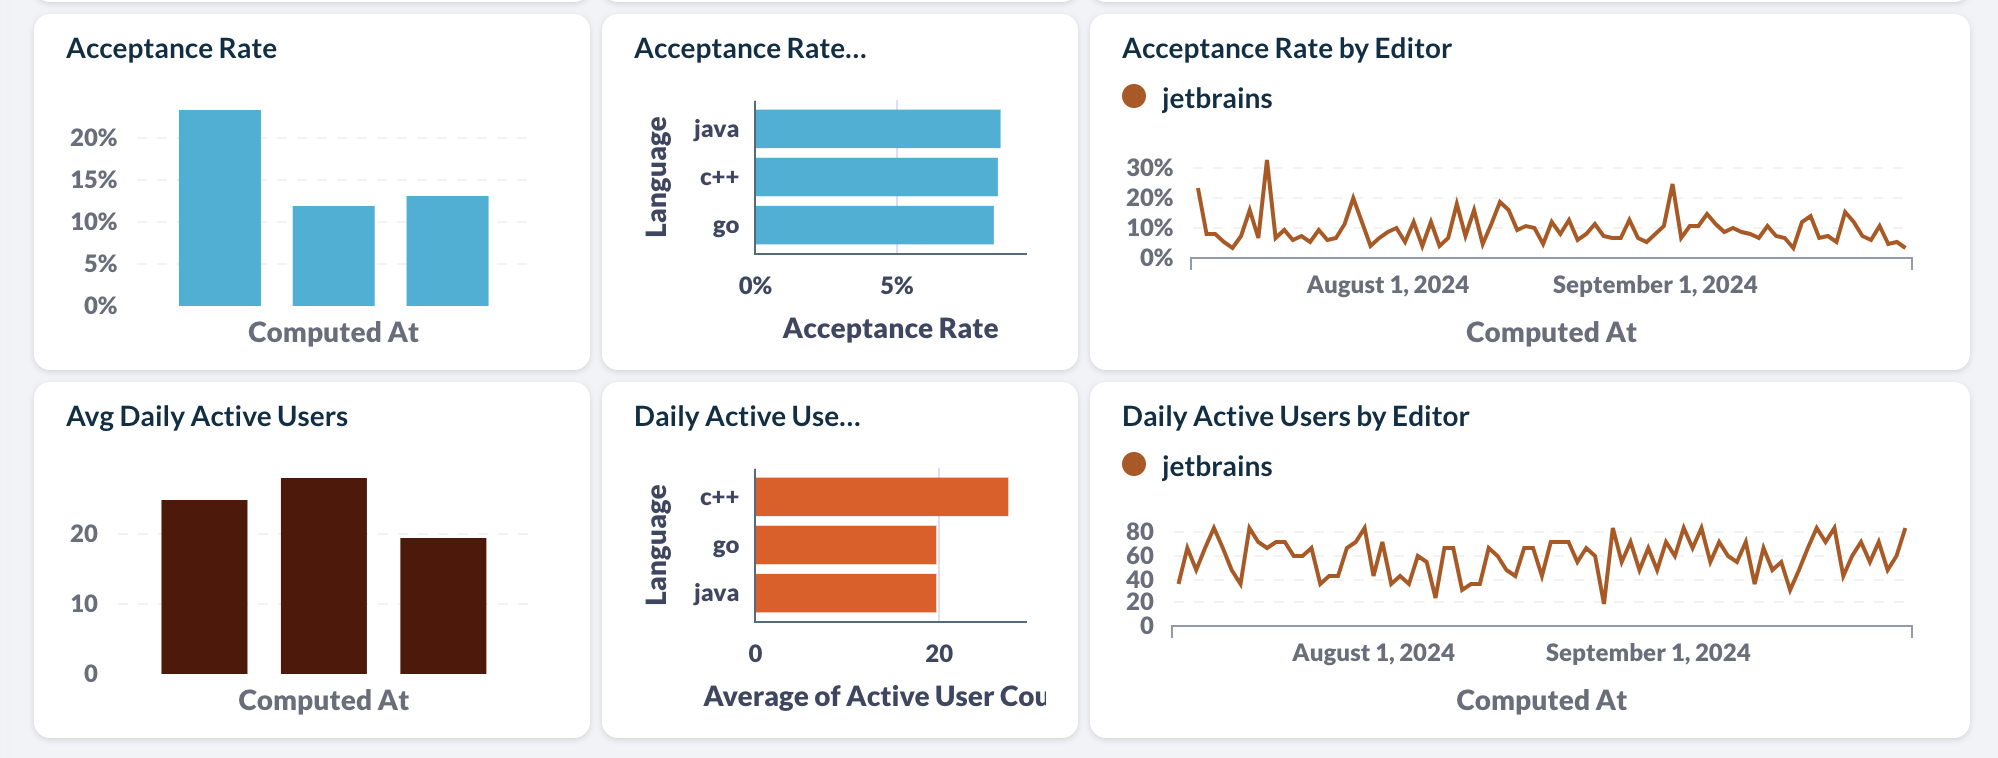
Usage Dashboard
The Usage section provides a summary of coding assistant usage across all organization members, with a breakdown by language and editor.
Note: This data is not available for all coding assistants. It is currently available for GitHub Copilot and Amazon Q Developer.
The dashboard will help you track things like:
- Number of lines of code generated over time
- Broken down by language and editor
- If the acceptance rate of generated code is increasing as your developers become more comfortable with the tool
Note: The initial look-back period will be set based on what is provided by the API of the coding assistant you are evaluating. For example, GitHub Copilot currently provides 28 days of usage history.
Once connected to Faros AI, all historical data will be saved moving forward.
Copilot Completions
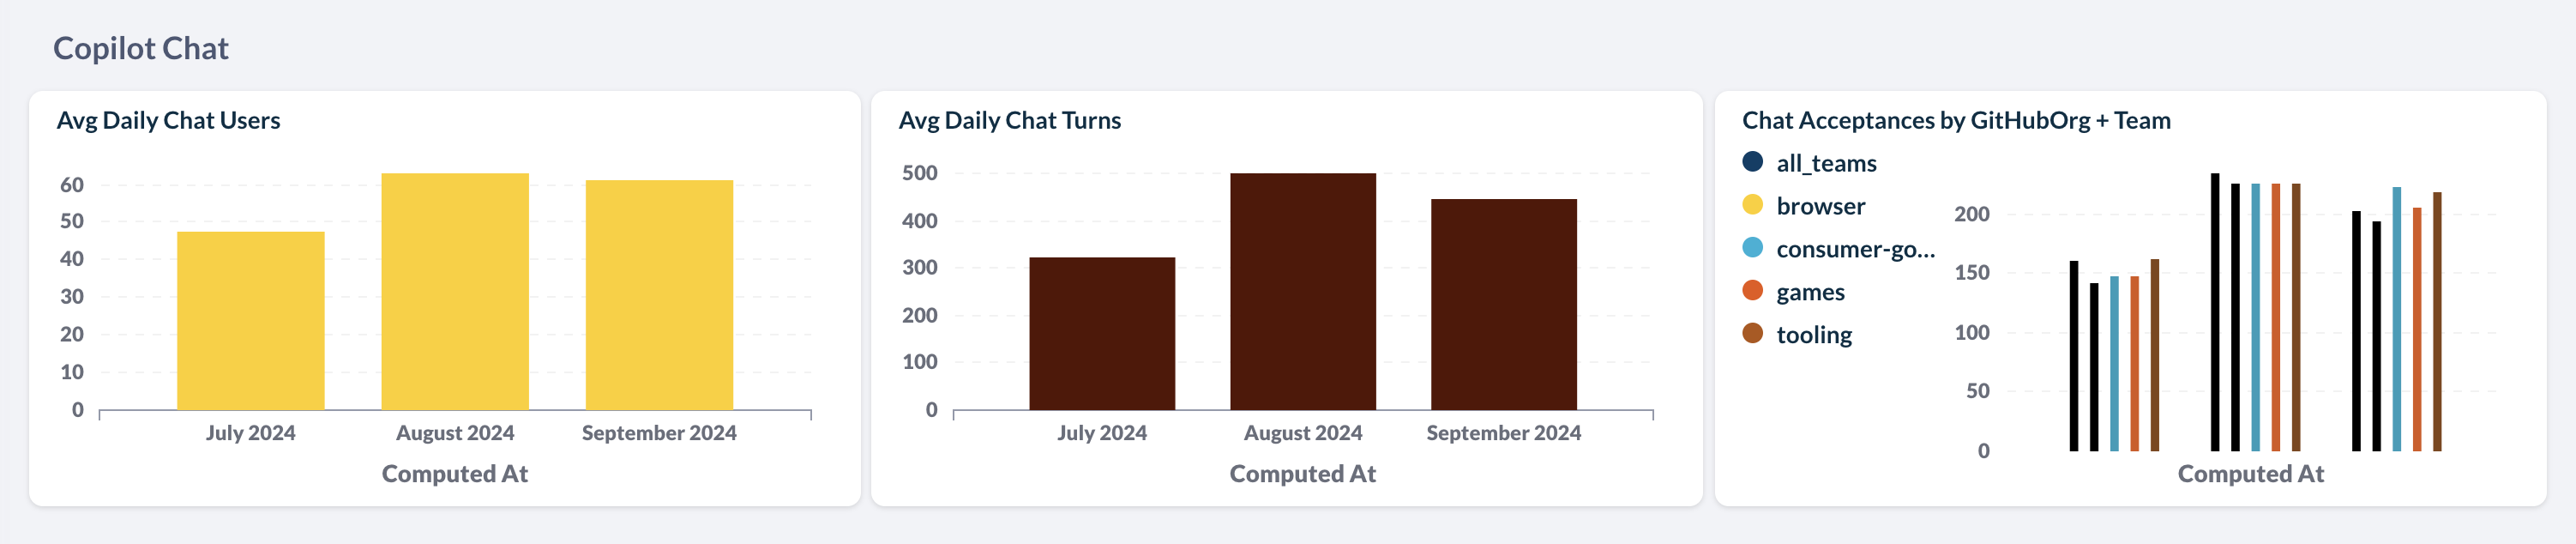
Copilot Chat
The Copilot Chat section provides data on the usage of Copilot Chat, including daily chat turns and acceptances
In order to understand the impact of leveraging a coding assistant, we recommend starting with a small scale pilot where licenses are provided to a selected number of developers or teams.
Ideally your A and B groups (with and without copilot) are similar. For example, use members of the same scrum team or developers working on similar tasks or projects and with comparable seniority.
Doing so, you can perform an A/B test to compare performance and outcomes between developers leveraging a coding assistant and those that are not while controlling for other factors.
The AI Copilot Evaluation A/B Test Dashboard helps you compare different velocity and quality metrics that are likely to be most immediately impacted by using coding assistants tools.
All metrics can be filtered down by team and specific time period.
-
The desired time period defaults to the previous 6 months
-
The desired team(s) defaults to all teams
Velocity

The Velocity section focuses on a key promise of coding assistants: to save developers time while coding. You can assess whether your coding assistant has lead to a notable difference in velocity by using the following metrics:
| Metric | Description | What conclusions will this help me draw? |
|---|---|---|
| PR Merge Rate | Merge Rate of Pull Requests (PRs) over time, for developers using a coding assistant and for those that do not. | Are developers using a coding assistant shipping code faster? Is there a trend over time? |
| PR Review Time | Average review time for pull requests authored by developers over time, for developers using a coding assistant and for those that do not. | Are PRs authored by developers using a coding assistant reviewed faster (potentially because code is cleaner or better documented), or does it take longer (potentially because code is too concise or because the authoring developer has a poorer understanding of the code and therefore takes longer to reply to comments)? |
| Task Throughput | Number of tasks completed per developer over time, for developers using a coding assistant and for those that do not. | Are developers using coding assistants completing tasks faster? |
| PR Merge Rate by Cohort | Merge Rate of Pull Requests in the time frame selected, averaged out by cohort. | Are developers that use a coding assistant shipping code faster on average? |
| PR Review Time by Cohort | Average review time for pull requests authored in the time frame selected, averaged out by cohort. | Are PRs authored by developers using a coding assistant reviewed faster on average? |
| Task Throughput by Cohort | Number of tasks completed per developer in the time frame selected, averaged out by cohort. | Are developers using a coding assistant completing more tasks and potentially improving your release schedule? |
Quality

You may be curious how your coding assistant is impacting quality. Is increased speed negatively impacting quality? Or are coding assistants improving quality by assisting in writing tests and crisper code?
The Quality section helps you see whether there is a notable difference in quality metrics between developers who are using a coding assistant and those who are not.
It is composed of the following metrics:
| Metric | Description | What conclusions will this help me draw? |
|---|---|---|
| PR Size | Size of Pull Requests (PRs) over time, for developers using a coding assistant and for those that do not. | Smaller PRs are typically better. Are coding assistants making PRs larger or smaller over time? |
| PR Test Coverage | Test coverage for pull requests authored by developers using or not using a coding assistant tool, over time. | Coding Assistants are typically helpful to write tests, but moving fast can also impact test coverage. See which way code coverage is going for developers using a coding assistant tool |
| Code Smells | Average number of code smells in pull requests authored by developers using a coding assistant and for those that do not. | Helpful to monitor whether PRs authored by developers using coding assistants are getting more code smells, for example due to duplicate code |
| PR Size by Cohort | Size of Pull Requests in the time frame selected, averaged out by cohort. | Helpful to track whether developers that use a coding assistant are merging smaller PRs on average than those who don’t |
| PR Test Coverage by Cohort | Test coverage for pull requests authored in the time frame selected, averaged out by cohort. | Helpful to track whether PRs authored by developers using a coding assistant have higher or lower test coverage on average than those authored by developers who don’t |
| Code Smells by Cohort | Average number of code smells in pull requests authored in the time frame selected, averaged out by cohort. | Helpful to track whether PRs authored by developers using coding assistants are getting more code smells on average, thus potentially impacting negatively long term code quality |
Note: you may initially see an "Untracked" cohort, in addition to your A and B cohorts. This corresponds to the period between when developers have a license assigned and when we pull our first usage data for them. They might be using it in that period but we don’t know.
As your developers have been using their coding assistant for a longer period of time, you can start comparing before and after metrics for developers actively using the tool.
The AI Copilot Evaluation Rollout Dashboard compares average performance per user from before they were actively using a coding assistant to after, for developers who have started to use a coding assistant in the last 6 months. It works best when usage has increased significantly during that time period.
All metrics can be filtered down by team.
- The desired team(s) can be set using the Teams filter, and defaults to all teams.
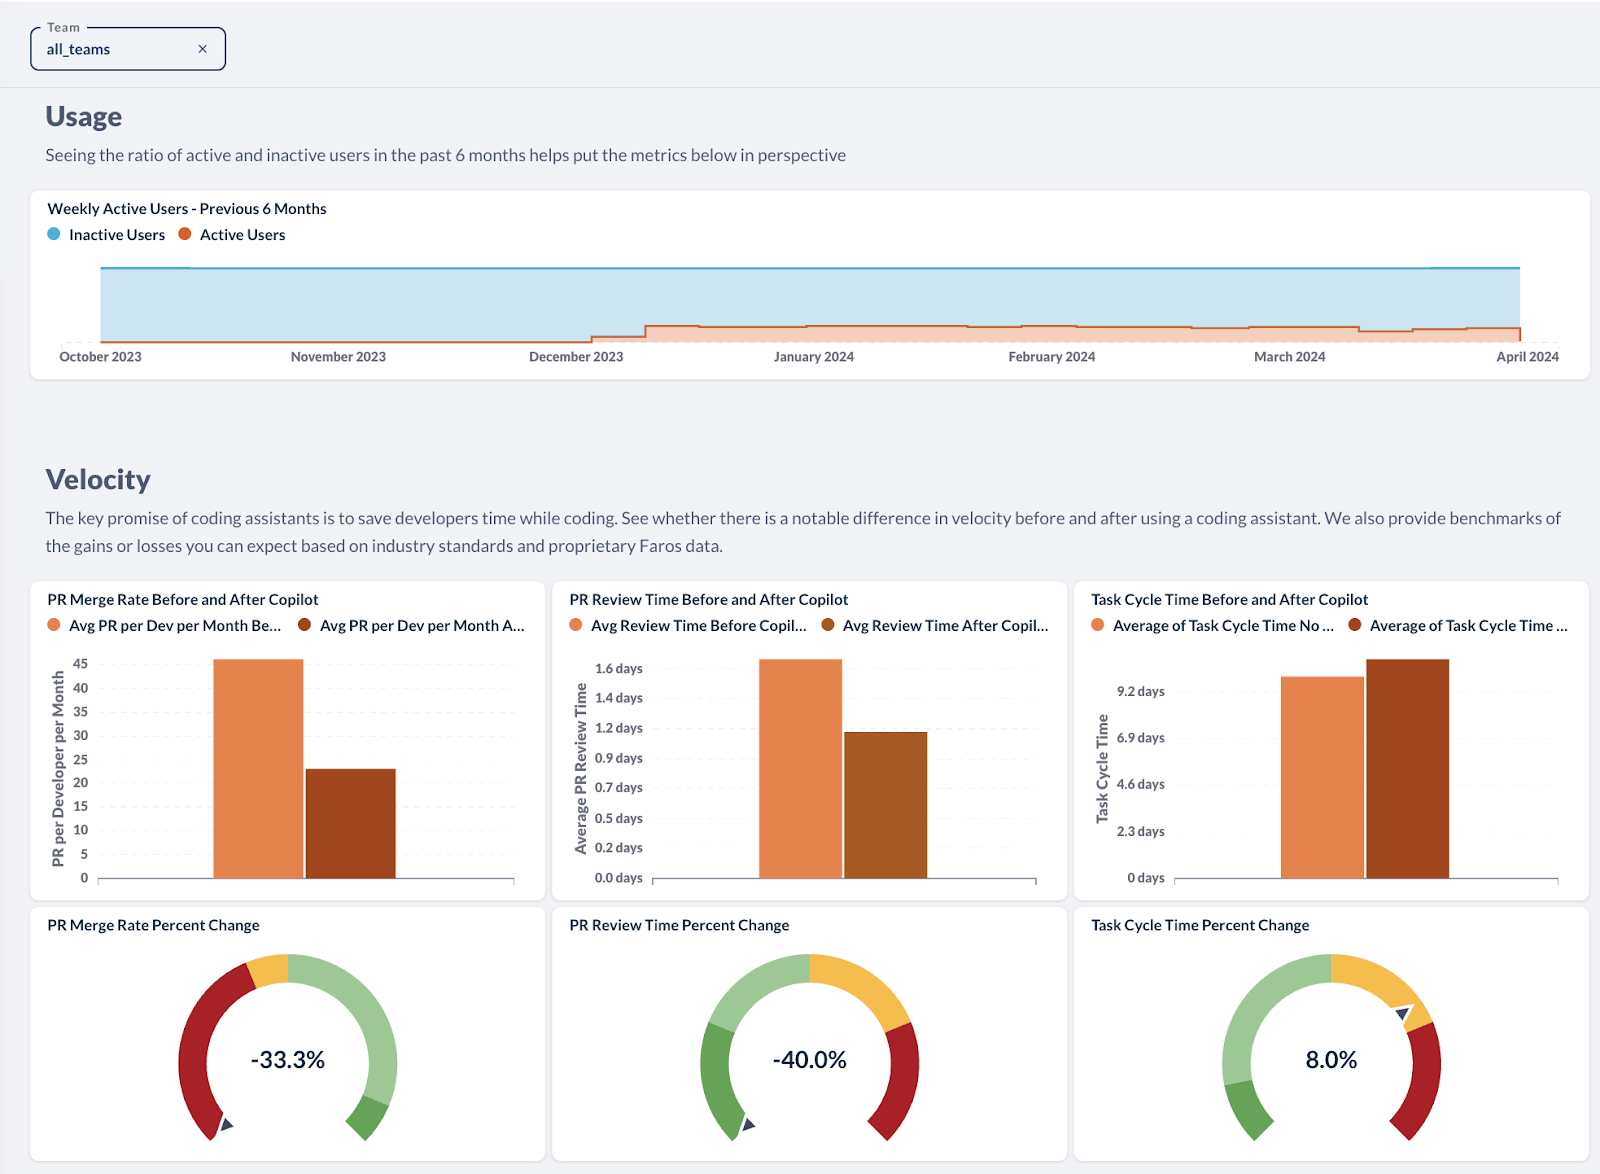
The Usage section at the top shows the ratio of active and inactive users of a coding assistant tool in the last 6 months, which helps put the data below in perspective, as it will be more useful and interesting if usage has increased significantly during that time.
The Velocity section focuses on a key promise of coding assistants: save developers time while coding. See whether there is notable difference in velocity before and after using a coding assistant, and where you stand based on what can be expected based on industry standards and proprietary Faros data.
Metric
| Description |
PR Merge Rate Before and After Copilot | Average Merge Rate of Pull Requests (PRs) for developers now using a coding assistant, compared to before they were using it, for the same set of developers. Helpful to track whether developers who use a coding assistant are shipping code faster than before |
PR Merge Rate Percent Change | Change in Merge Rate of Pull Requests before and after using a coding assistant, for developers now using a coding assistant. Is it going up for your organization? |
PR Review Time Before and After Copilot | Average review time for pull requests authored by developers now using a coding assistant tool compared to before they were using it, for the same set of developers. Are PRs authored by developers now using a coding assistant reviewed faster because code is cleaner or more documented for example, or does it take longer because code is too concise or the authoring developer has less of an understanding of the code and takes longer to reply to comments. |
PR Review Time Percent Change | Change in review time for pull requests authored by developers now using a coding assistant, compared to before. Helpful to track whether PRs authored by developers now using a coding assistant are reviewed faster on average than before. Is it going down for your organization? |
Task Cycle Time Before and After Copilot | Average time for a task to be completed by developers before and after using a coding assistant. Helpful to monitor whether developers now using coding assistants go through tasks faster than before |
Task Cycle Time Percent Change | Change in task cycle time, before and after using a coding assistant. Is it going down for your organization? |
Once your organization has deployed coding assistants more broadly and for a longer period of time, you can start evaluating impact on more downstream velocity and quality metrics.
The AI Copilot Evaluation Impact Dashboard helps you analyze this impact over time, for teams reaching a threshold of 50% of team members with active coding assistant use in a month.
All metrics can be filtered down by team and specific time period.
-
The desired time period is set by the Date filter at the top of the page, and defaults to the previous 6 months.
-
The desired team(s) can be set using the Teams filter, and defaults to all teams.
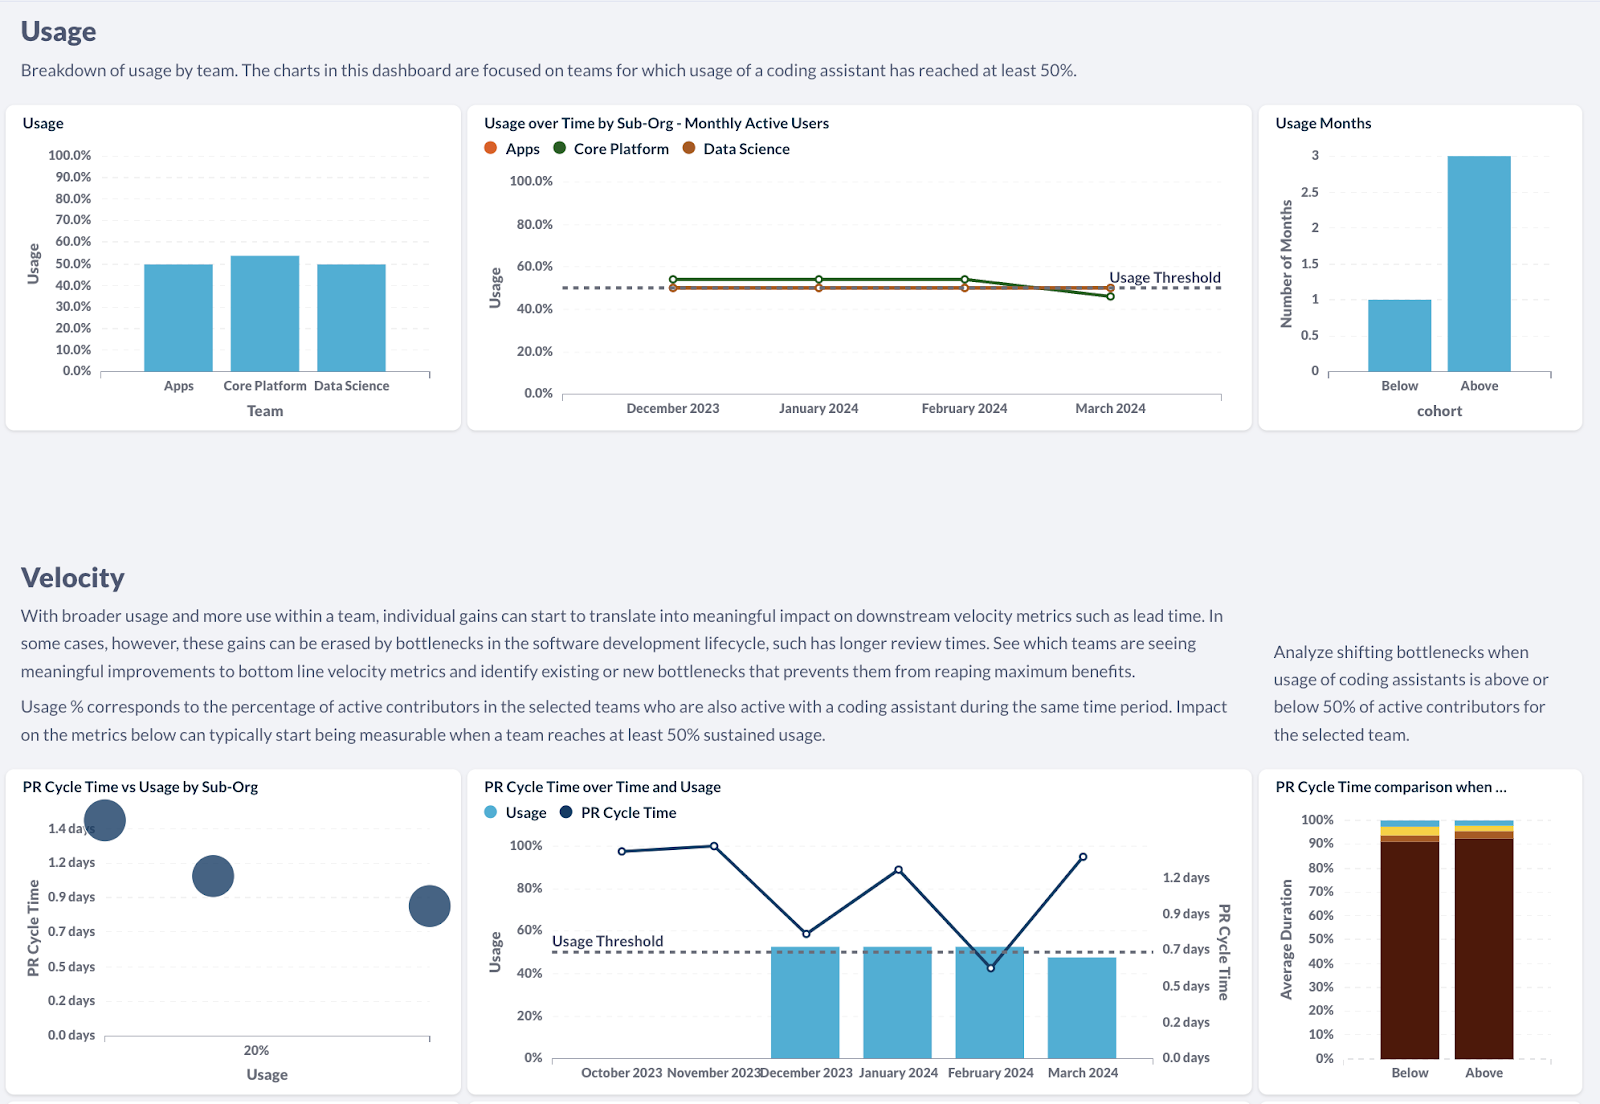
The Usage section provides a breakdown of usage by team. It is helpful to identify areas of strong adoption within your organization, and areas lagging behind or not benefiting as much.
The charts below are focused on teams for which usage of a coding assistant has reached at least 50%.
With broader usage and more use within a team, individual gains can start to translate into meaningful impact on downstream velocity metrics such as lead time. In some cases, however, these gains can be erased by bottlenecks in the software development lifecycle, such as longer review times.
The Velocity section helps you see which teams are seeing meaningful improvements to bottom line velocity metrics and identify existing or new bottlenecks that prevent them from reaping maximum benefits.
Usage % corresponds to the percentage of active contributors in the selected teams who are also active with a coding assistant during the same time period. Impact on the metrics below can typically start being measurable when a team reaches at least 50% sustained usage.
It is composed of the following metrics:
Metric
| Description |
PR Cycle Time vs Usage by Sub-Org | Average Cycle Time of Pull Requests (PRs) and Usage of a coding assistant, for each team in the selected org. See if there is a relationship between the two, by seeing where teams fall in this scatter plot. Each bubble is a team and its size represents the size of the team. |
PR Cycle Time over Time and Usage | Average Cycle Time of Pull Requests and usage of a coding assistant tool, over time. As coding assistant usage is ramping up, is there an impact on cycle time? |
PR Cycle Time comparison when usage above 50% | PR Cycle Time breakdown for months where usage of a coding assistant tool is above or below 50%. Helpful to understand shifting bottlenecks when using coding assistants, which could erase potential gains upstream |
Lead Time vs Usage by Sub-Org | Lead Time and Usage of a coding assistant, for each team in the selected org. See if there is a relationship between the two, by seeing where teams fall in this scatter plot. Each bubble is a team and its size represents the size of the team. |
Lead Time over Time and Usage | Lead time and usage of a coding assistant tool, over time. As coding assistant usage is ramping up, is there an impact on lead time? |
Lead Time comparison when usage above 50% | Lead time breakdown for months where usage of a coding assistant tool is above or below 50%. Helpful to understand shifting bottlenecks when using coding assistants, which could erase potential gains upstream |
Task Cycle Time vs Usage by Sub-Org | Task Cycle Time and Usage of a coding assistant, for each team in the selected org. See if there is a relationship between the two, by seeing where teams fall in this scatter plot. Each bubble is a team and its size represents the size of the team. |
Task Cycle Time over Time and Usage | Task Cycle Time and usage of a coding assistant tool, over time. As coding assistant usage is ramping up, is there an impact on cycle time? |
Task Cycle Time comparison when usage above 50% | Task Cycle Time breakdown for months where usage of a coding assistant tool is above or below 50%. Helpful to understand shifting bottlenecks when using coding assistants, which could erase potential gains upstream |
With broader usage and more use within a team, downstream impact on quality can start to be felt more acutely, either in a positive or in a negative way.
The Quality section helps you monitor whether coding assistants have an impact on incidents and other quality metrics. It is composed of the following metrics:
Metric
| Description |
Bugs per Developer vs Usage by Sub-Org | Bugs per Developer and Usage of a coding assistant, for each team in the selected org. See if there is a relationship between the two, by seeing where teams fall in this scatter plot. Each bubble is a team and its size represents the size of the team. |
Bugs per Developer over Time and Usage | Bugs per Developer and usage of a coding assistant tool, over time. As coding assistant usage is ramping up, is there an impact on code quality? |
Bugs per Developer comparison when usage above 50% | Bugs per Developer for months where usage of a coding assistant tool is above or below 50%. |
Incidents per Developer over time vs Usage by Sub-Org | Incidents per Developer and Usage of a coding assistant, for each team in the selected org. See if there is a relationship between the two, by seeing where teams fall in this scatter plot. Each bubble is a team and its size represents the size of the team. |
Incidents per Developer over time and Usage | Incidents per Developer and usage of a coding assistant tool, over time. As coding assistant usage is ramping up, is there an impact on quality? |
Incidents per Developer comparison when usage above 50% | Incidents per Developer for months where usage of a coding assistant tool is above or below 50%. |
Change Failure Rate vs Usage by Sub-Org | Change Failure Rate and Usage of a coding assistant, for each team in the selected org. See if there is a relationship between the two, by seeing where teams fall in this scatter plot. Each bubble is a team and its size represents the size of the team. |
Change Failure Rate over Time and Usage | Change Failure Rate and usage of a coding assistant tool, over time. As coding assistant usage is ramping up, is there an impact on quality? |
Change Failure Rate comparison when usage above 50% | Change Failure Rate for months where usage of a coding assistant tool is above or below 50%. |
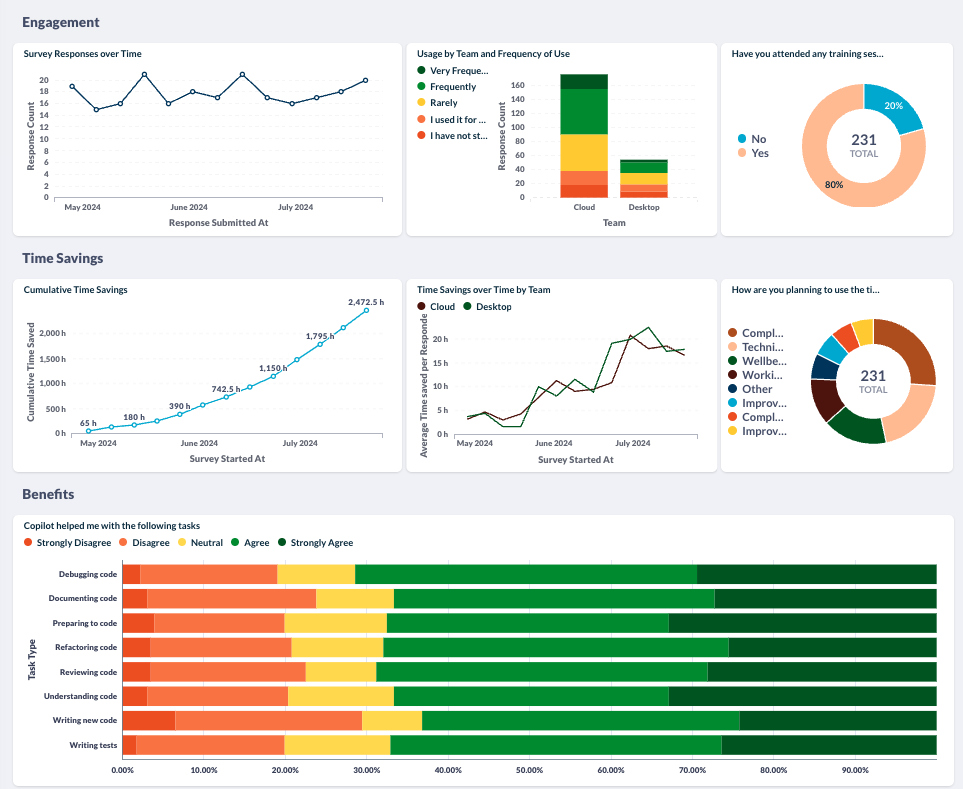
We recommend augmenting this telemetry data with qualitative and satisfaction data from developer surveys that can be run every few weeks or months.
Out of the box surveys are provided with questions related to frequency of use, time savings and developer satisfaction. More information and links to survey templates can be found below.
Custom surveys can also be ingested.
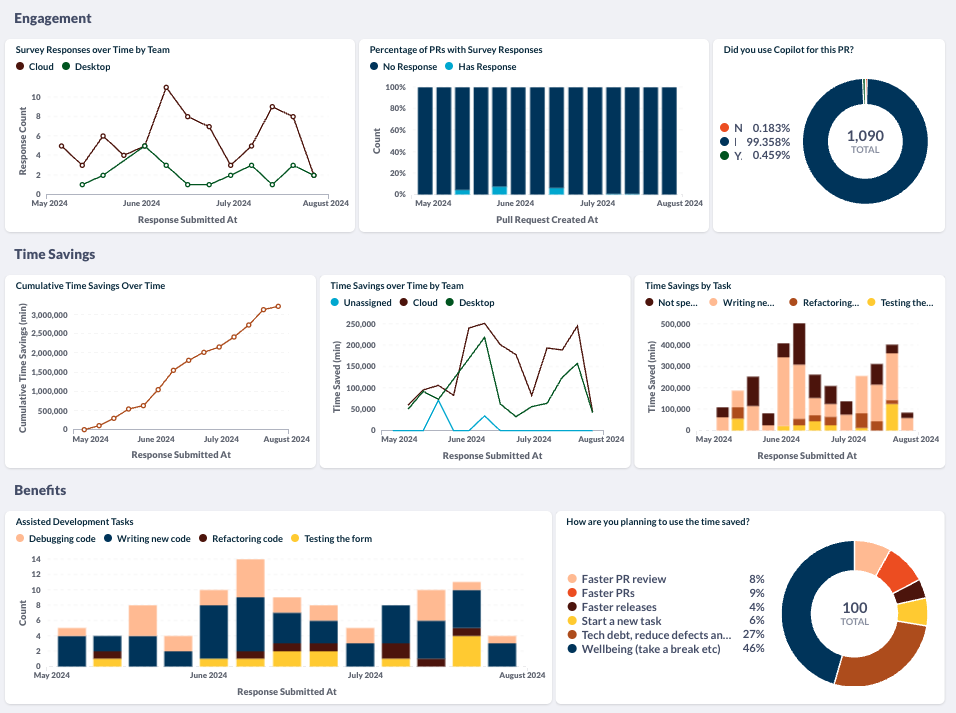
Another option is to run surveys in the flow of work, for example when a PR is submitted.
This can provide more accurate data on time savings as well as contextual information on which development tasks benefit the most from using a coding assistant and where time is being reinvested.
Out of the box surveys and detailed documentation on how to set them up is also provided below.
Custom surveys can also be ingested.
The AI Copilot Evaluation Module is focused on providing a holistic view into the adoption, developer sentiment, and downstream impact of rolling-out a Coding Assistant in your organization.
You can get sarted by simply providing access to usage data from your coding assistant. To get additional insights into time savings, developer sentiment and benefits, you can optionally run developer surveys which can be ingested into Faros (templates are provided). To measure downstream impact on velocity, quality or security, additional data sources can be connected as described below.
💡These instructions are specific to GitHub Copilot. If you use a different coding assistant, such as Amazon Q Developer, please contact the Faros team at [email protected] and we will help you set it up.
Please follow the instructions here to connect to GitHub. This is required to get PR data from GitHub as well as Copilot usage data.
⚠️ Note: Make sure to add the following scope when generating the GitHub token: “manage_billing:copilot”. This is needed to get Copilot usage data from GitHub. The token must also belong to an organization owner. You can test your token the following way:
curl -L
  -H "Accept: application/vnd.github+json"
  -H "Authorization: Bearer <YOUR-TOKEN>"
  -H "X-GitHub-Api-Version: 2022-11-28"
  <https://api.github.com/orgs/ORGANIZATION/copilot/usage>
To be able to analyze the data by team, Faros also needs to capture your organizational structure. The easiest way to do that is to select the “Bootstrap Organization” option when setting up the GitHub Source. This will use the GitHub Orgs and Users to create your Teams in Faros. Alternatively, you can supply a list of Teams and Employees (see next step).

As an alternative to using the GitHub Source to create your organization and employees via the “Bootstrap Organization” option described above, you can instead supply a list of team members and the teams they belong to in your organization. You may want to use this approach when your functional teams differ from the way things are organized within GitHub. There are two main steps to this process.
-
Create Teams and Employees using the instructions for Importing Org Data.
-
Associate team members with their GitHub accounts. This can be done as part of step 1 if you have each team member’s GitHub user ID. Otherwise, you can use the Employee Bootstrap source to attempt to associate them automatically based on similarities.
Setting up a survey enables you to quantify time savings and collect qualitative data from your developers on their experience with their coding assistants, such as which tasks they are most helpful for, how they are planning to leverage the time they saved and satisfaction with the tool. You can leverage one of our templates, modify them to your needs, or use your own.
There are two main ways to trigger these surveys:
Pros: Surveys the developers while they are in their flow, and the experience with the coding assistant is fresh in their minds.
Cons: Potential survey fatigue, which can be mitigated by adjusting the logic for when the survey is triggered, e.g. triggered only on large PRs or at most twice a week for each developer.
- Create your survey. You can clone this Copilot Survey as a starting point and adjust it to your needs.
- Create the trigger mechanism. We recommend setting up a GitHub Action on the desired repositories with a link to the survey, as explained here. Fine-tune the triggering logic to suit your organization.
- Ingest the survey results into Faros by following these instructions.
Note: If you significantly modify the survey template, some of the charts in the dashboards are likely to break. Please contact [email protected] if you need help.
Pros: Limits survey fatigue. Since developers will be prompted less frequently, you can also afford to ask a few more questions.
Cons: Answers to quantitative questions like ‘how much time was saved’ will likely be less accurate. The out-of-the-box dashboards do not currently support this option and will need to be modified to ingest the survey data. Please contact [email protected] if you need help.
- Create your survey. You can clone this Coding Assistant Weekly Survey Template as a starting point and adjust it to your needs.
- Ingest the survey results following these instructions.
You can optionally connect additional data sources to Faros to provide more holistic insights into the downstream impacts of GenAI tools on velocity and quality, including:
- CI/CD pipelines: To get insights into the impact of your Coding Assistant on lead time, you can integrate Faros with your CI/CD systems following instructions here.
- Static Code Analysis tools: To monitor quality data such as code coverage and code smells following the introduction of coding assistants, you can connect static code analysis tools such as SonarQube following instructions here.
- Task Management Systems: To assess the impact of coding assistants on task throughput or number of bugs created for example, you can connect task management systems such as Jira following instructions here.
Updated about 2 months ago