
Quickstart for administrators
This section will walk you through a simple example using GitHub and/or Jira, to quickly give you insights about some of the most important data sources in your organization: your version control (e.g. Github) and task management (e.g. Jira) systems. You’ll be up and running with these 3 simple steps:
- Connect your version control and/or task management systems to Faros
- Organize your data by selecting which repositories and/or boards to include
- Visualize your data using Faros' powerful business intelligence tool
Start Importing Data
- Navigate to Admin Settings > Data Control > Sources
- Click ➕ New
- Select the source you want to connect (in our example, GitHub and/or Jira), narrowing down the choices by selecting a category on the left or using the search box
- Give your source a name and choose how you'll authenticate
- You can learn more about token requirements on the Credentials page
- Make any changes to the source's settings (if you'd like) then press Connect
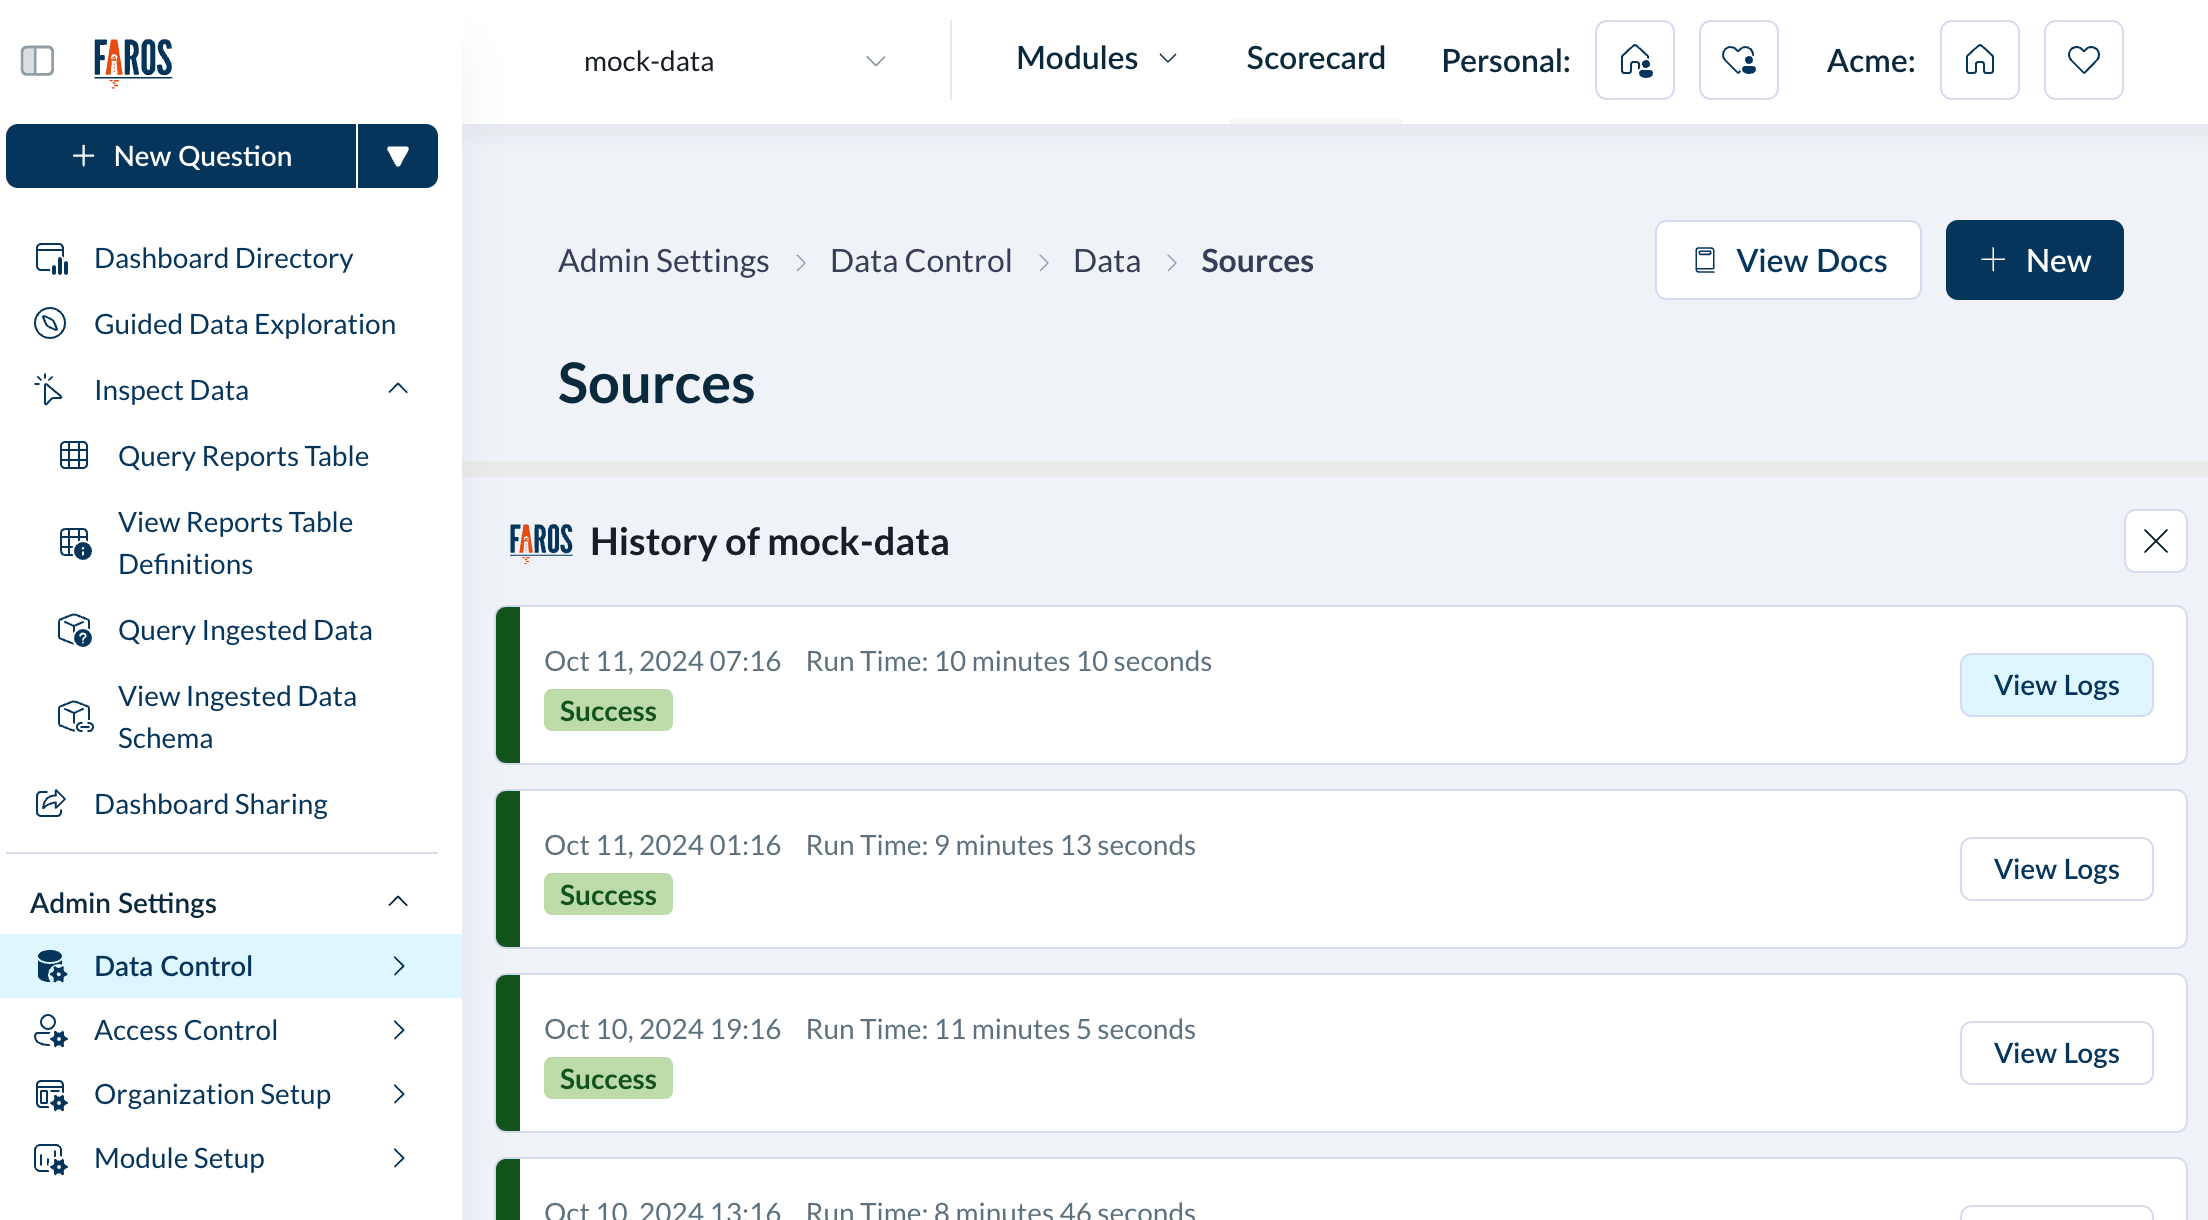
You can examine logs from the latest sync by navigating to Admin Settings > Data Control > Sources in the navigation panel on the left, and selecting View history for your newly created source.
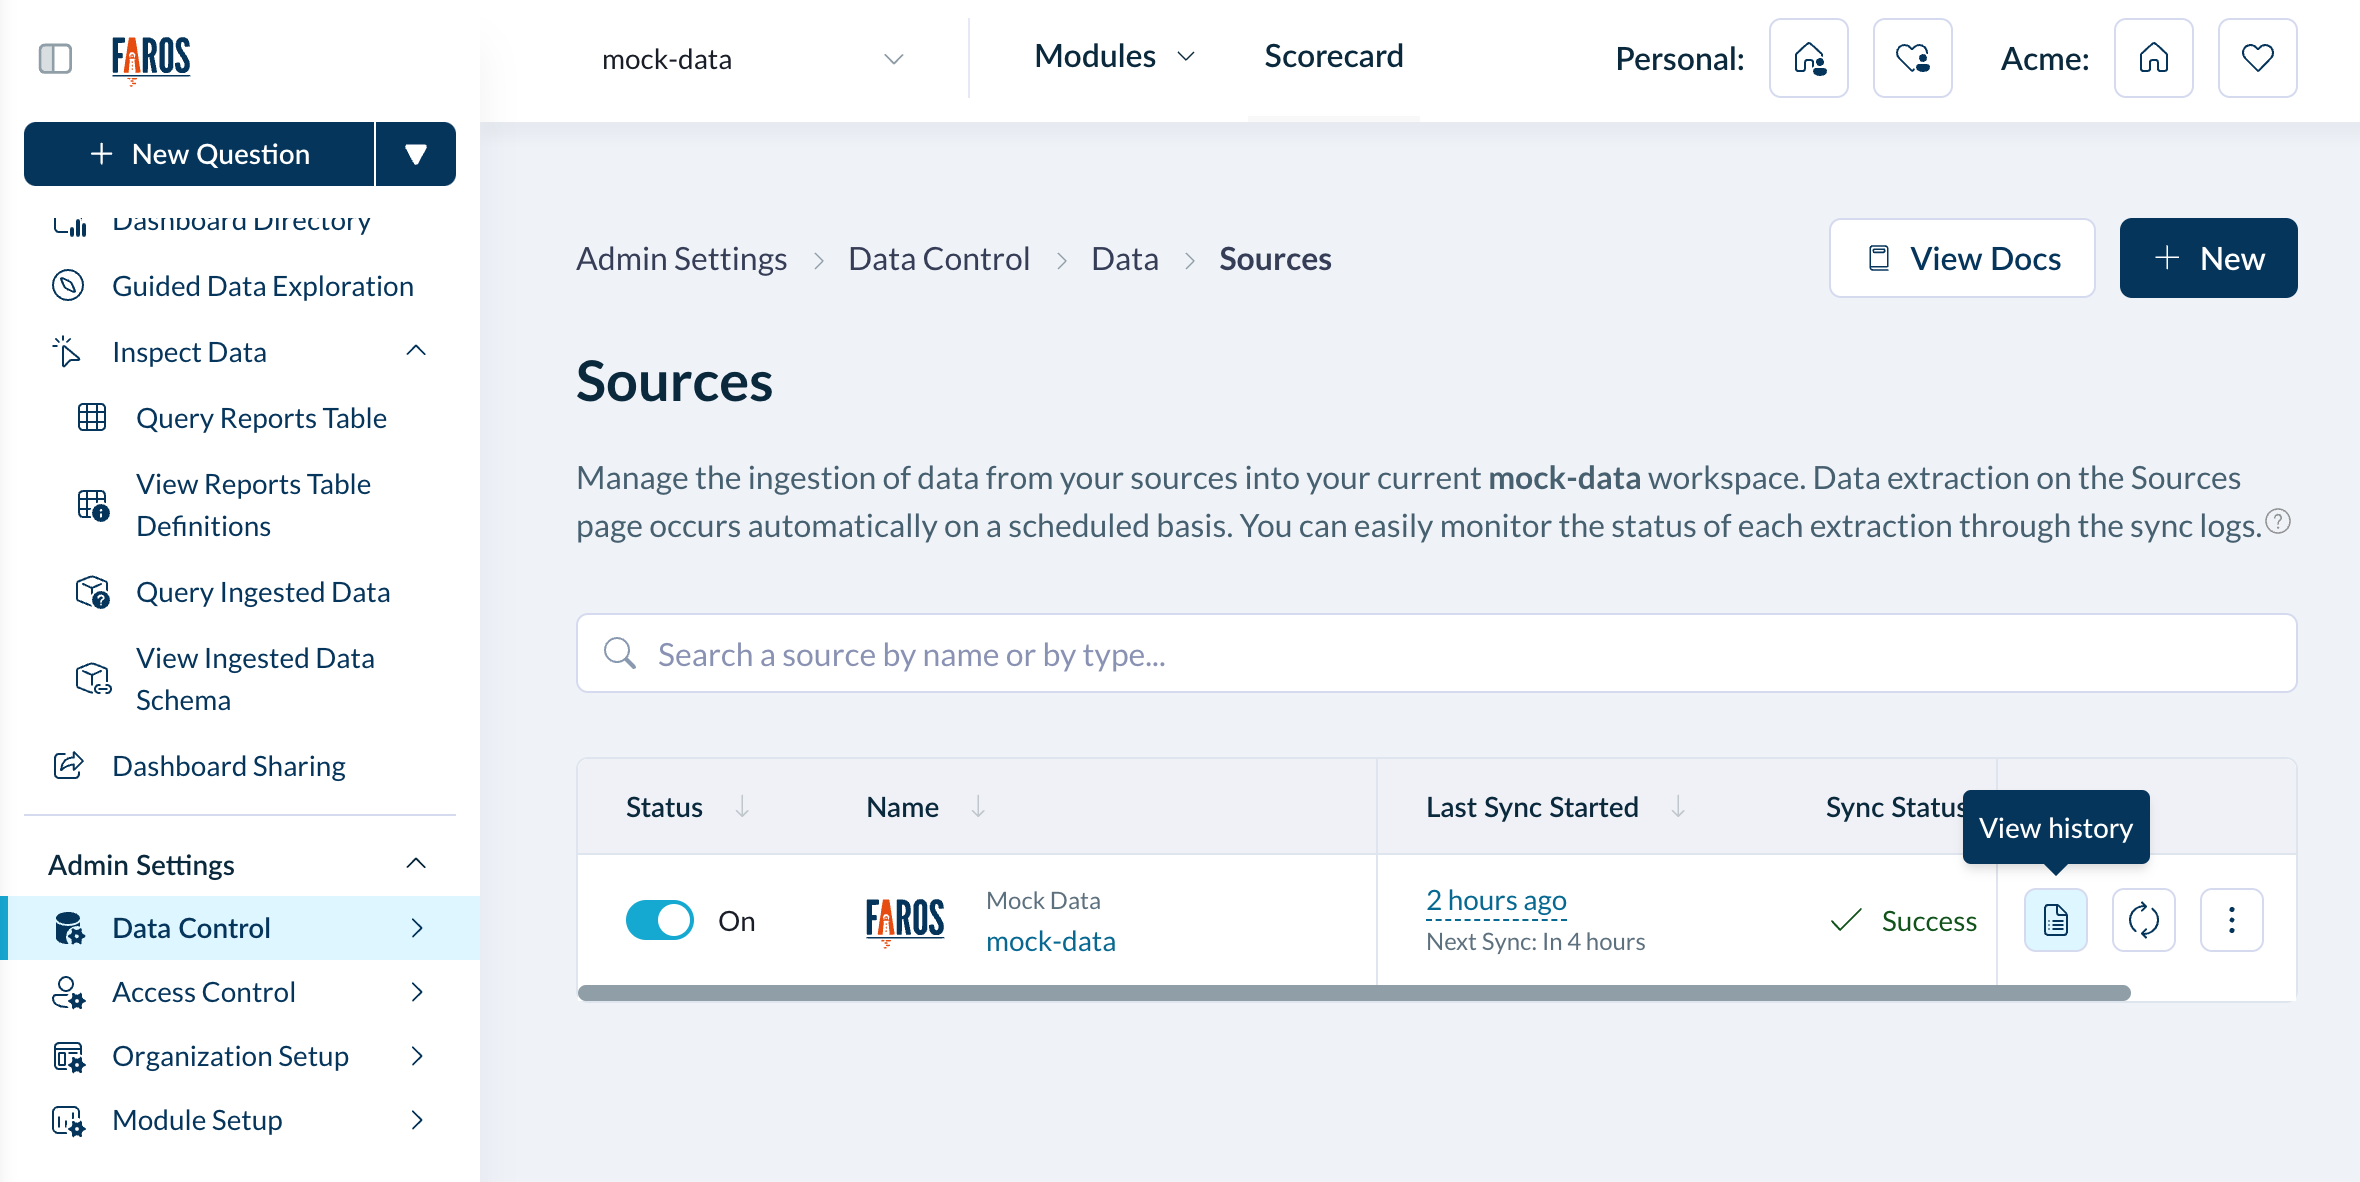
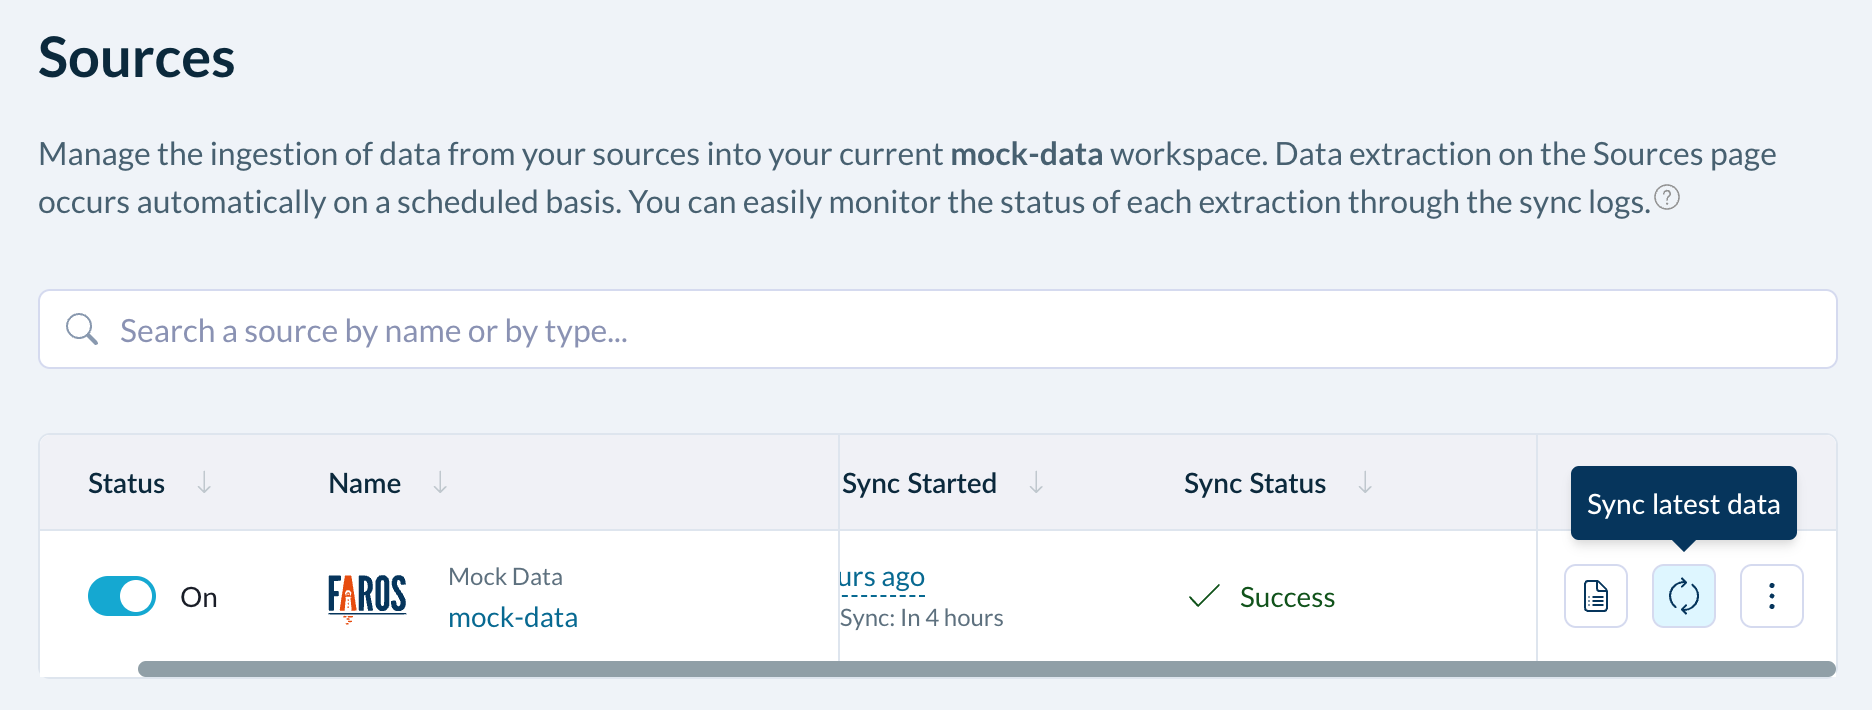
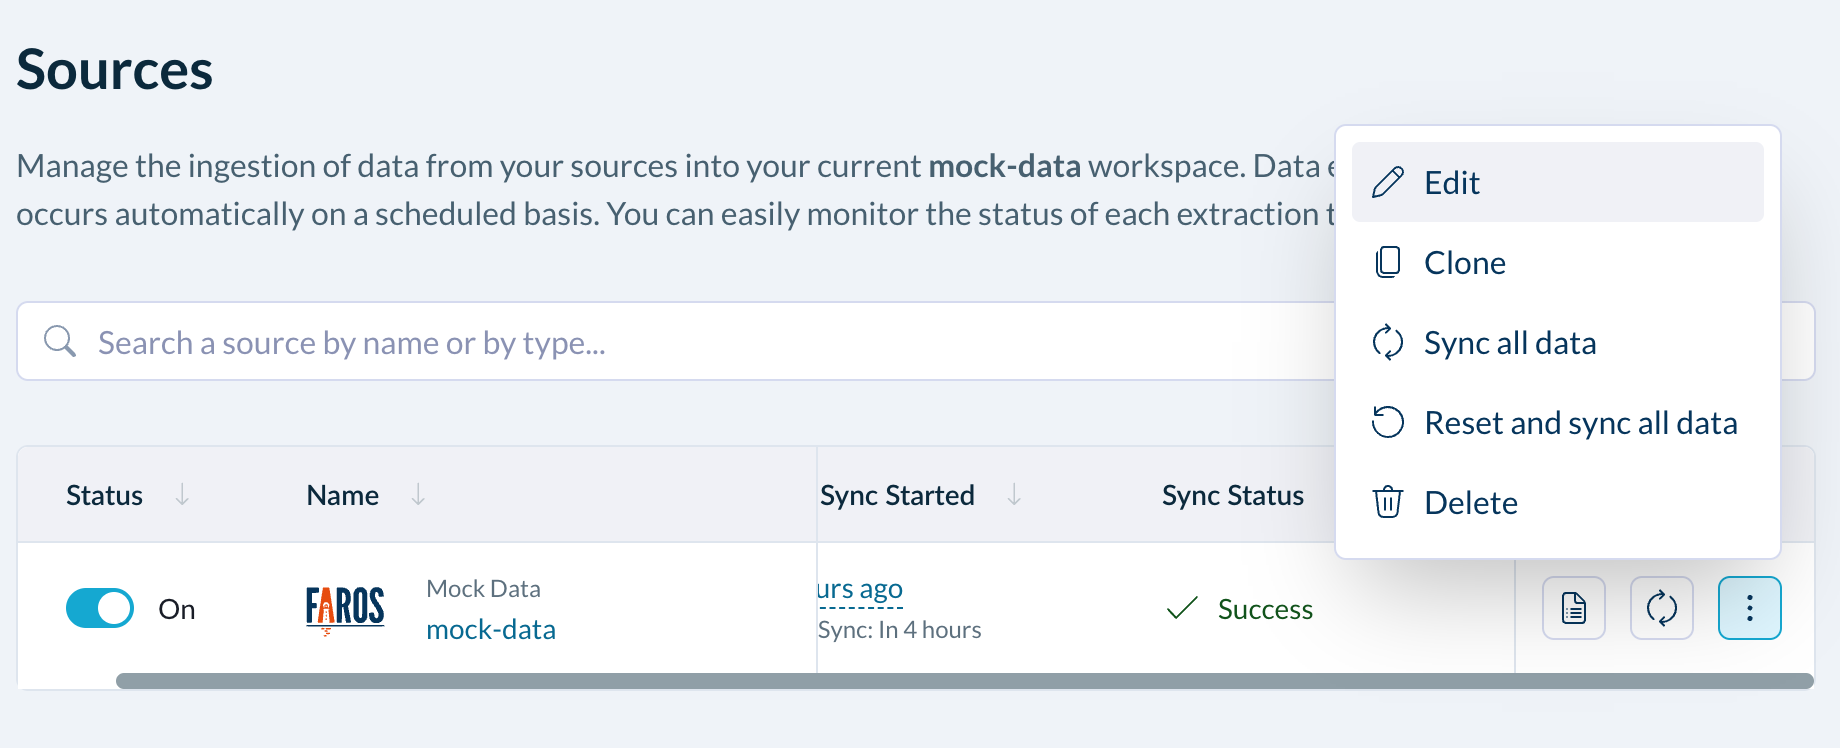
You can also enable or disable the source, edit the source, or force a new sync by choosing the appropriate button to the right of the source.
Including your Entities
Identify which boards and repositories are of interest to your organization. These objects must be included before Faros will pull all of their associated data.
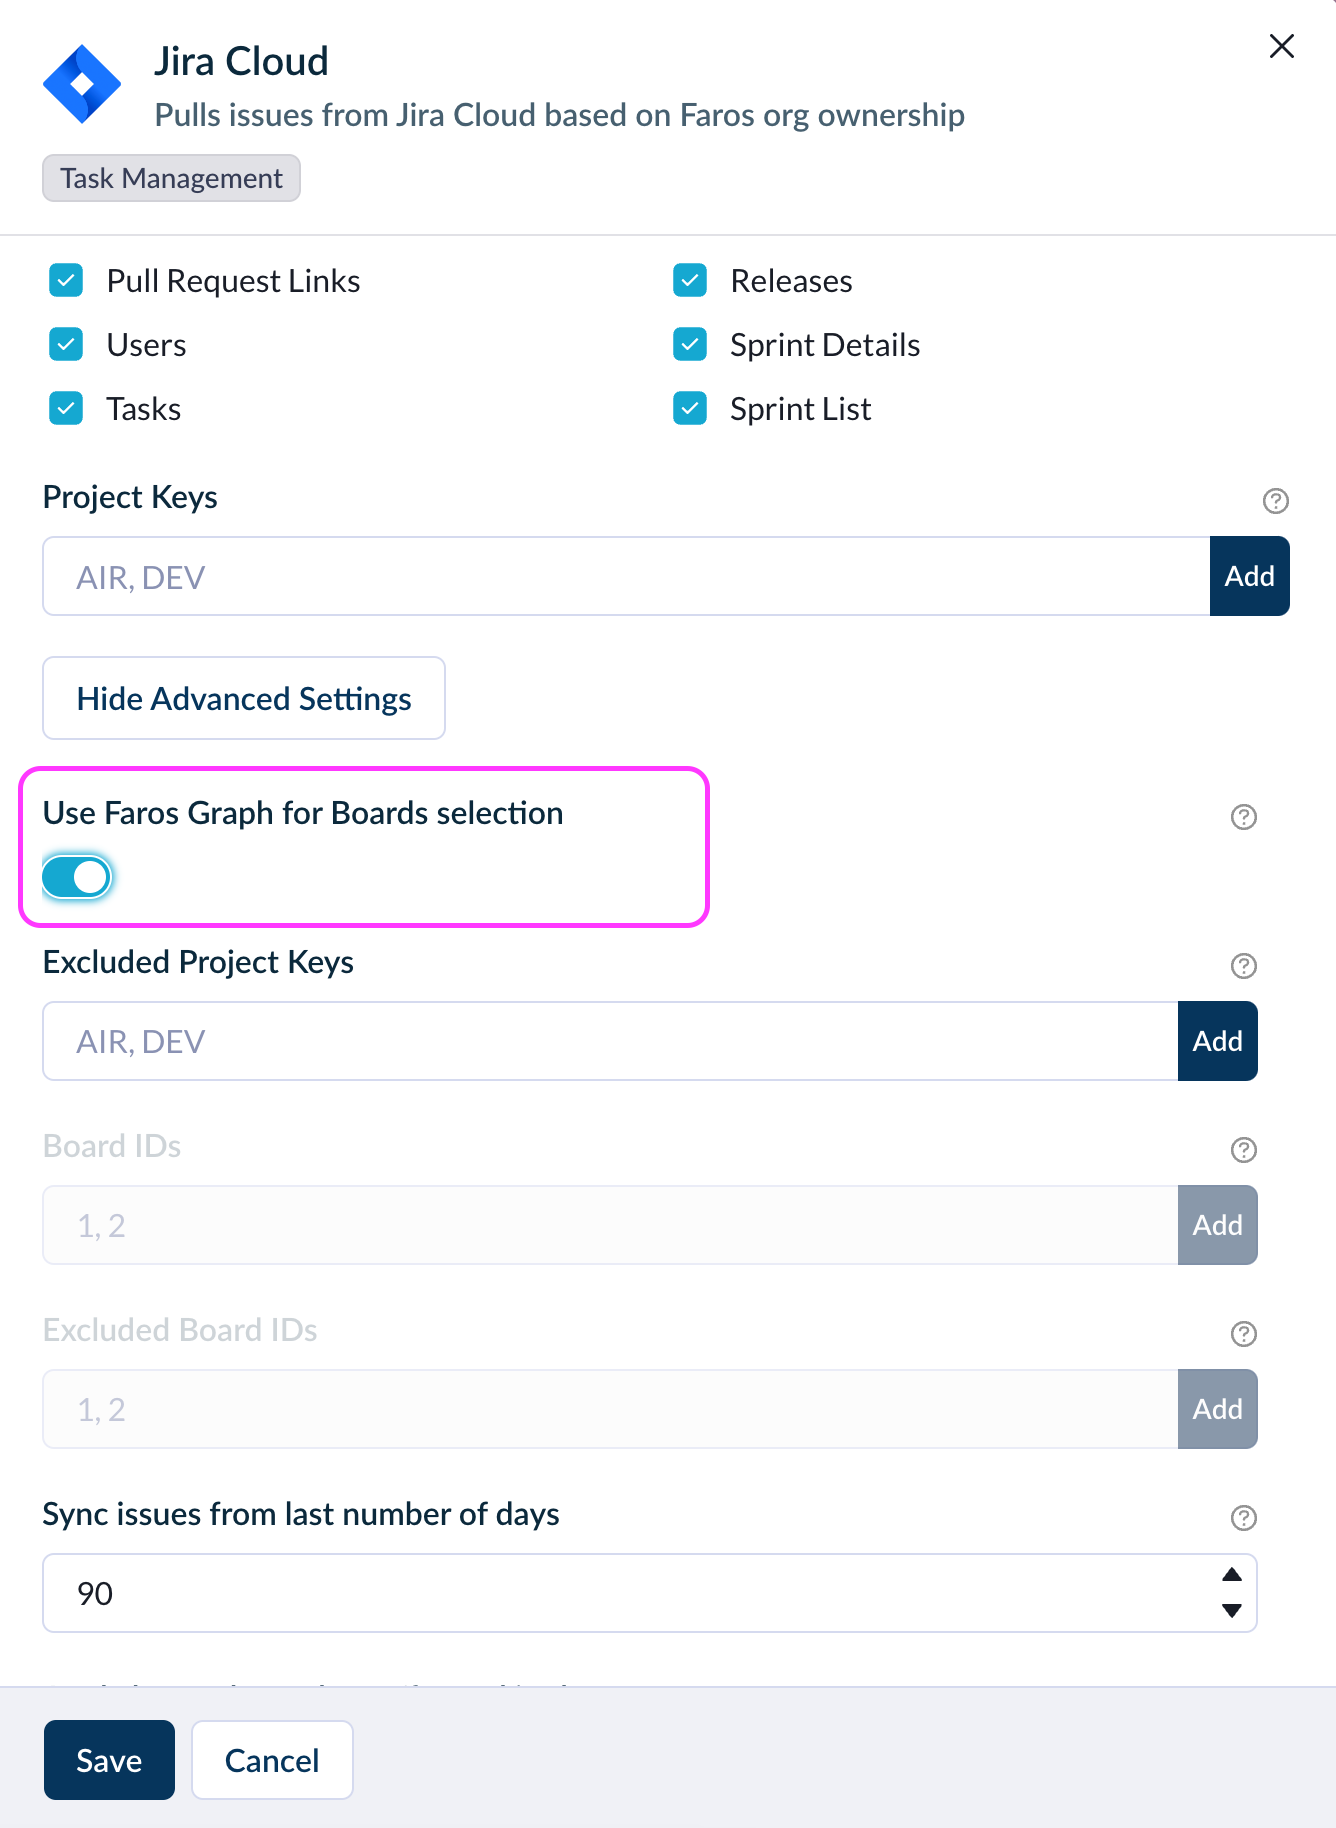
Under the Source's Advanced Settings, there are two available methods to control which boards or repositories are included in your Faros Data: this page
- Under Advanced Settings for your Jira Cloud source, toggle Use Faros Graph for Boards selection to On.
- Note: You can also configure this on at the source level. See this page for more details.
- Navigate to Admin Settings > Organization Setup > Boards
- On initial pull, all boards within the included projects will default to being included. If you’d like to exclude a board, mark it as ‘Excluded’ and then click the checkmark icon.
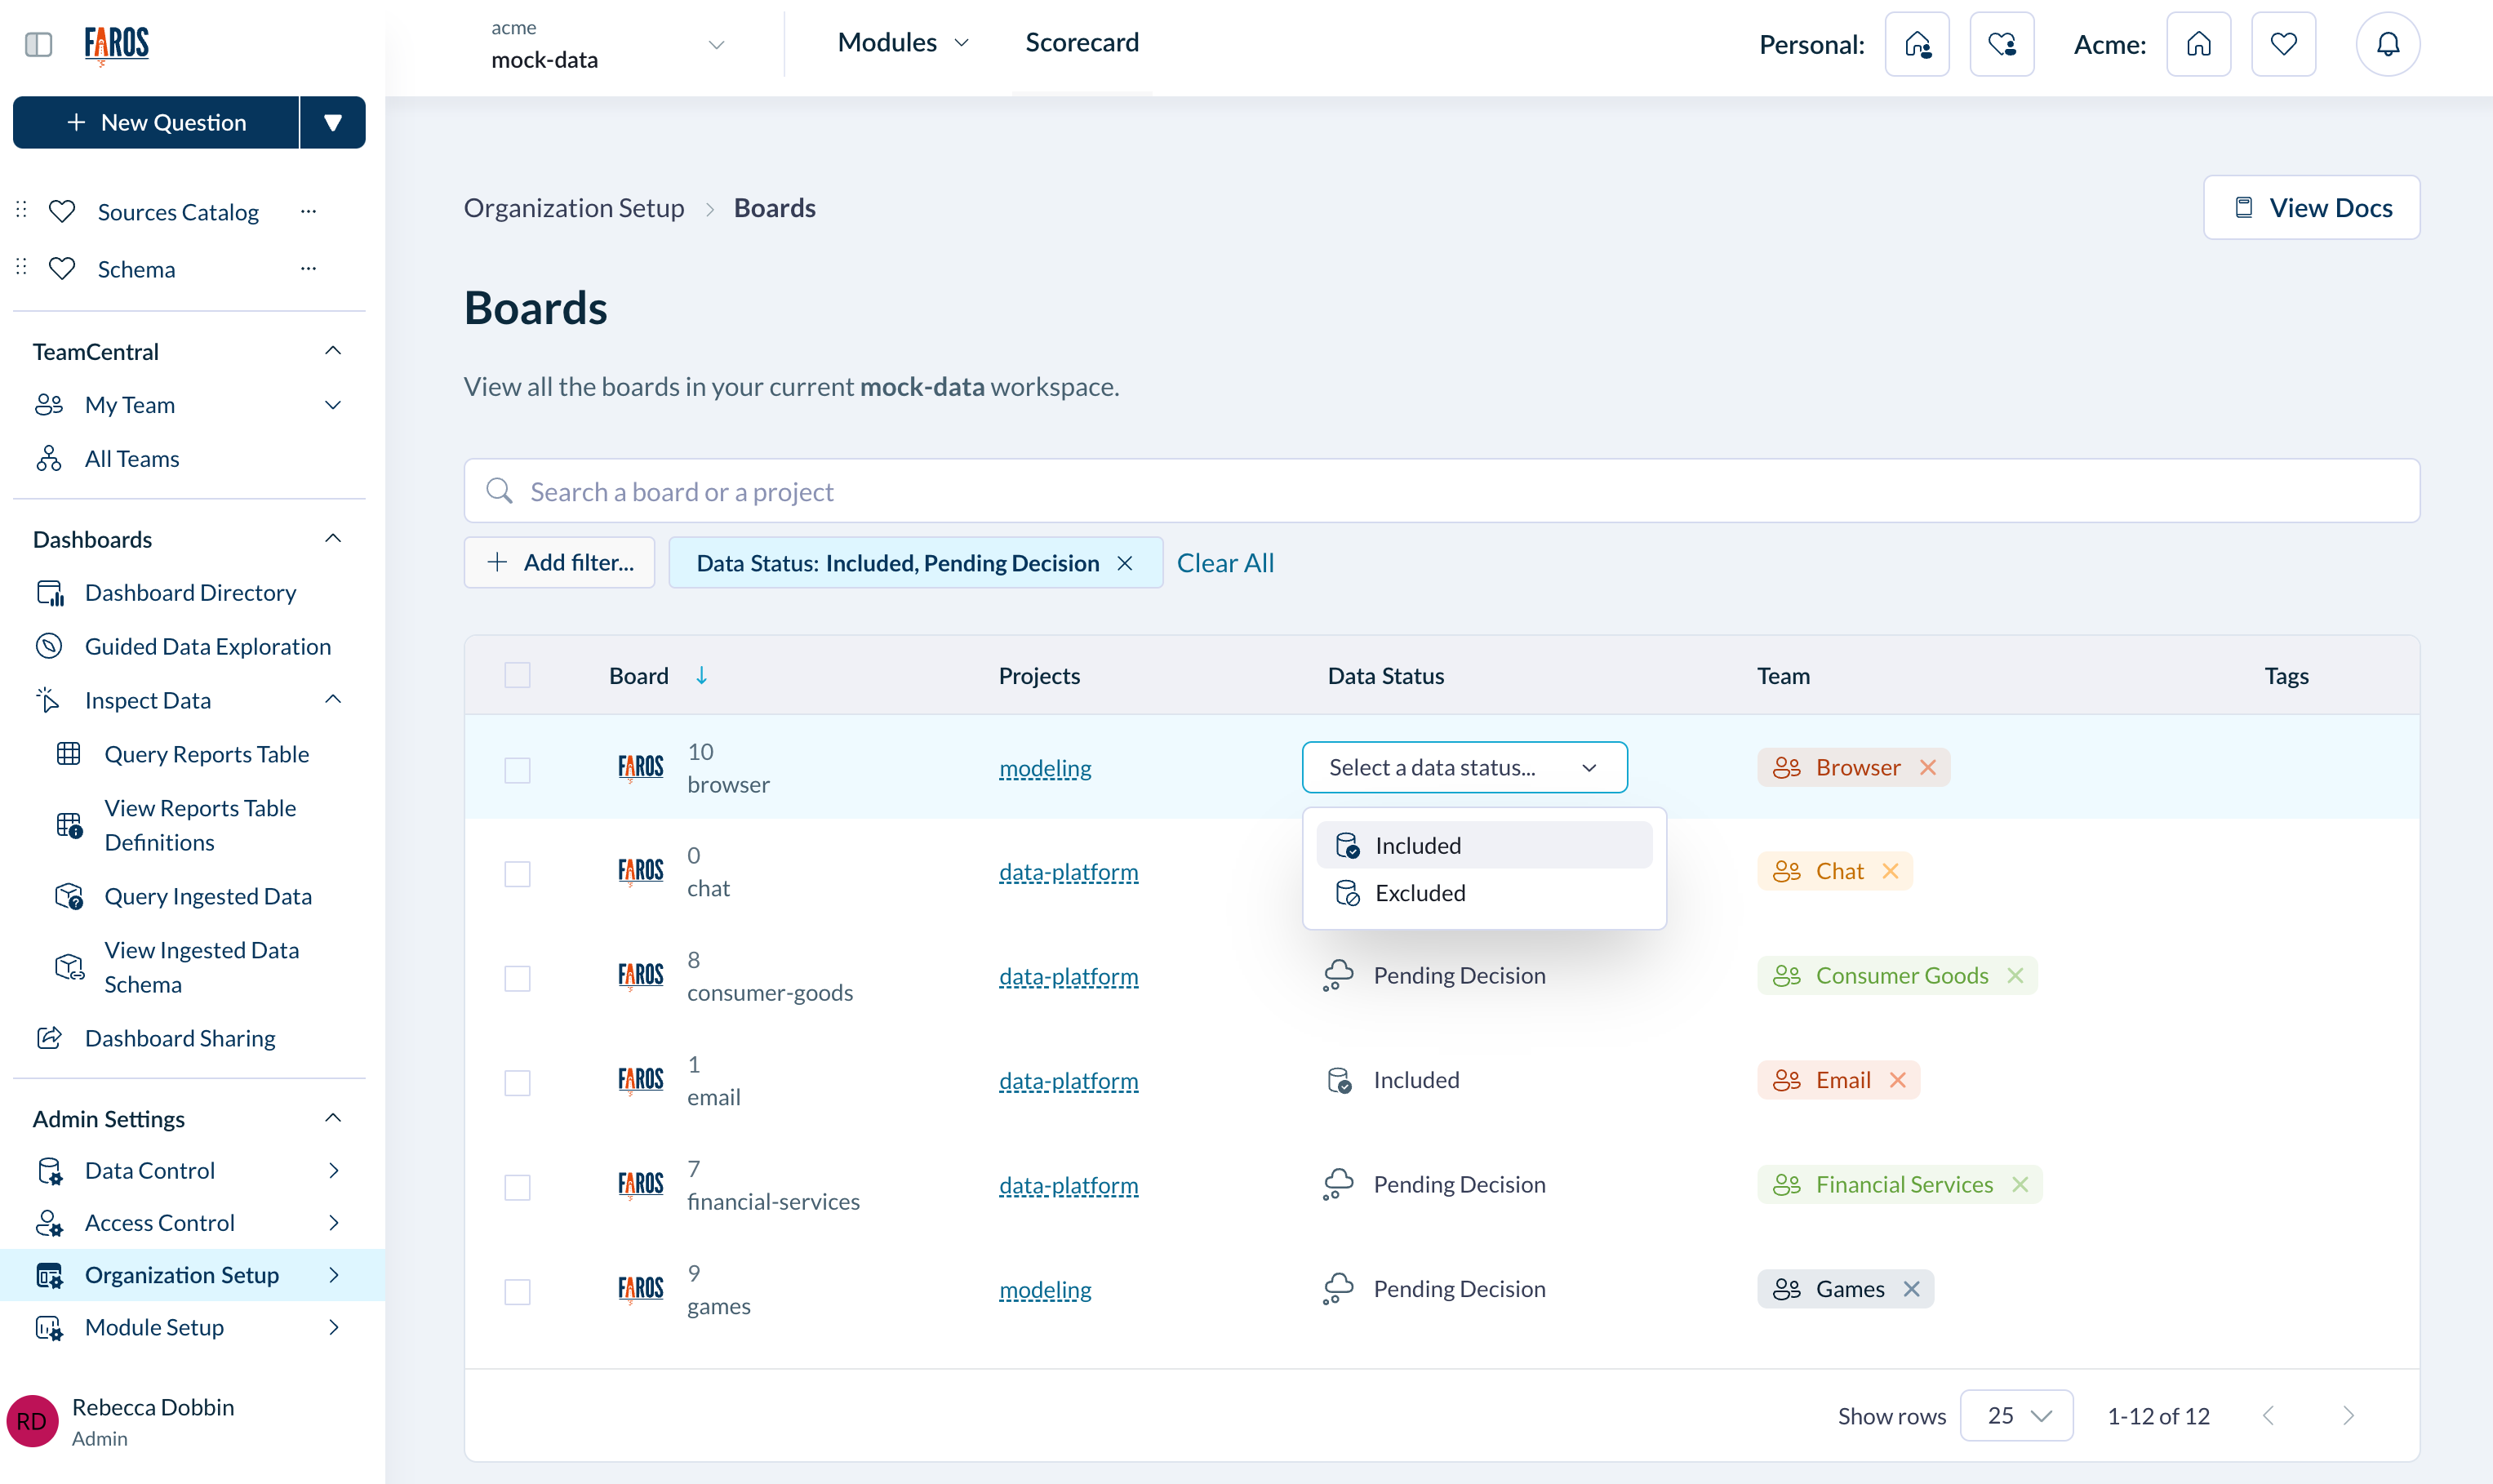
Include or Exclude Boards
Optional: Assigning Ownership
All data that is included will show up in the dashboards, but if you want to view insights broken down by teams you'll need to assign ownership. See this page for more details.
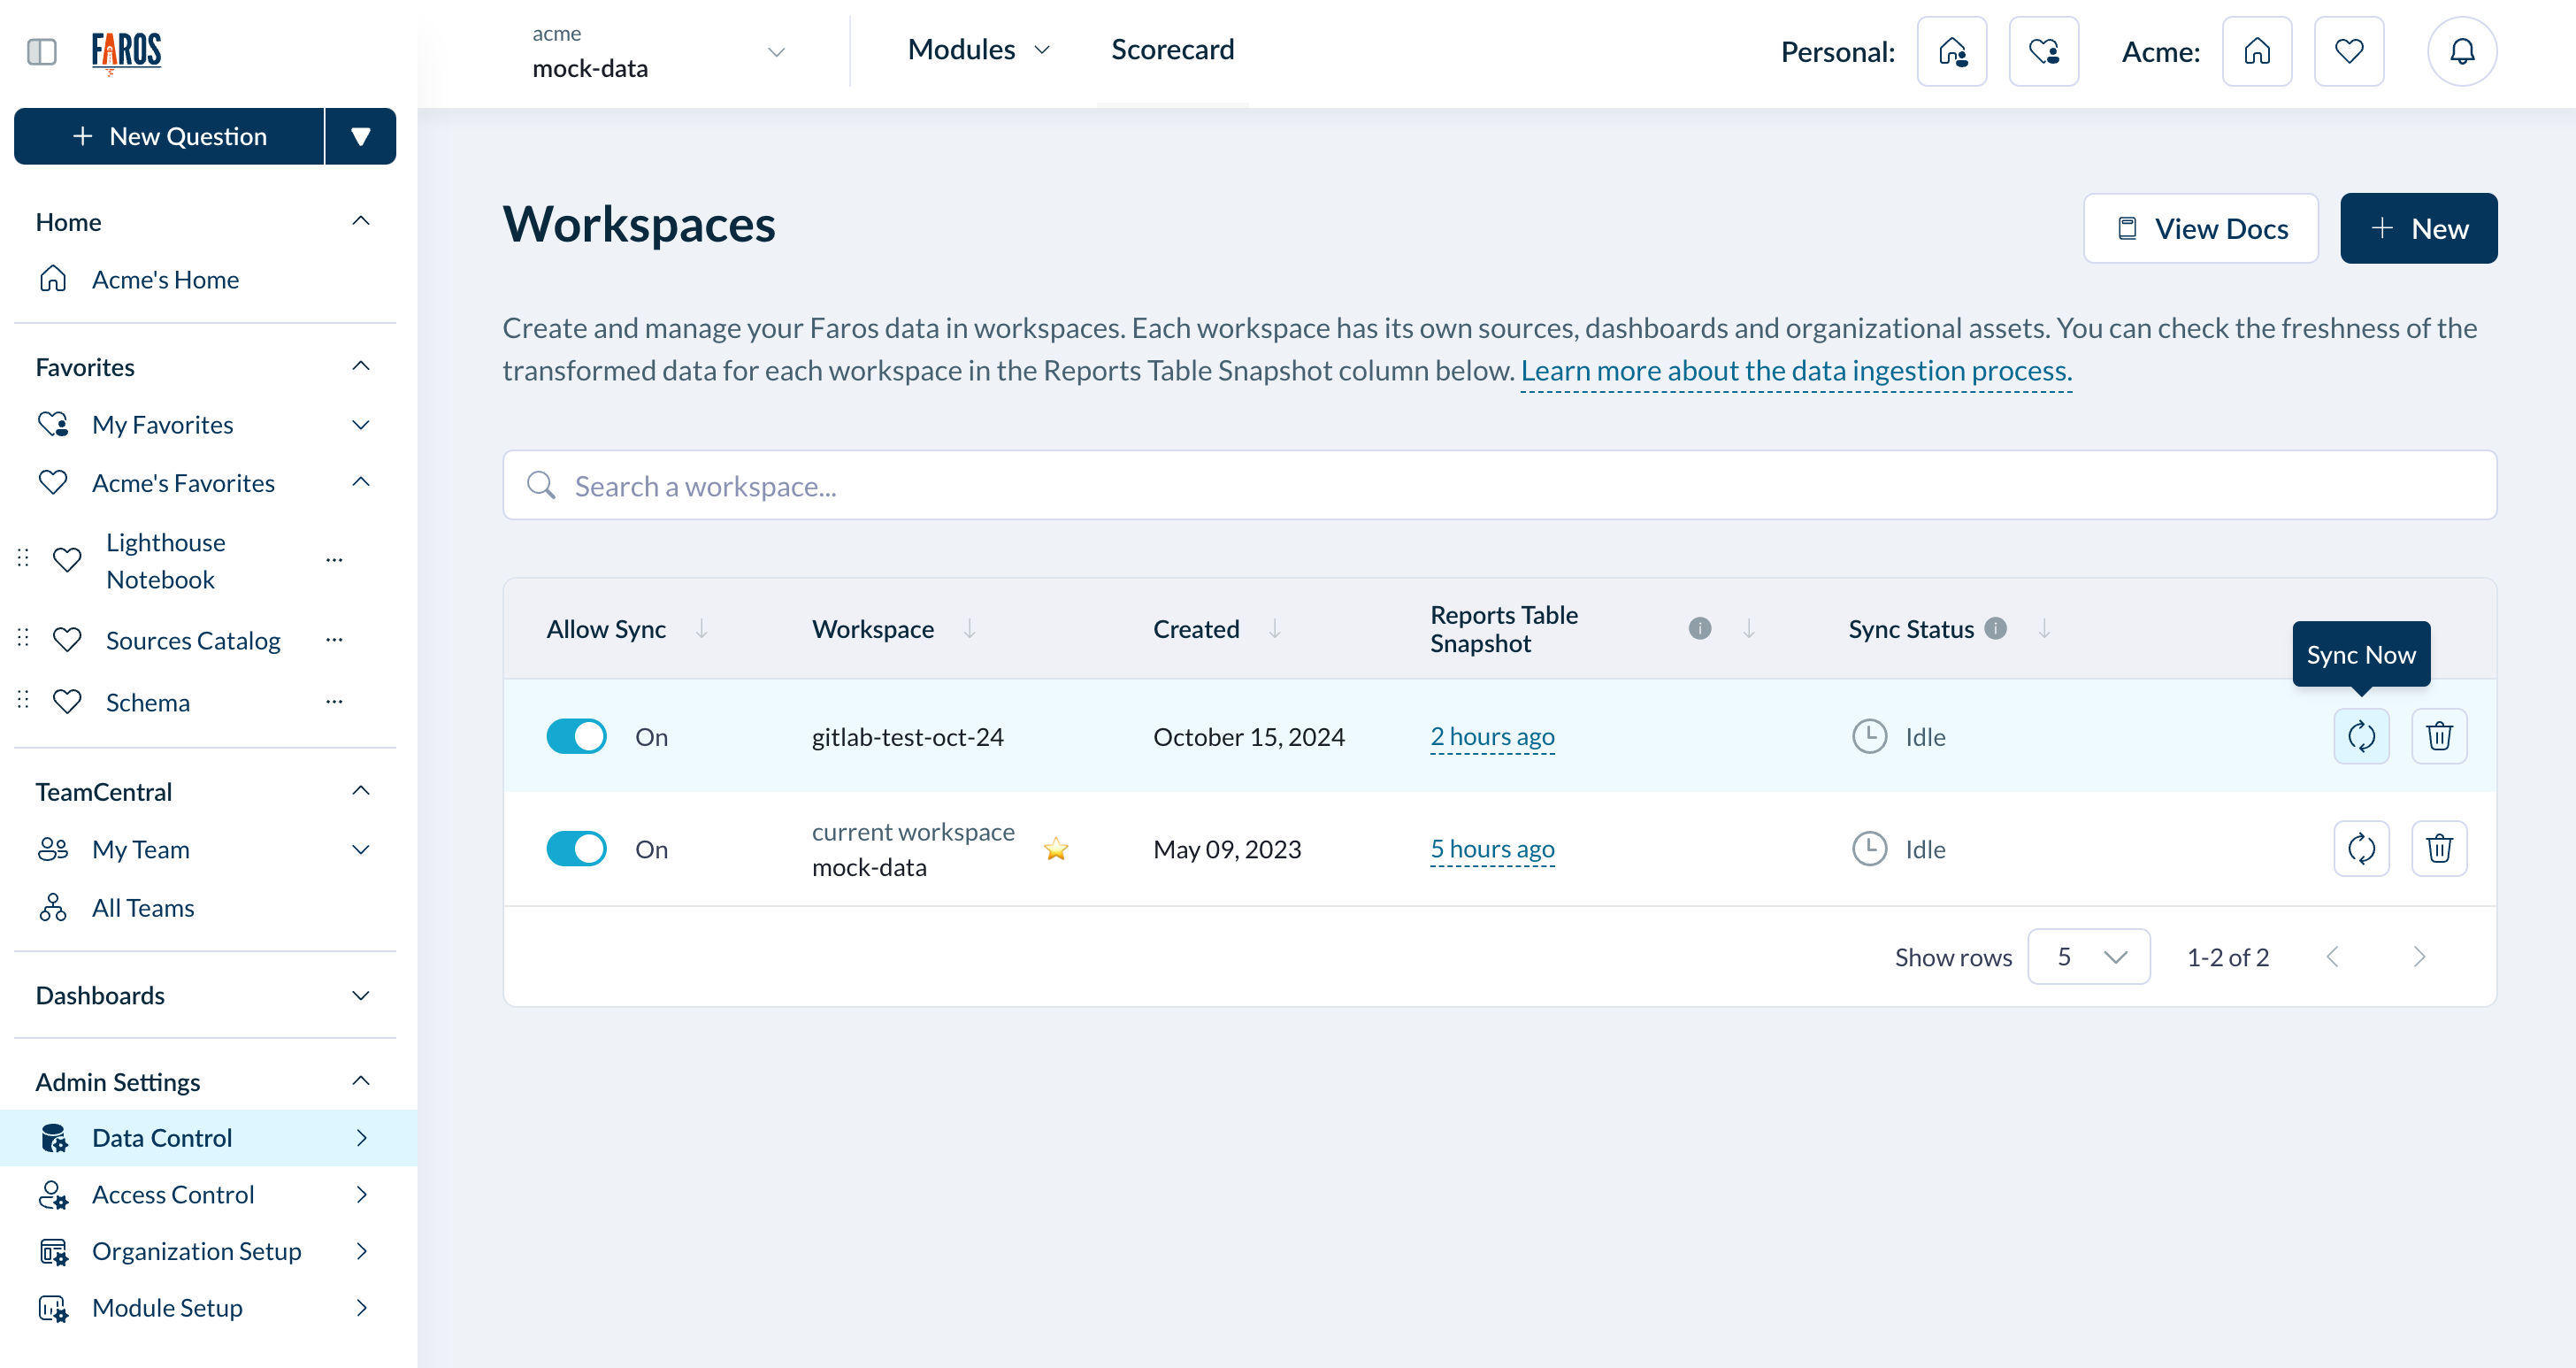
Once teams have been assigned, you will need to run a workspace sync. To do this, go to Admin Settings > Data Control > Workspaces, and kick off a workspace sync.
Query Ingested Data
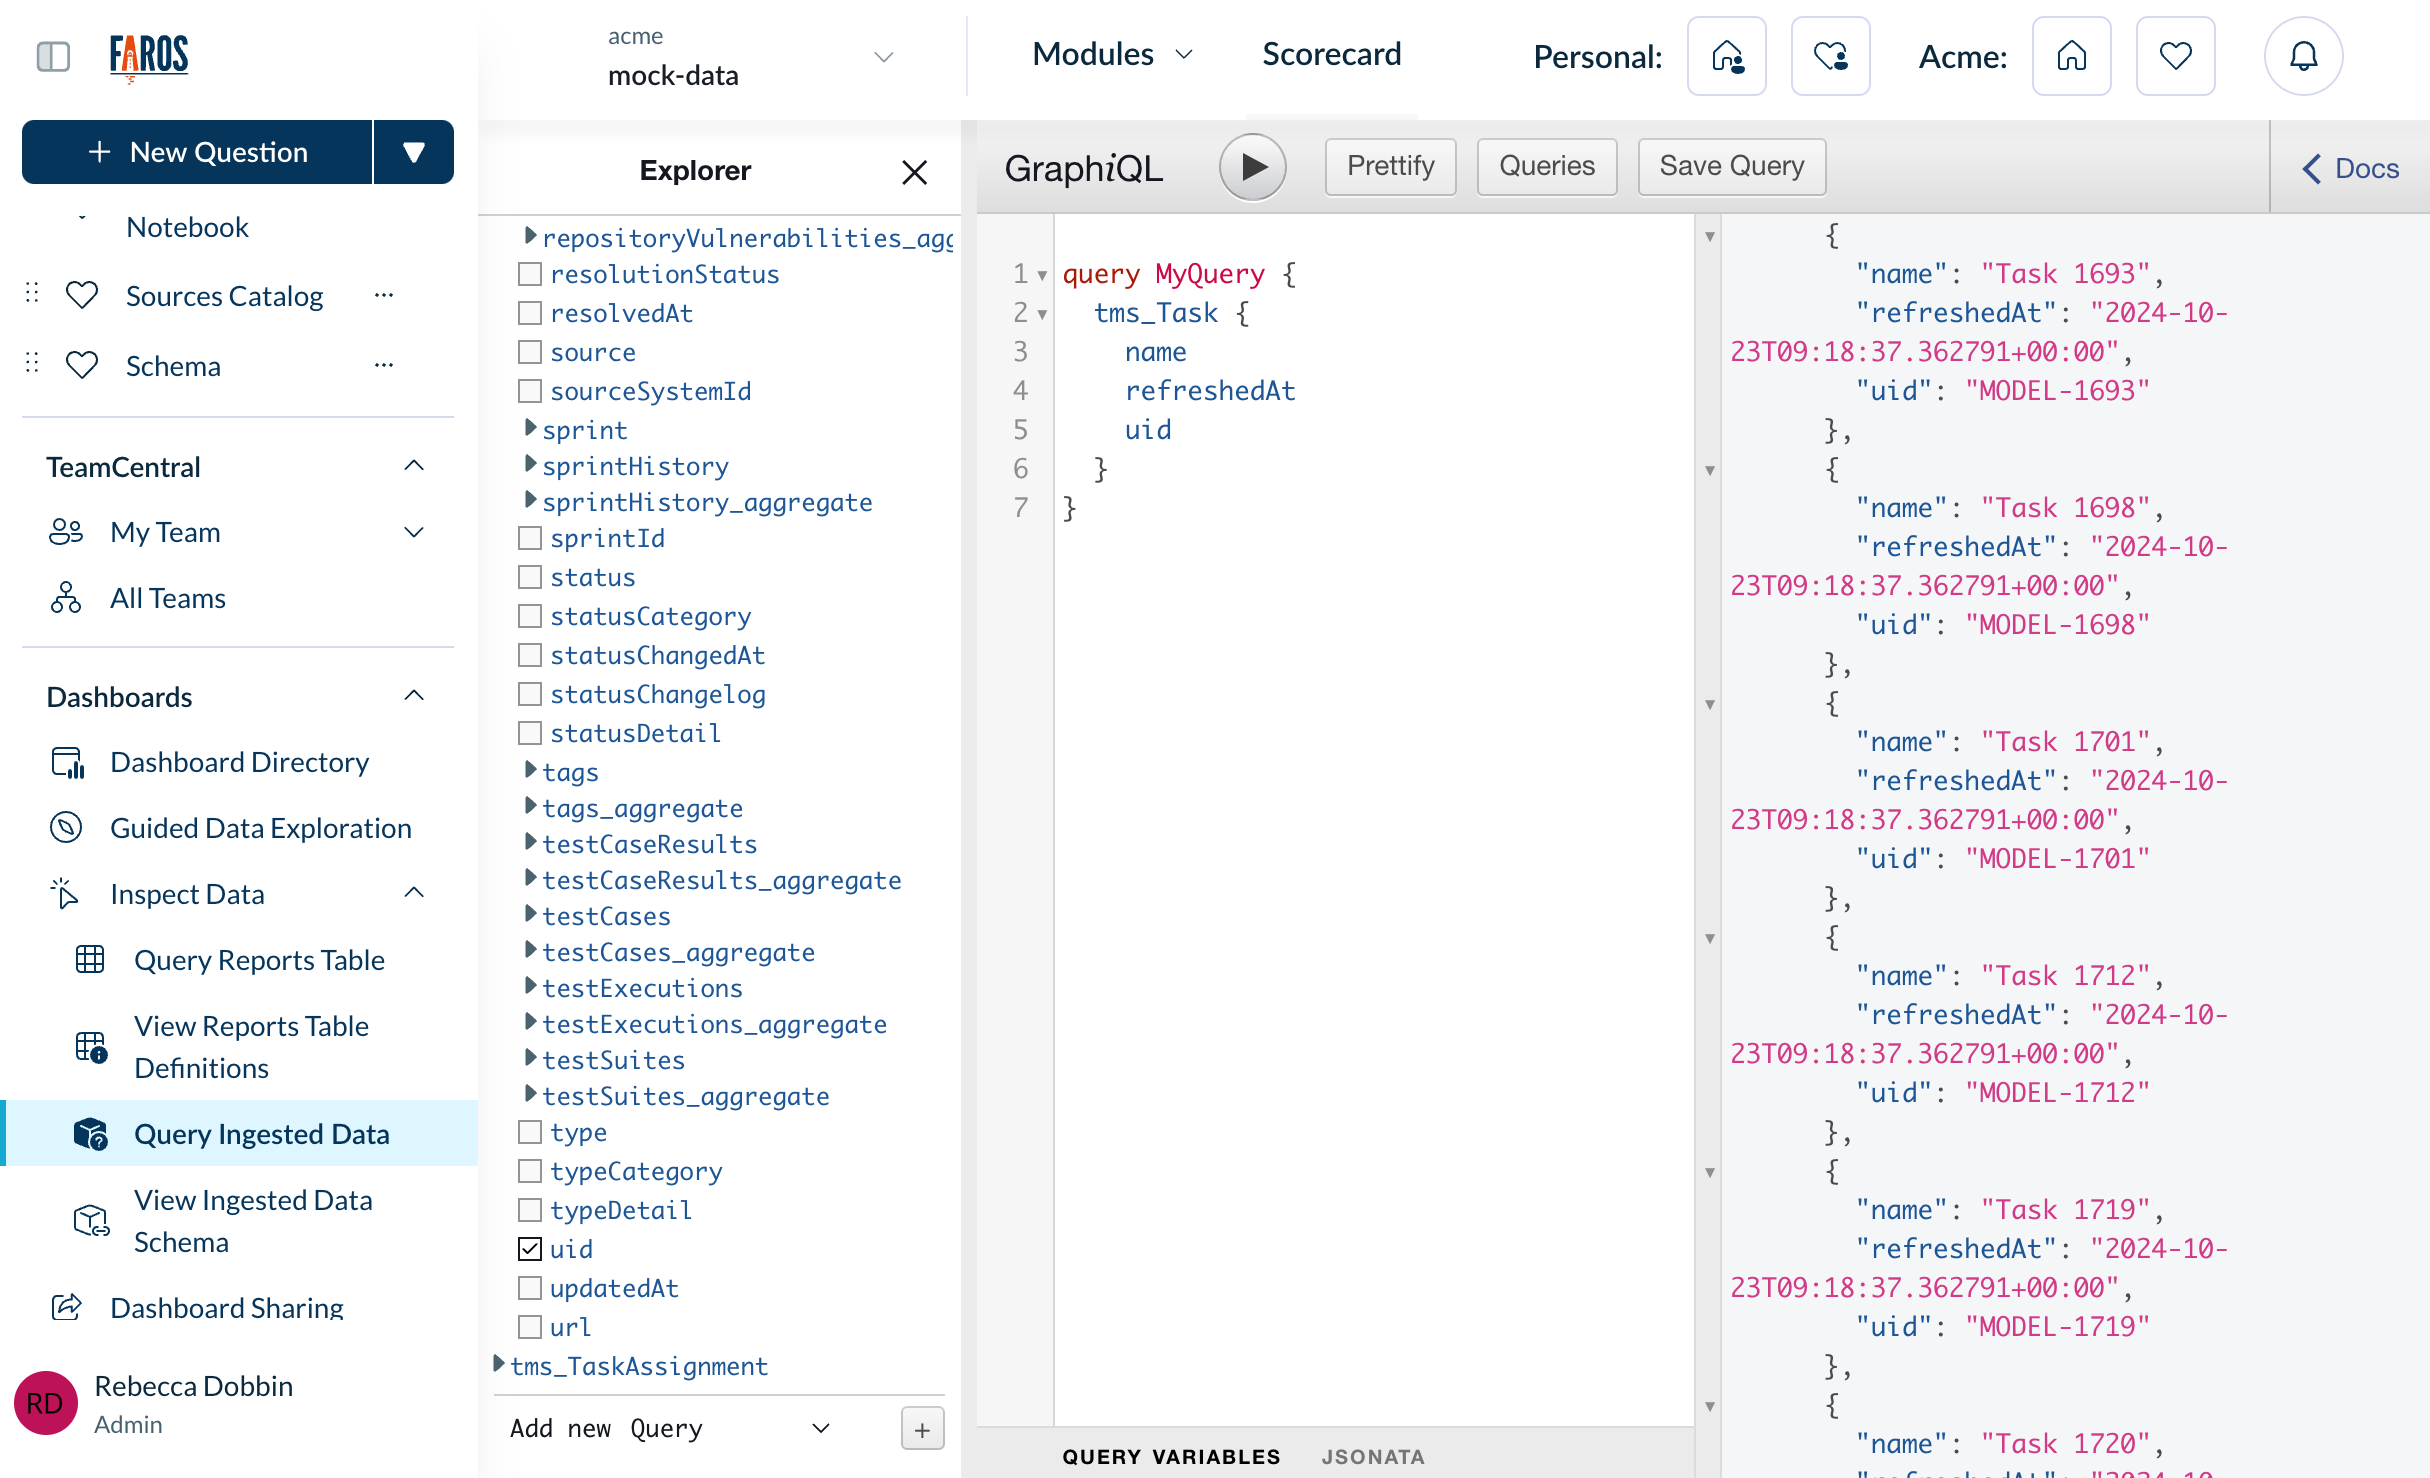
You can inspect your data by navigating to Dashboards > Query Ingested Data. This data will be available shortly after the initial data sync runs.
To inspect the data, expand your desired artifact type, for example tms_task, and select the fields you’d like to see (for example, name, UID, and refreshedAt). This will show you the data that Faros AI has ingested thus far.
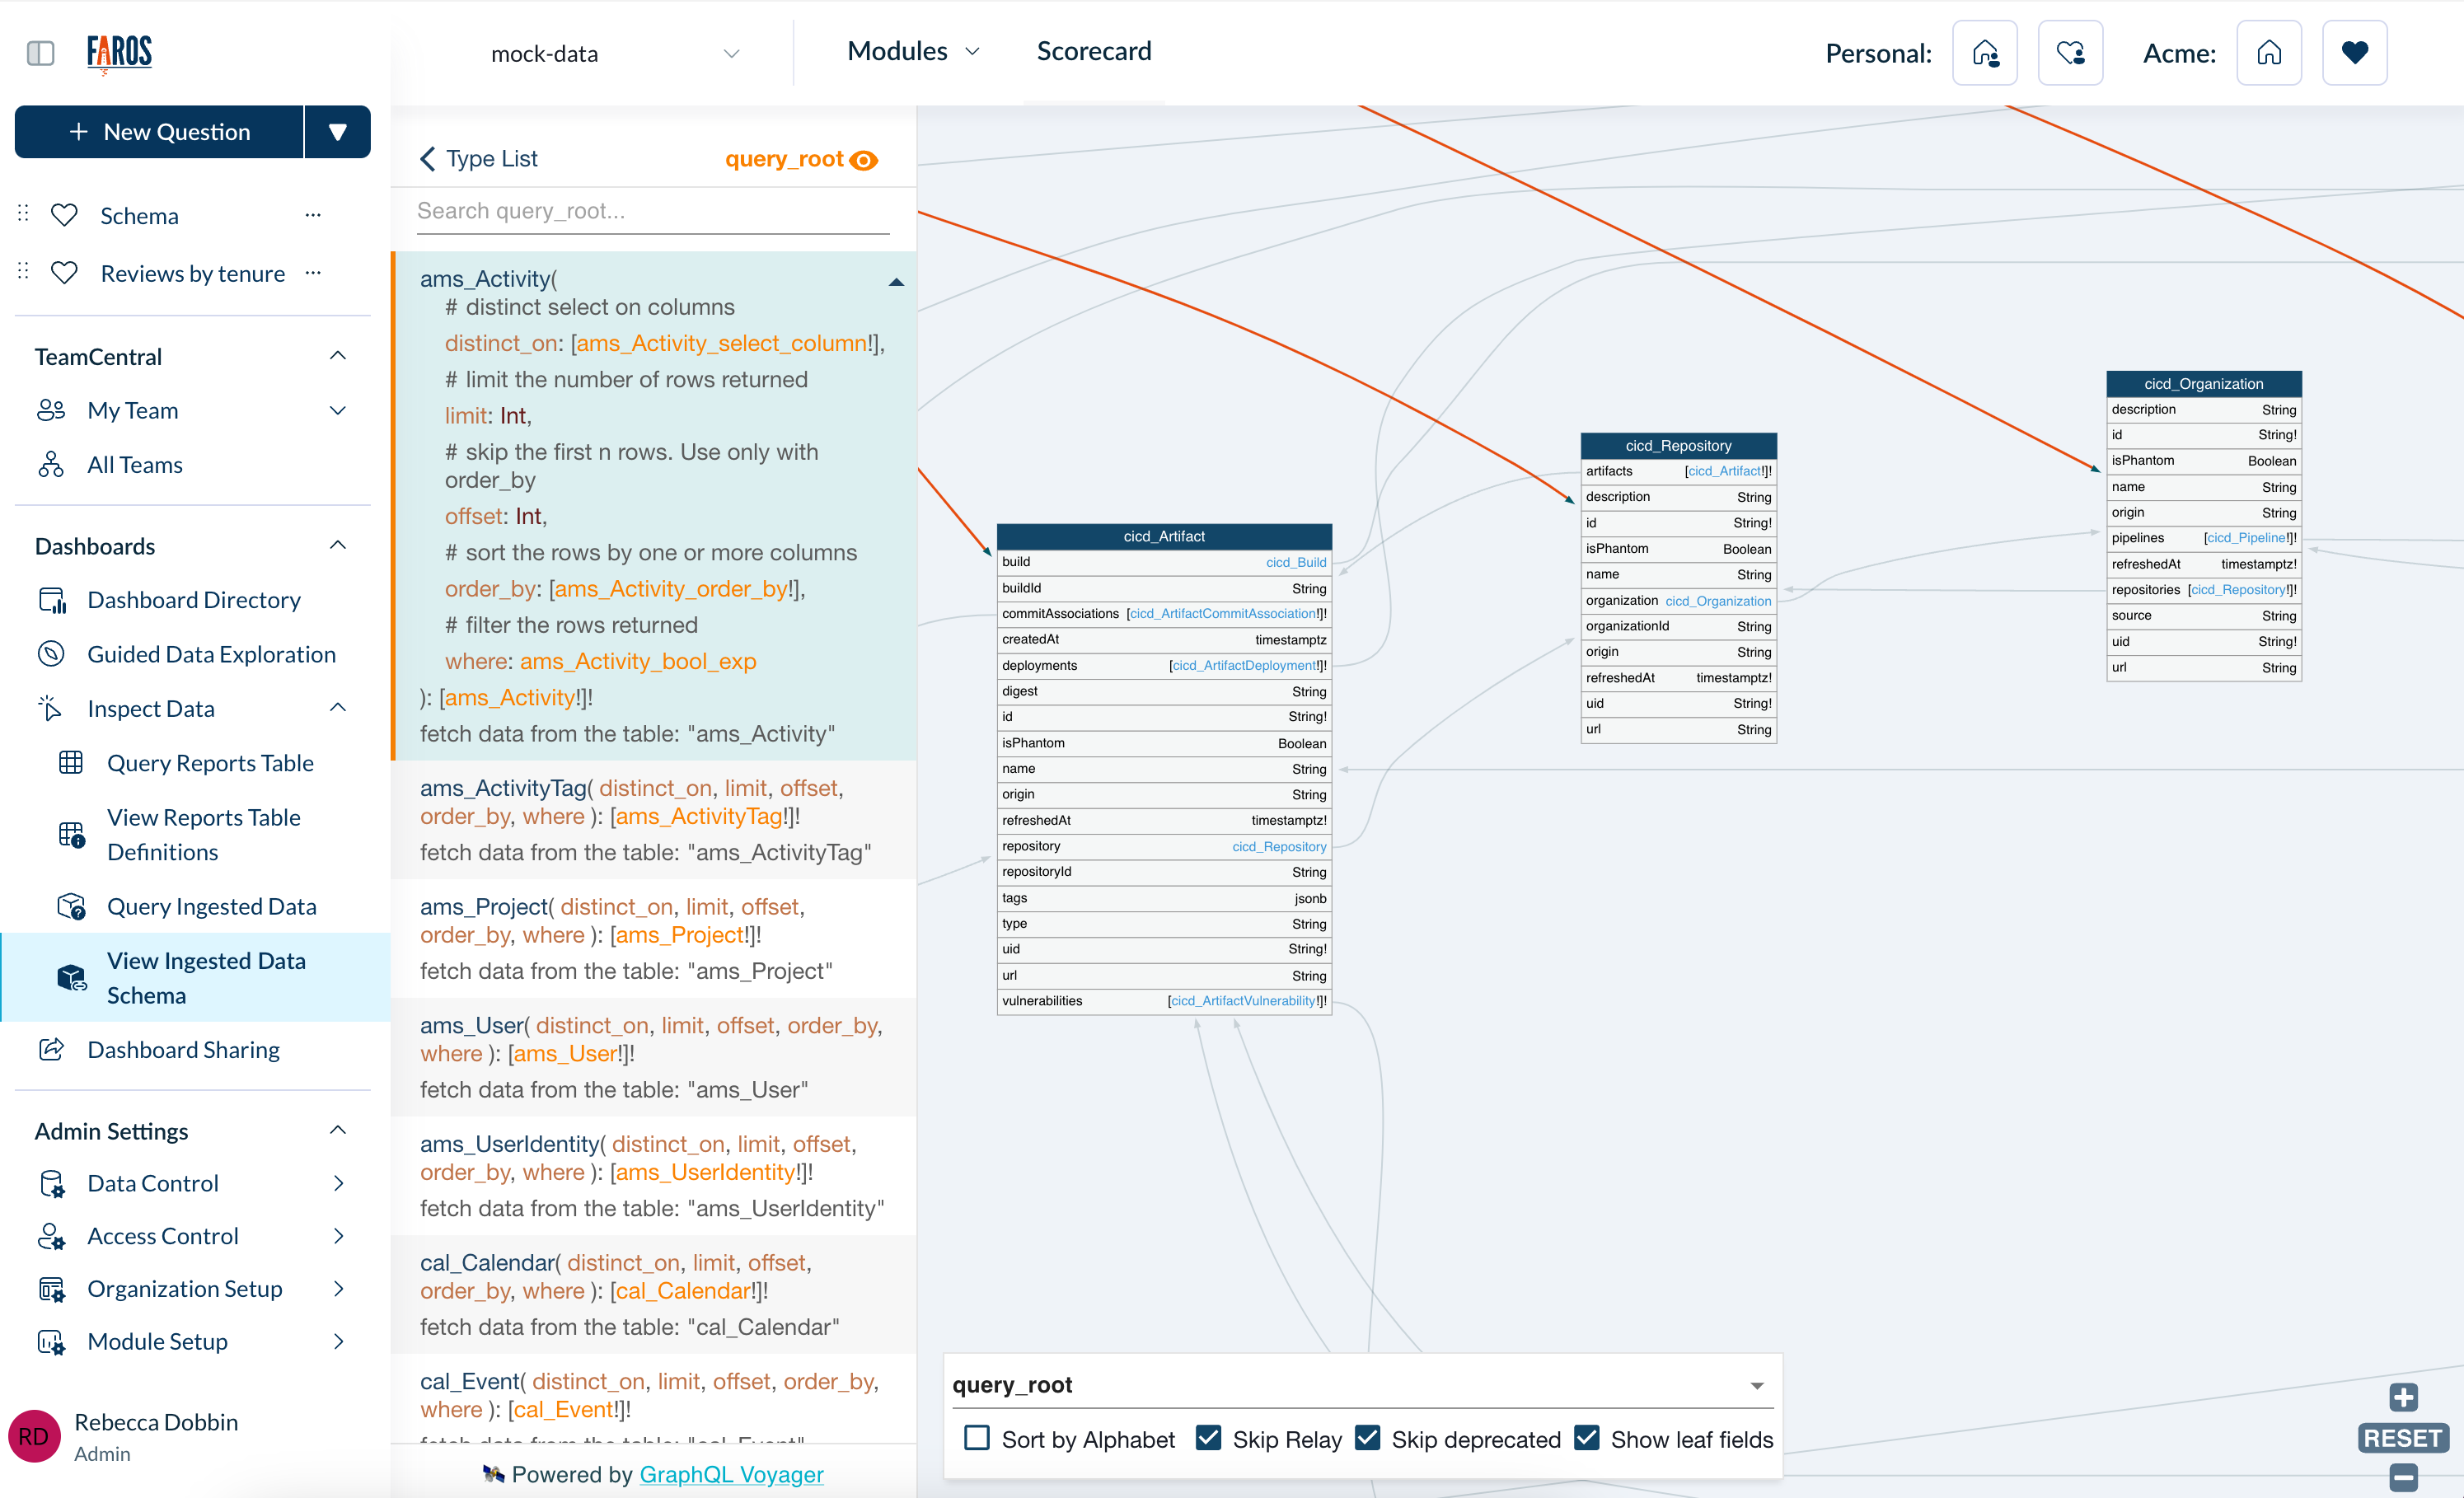
You can also navigate to Dashboards > View Ingested Data Schema to see how Faros AI standardizes the data for use in modules and dashboards. Zoom in to the chart on the right of View Ingested Data Schema to see the exact field mappings that Faros AI will utilize to build reports. You can learn more about the Faros AI schema here.
In order for data to appear in Faros AI modules and dashboards, a workspace sync will need to run. The workspace sync takes raw data and translates it into a form such that it can be used for Faros AI reports.
Faros AI modules and dashboards will not populate until the first workspace sync runs. If needed, you can manually kick off a workspace sync by navigating to Admin Settings > Data Control > Workspaces.
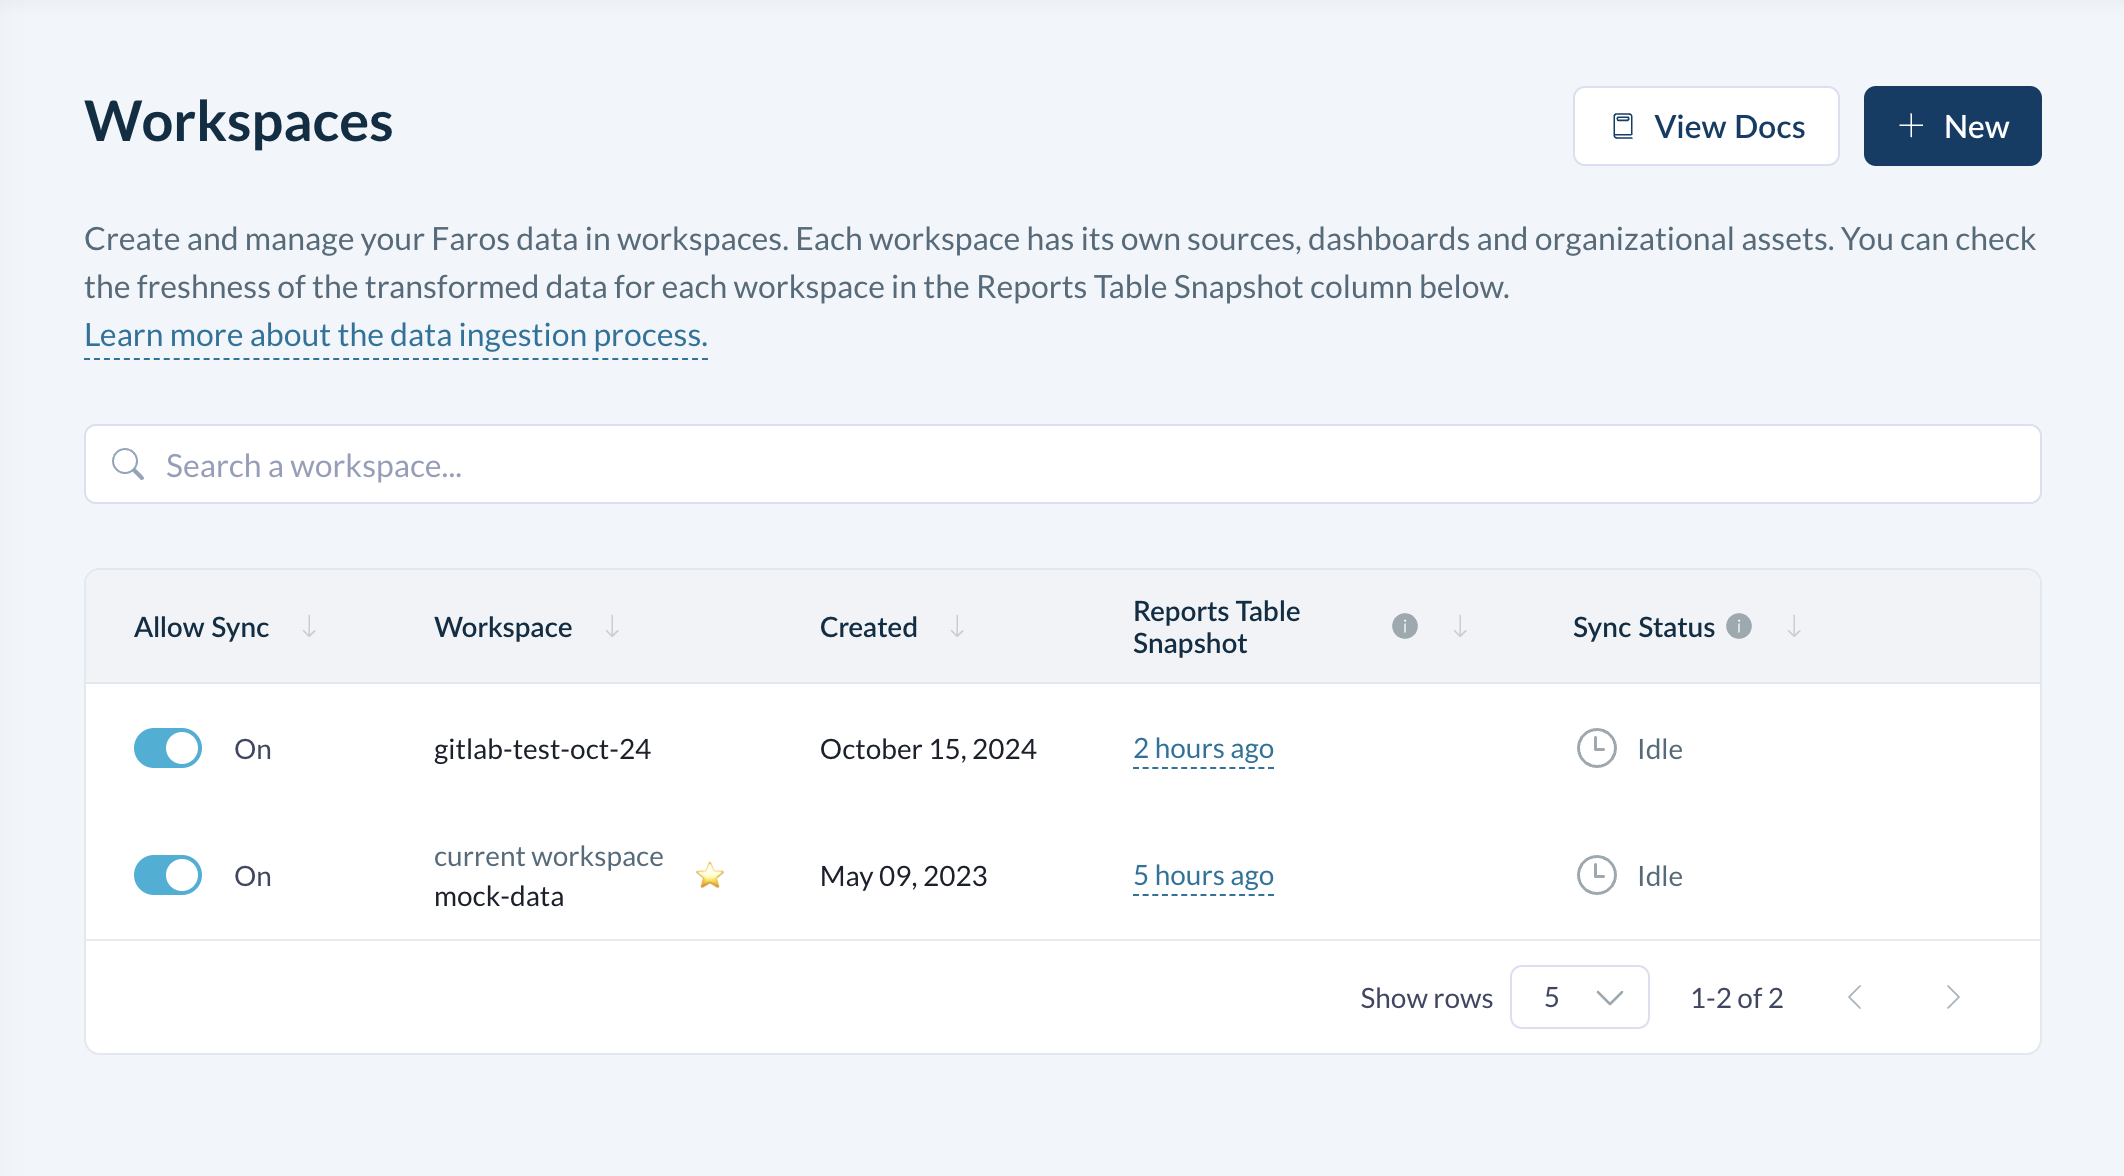
Once Faros AI is running, you can assume that data in Faros AI modules and dashboards will only contain data through the most recent workspace sync. The workspace sync runs on a set schedule, typically every 6 hours.
On the Workspaces page, you can see a reports table snapshot, which gives you information on the freshness of the data. The timestamp will show when the data started getting loaded from the graph in the last successful sync, i.e. it is the lower bound of data freshness.
You can go to **Dashboards > Query Reports Table **to see the available data after a workspace sync runs. This will show how Faros AI has processed the data for use in reports.
Viewing Faros Dashboards
Once you’ve confirmed your data sync & workspace syncs are up-to-date, you can view the Faros out-of-the-box modules and dashboards.
To view one of Faros' out-of-the-box dashboards:
- Navigate to Dashboards > Dashboards Directory
- Under Faros reports, open your desired dashboard
Creating your organization structure in Faros will enable much deeper insights into your data and is required before many out-of-the-box dashboards will work correctly. The next sections of this guide will walk you through organizing your data and give you more detailed information on dashboards.
Updated 5 months ago