
Custom Dashboards: Tips & Tricks
Intro
Below are common questions & answers about how to further customize charts and dashboards within Faros AI to meet your unique needs.
For a general overview on creating custom dashboards and charts, see Custom Dashboards.
You can also find tips & tricks related to building a query here.
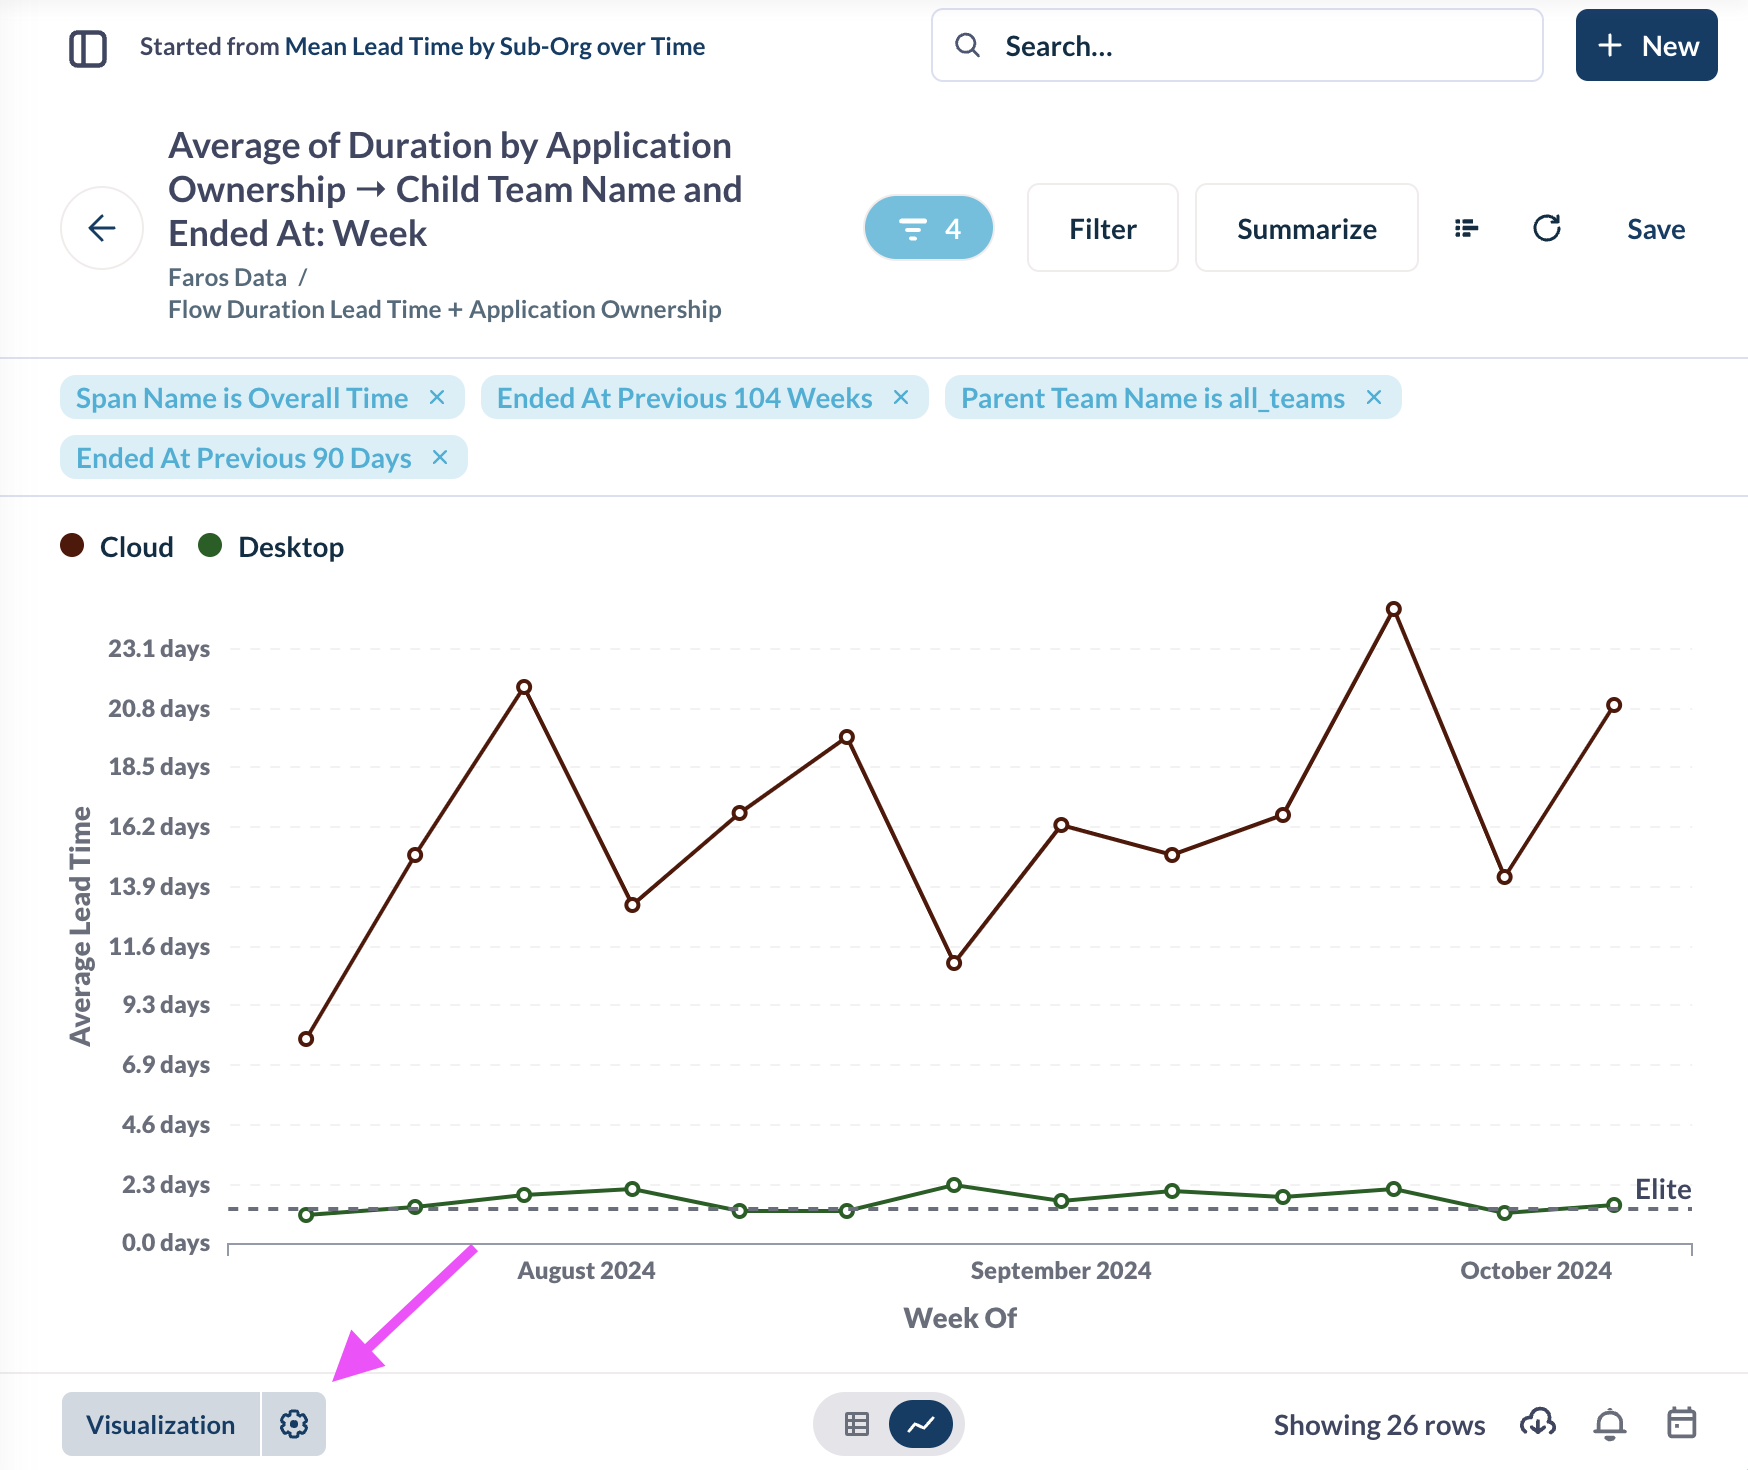
How can I change the units displayed in a chart to hours or days?
-
Click on the Visualization settings icon underneath a chart
-
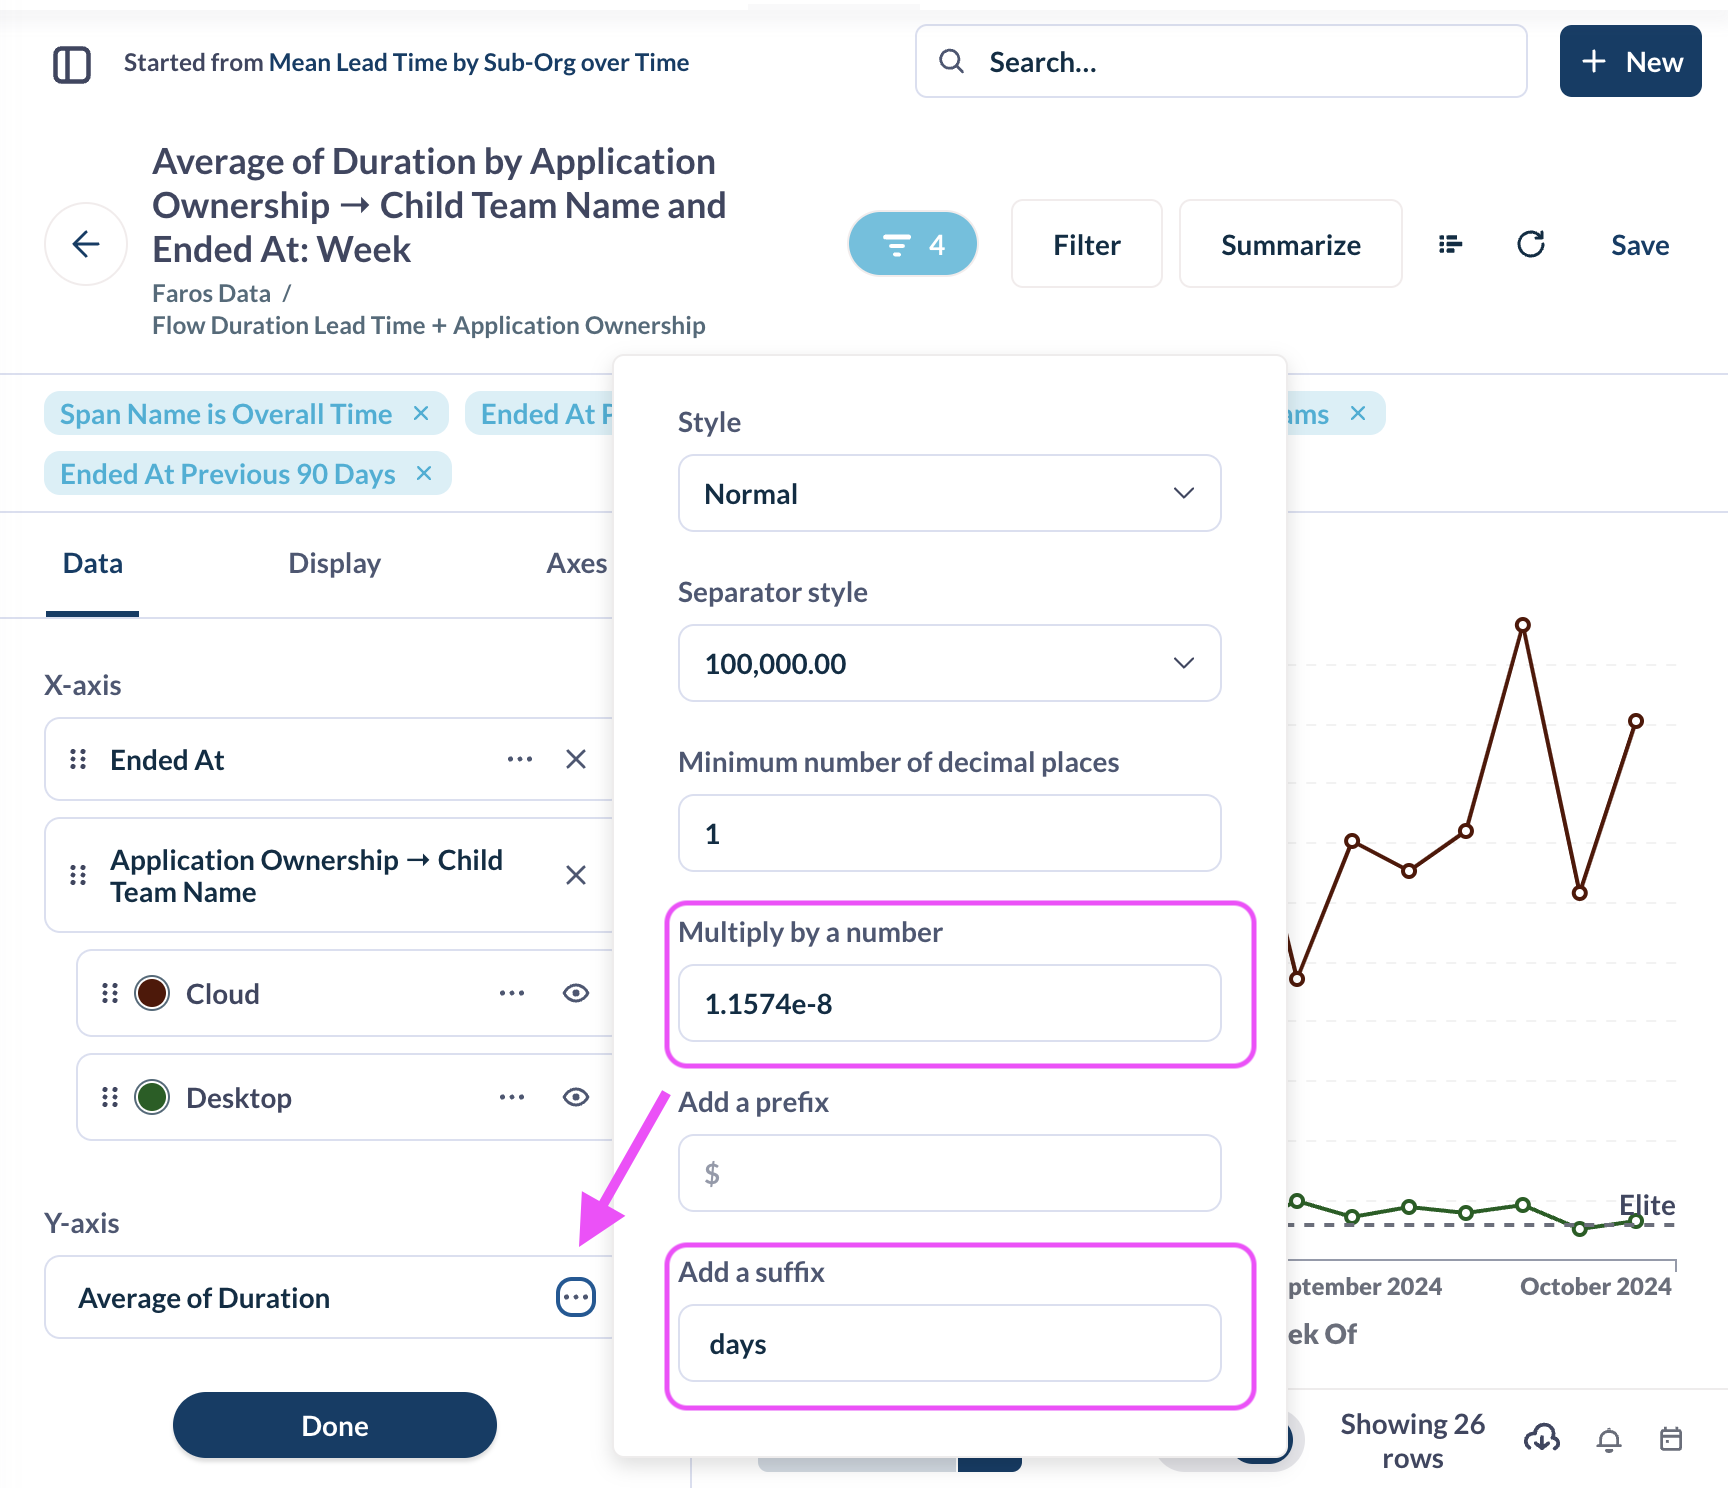
Click on the Y-axis Average of Duration
-
-
Update the Multiply by a number and Add a suffix fields. The base unit is milliseconds, so the values you’ll use are:
- For days,
- Multiply by a number: 1.1574e-8
- Add a suffix: days
- For hours,
- Multiply by a number: 2.77e-7
- Add a suffix: hours
- For days,
-

-
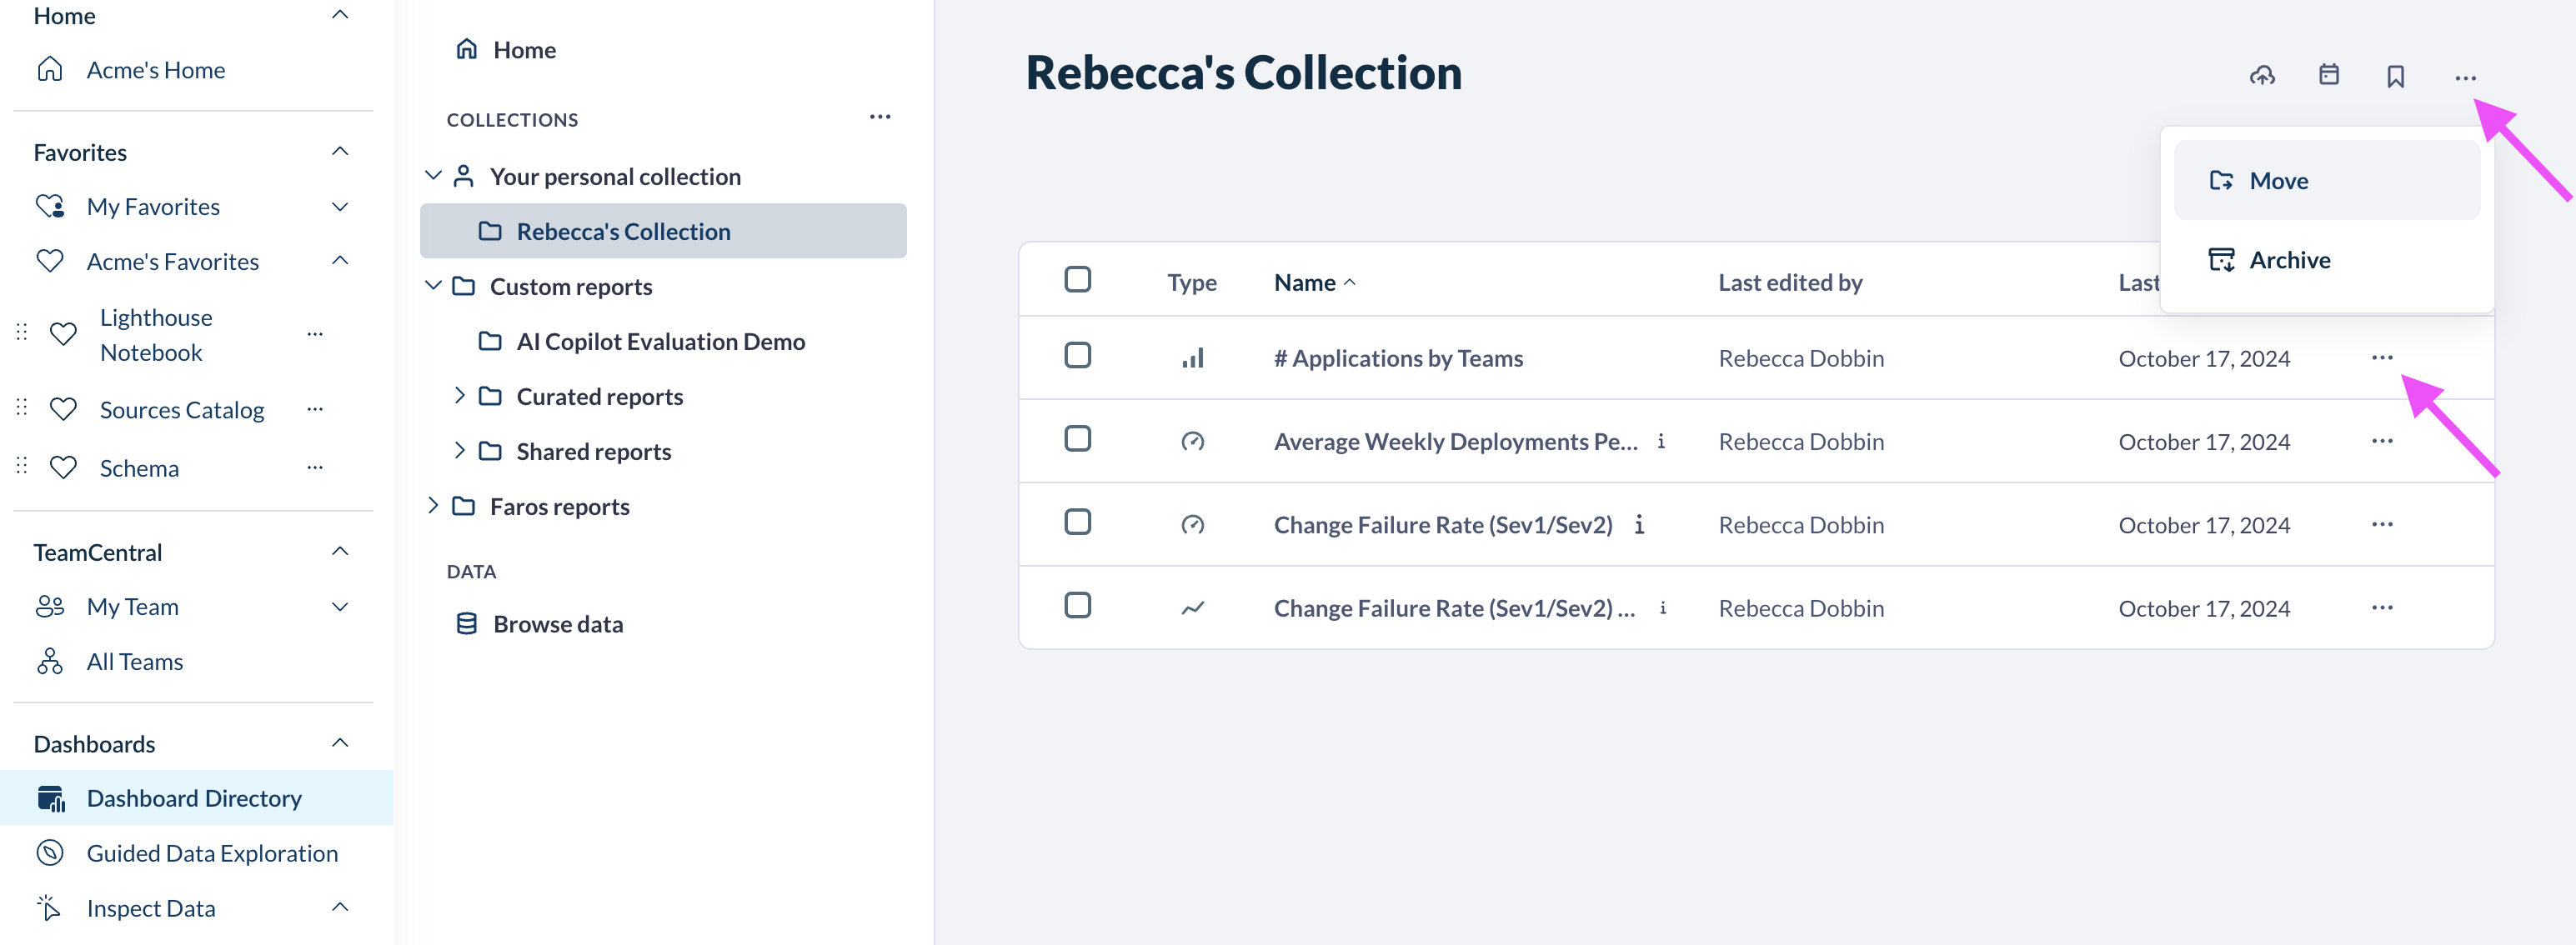
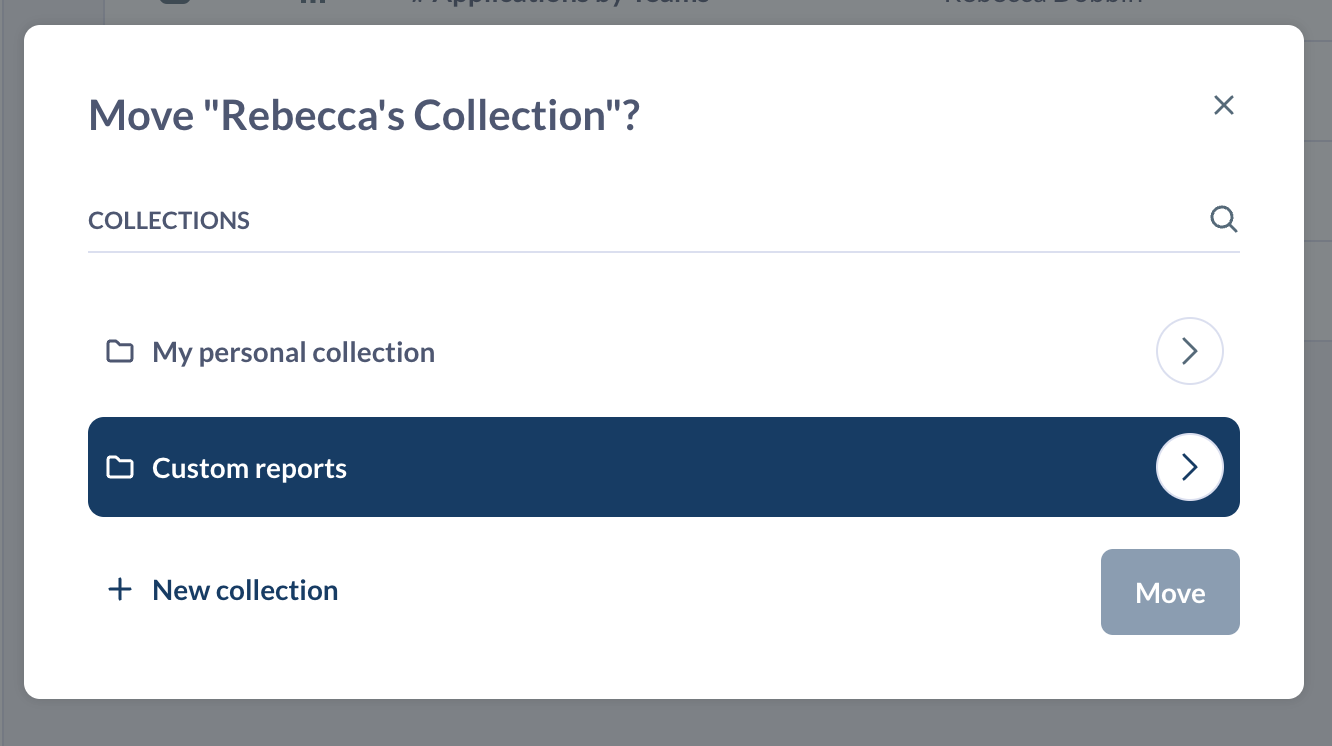
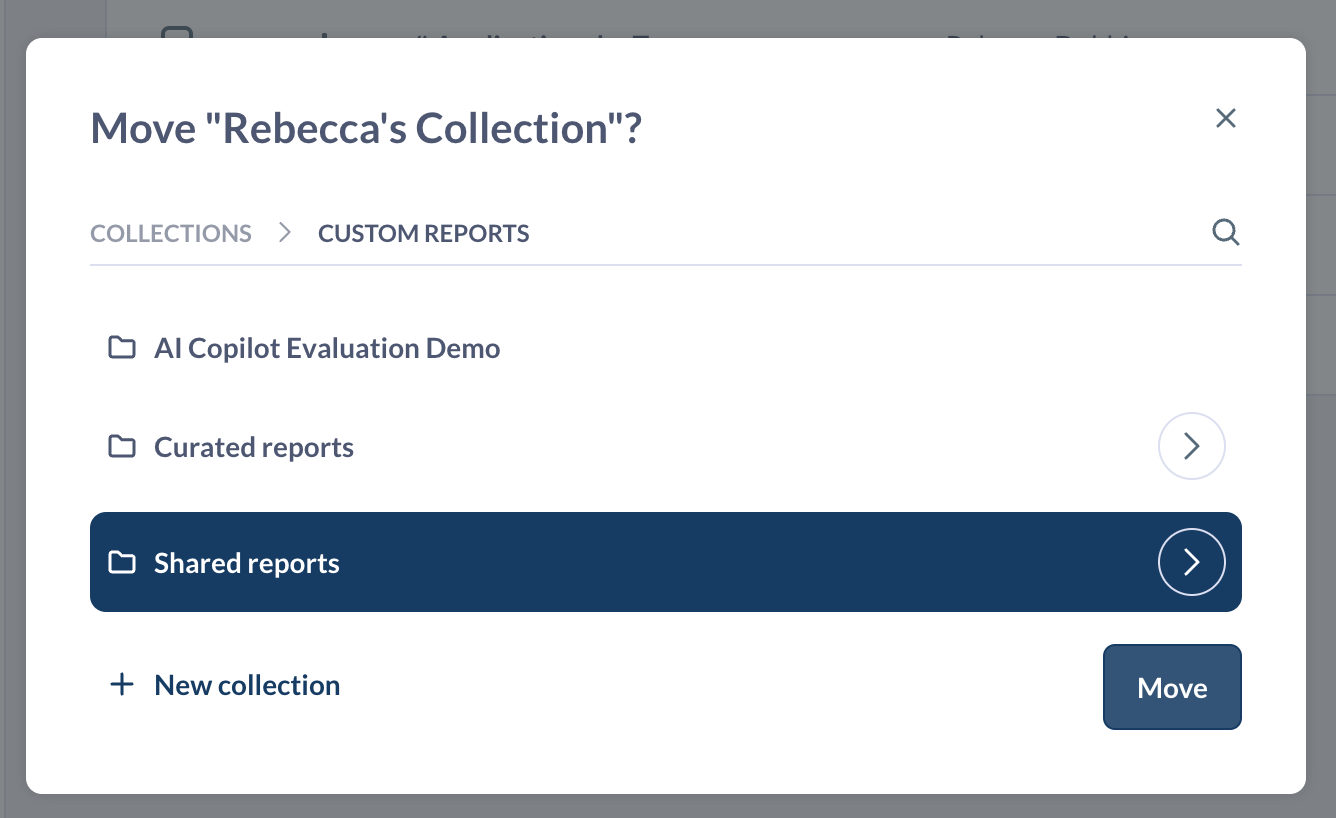
Move it to Custom Reports > Shared Reports
-
Users with ‘edit’ permissions will now be able to view & edit the chart
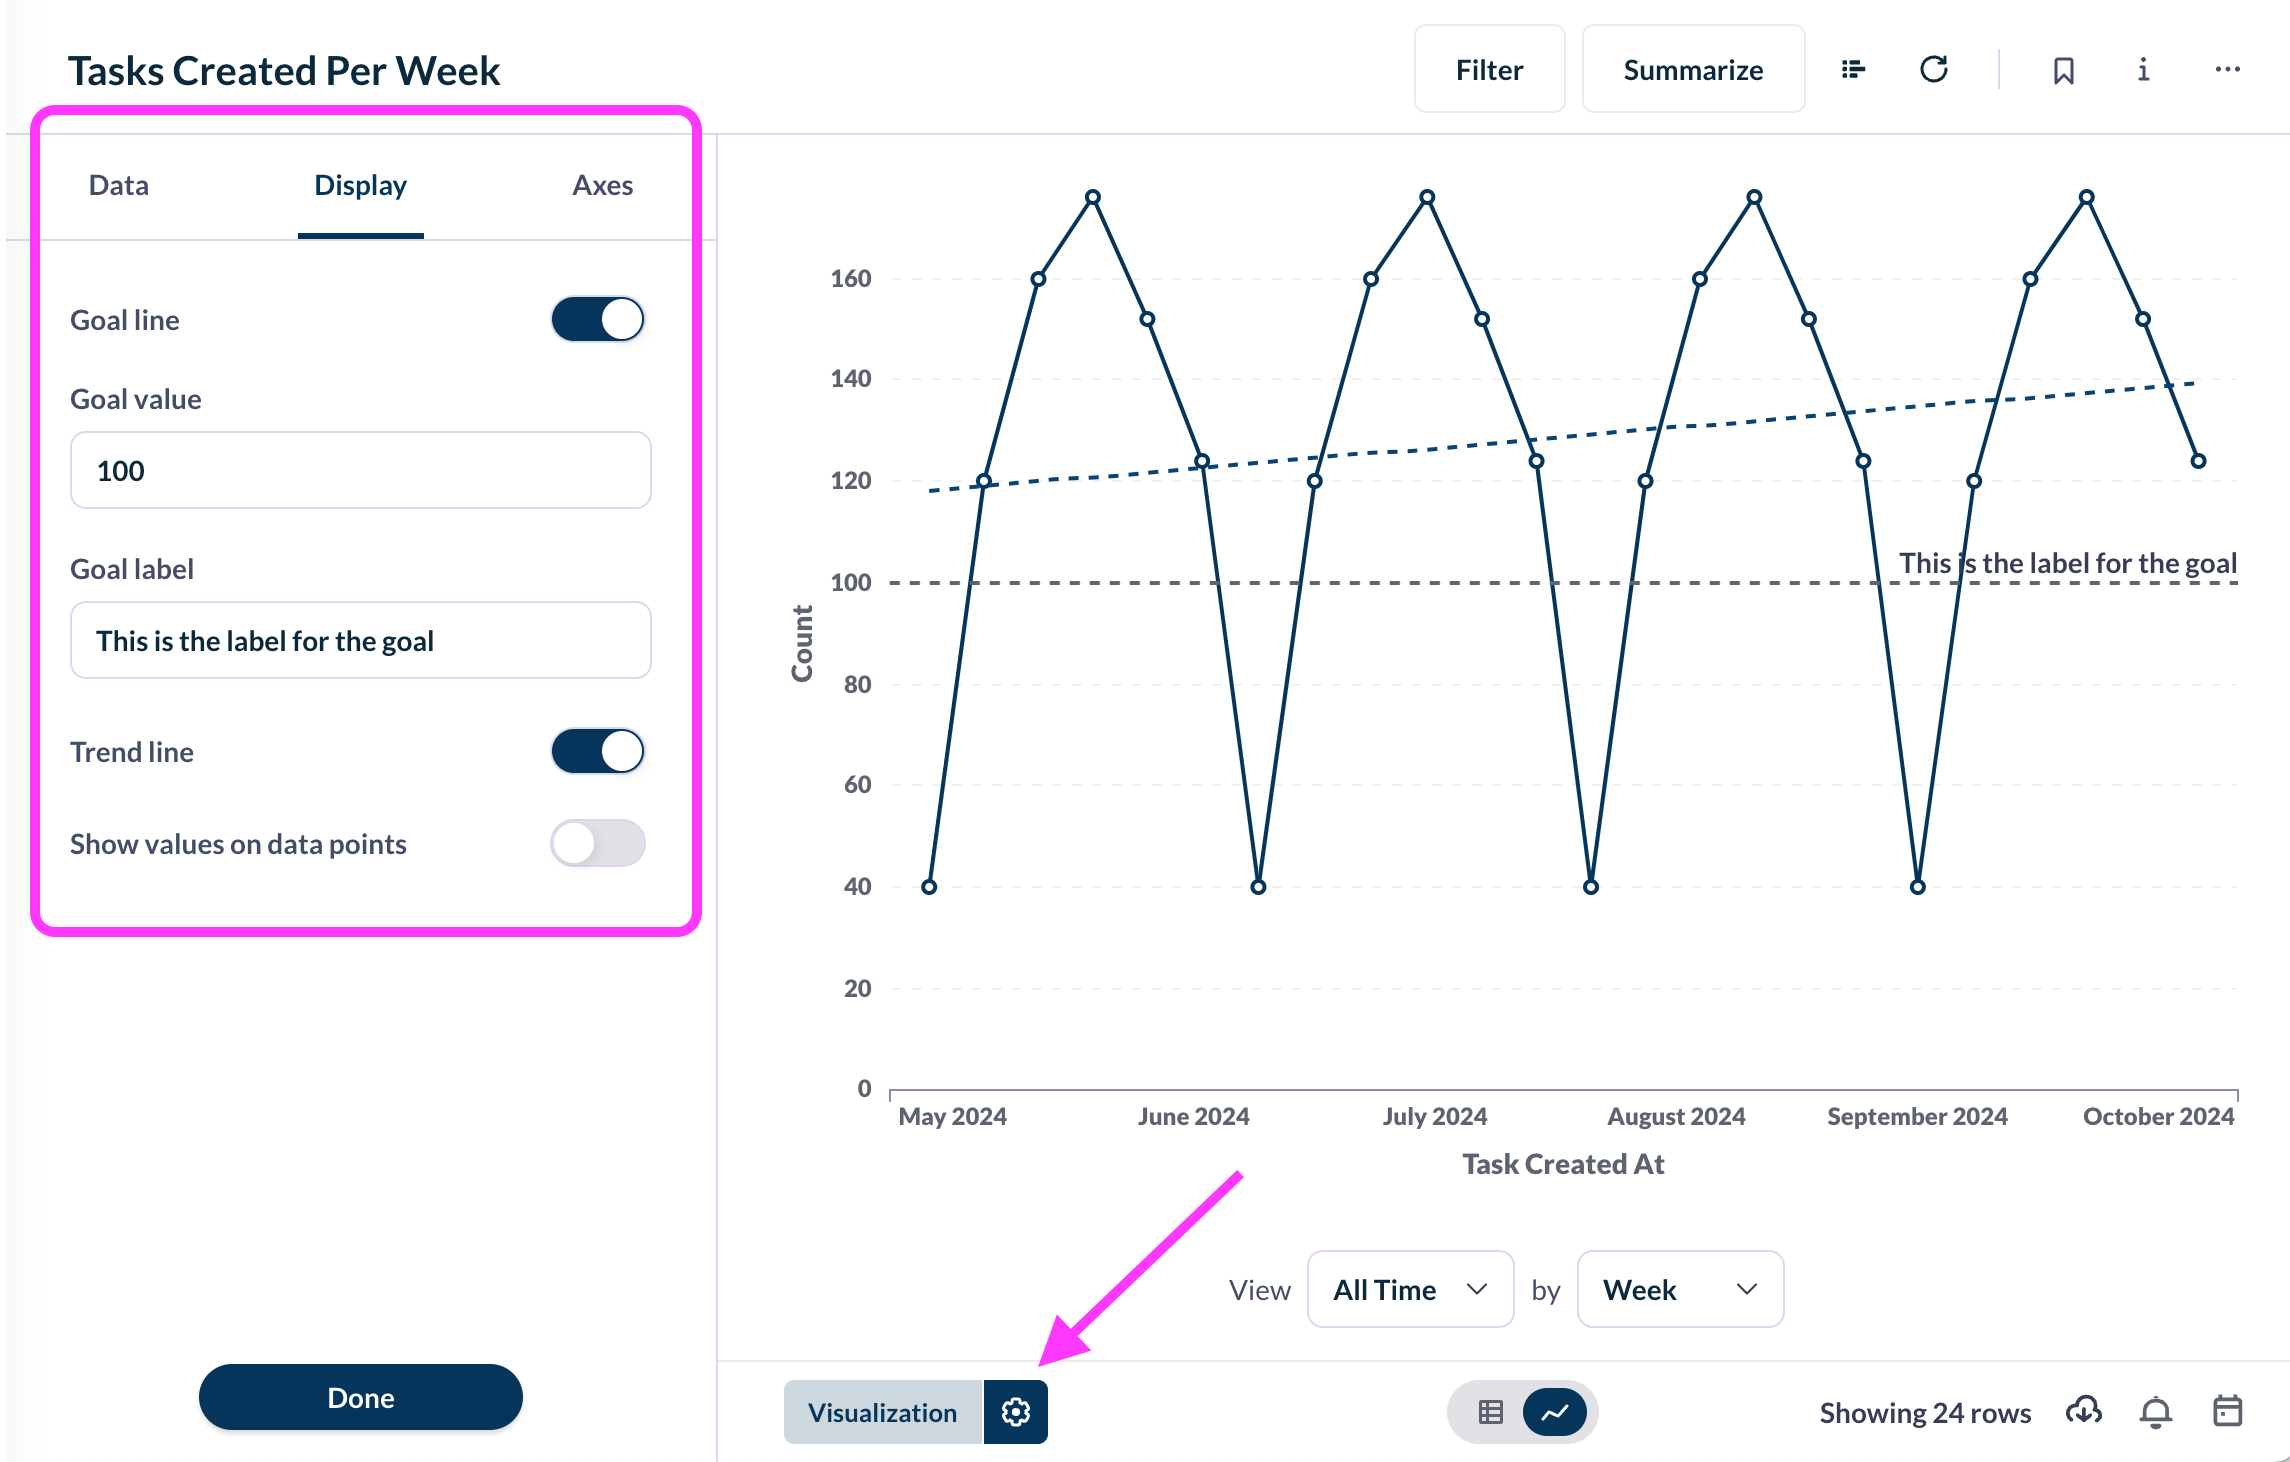
How can I add a goal line or trend line to a chart?
To add a goal line to a chart:
- Click on Visualization Settings at the bottom of the screen
- Make sure you are on the Display tab
- You can toggle on a Goal line as well as set a Goal value and Goal label here
- If you are viewing a single-line chart, you will also be able to toggle on a Trend line
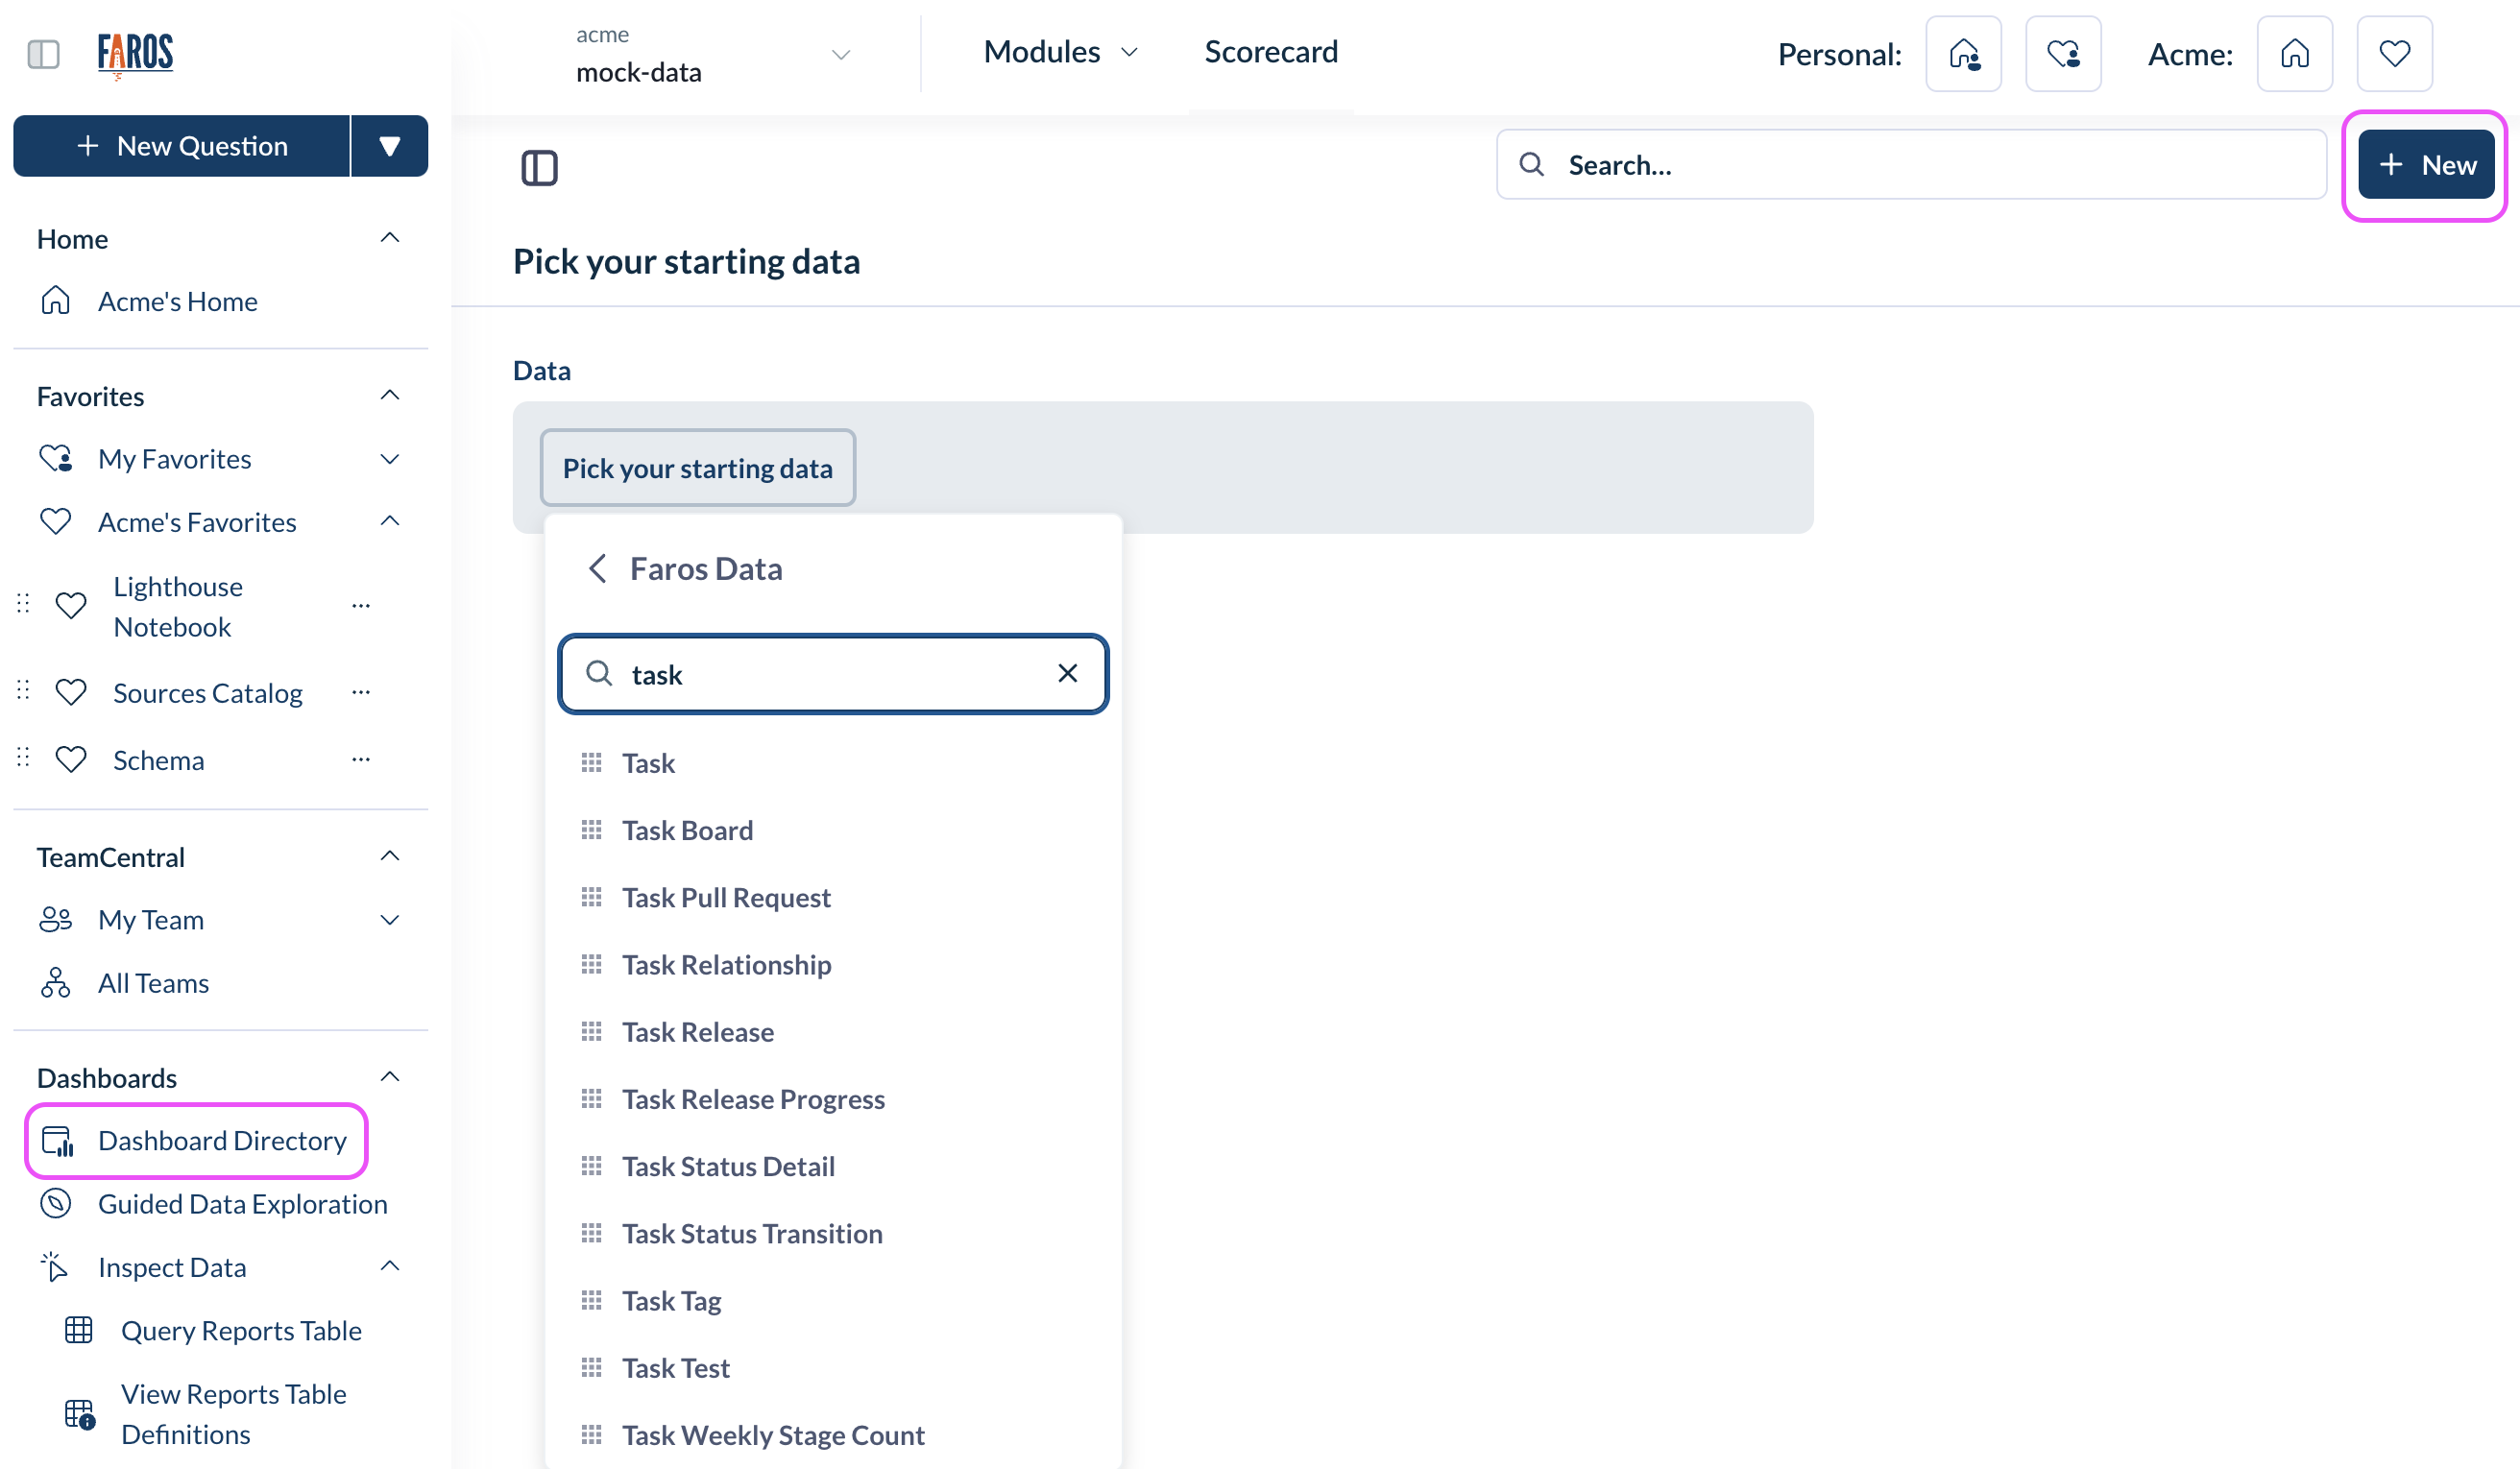
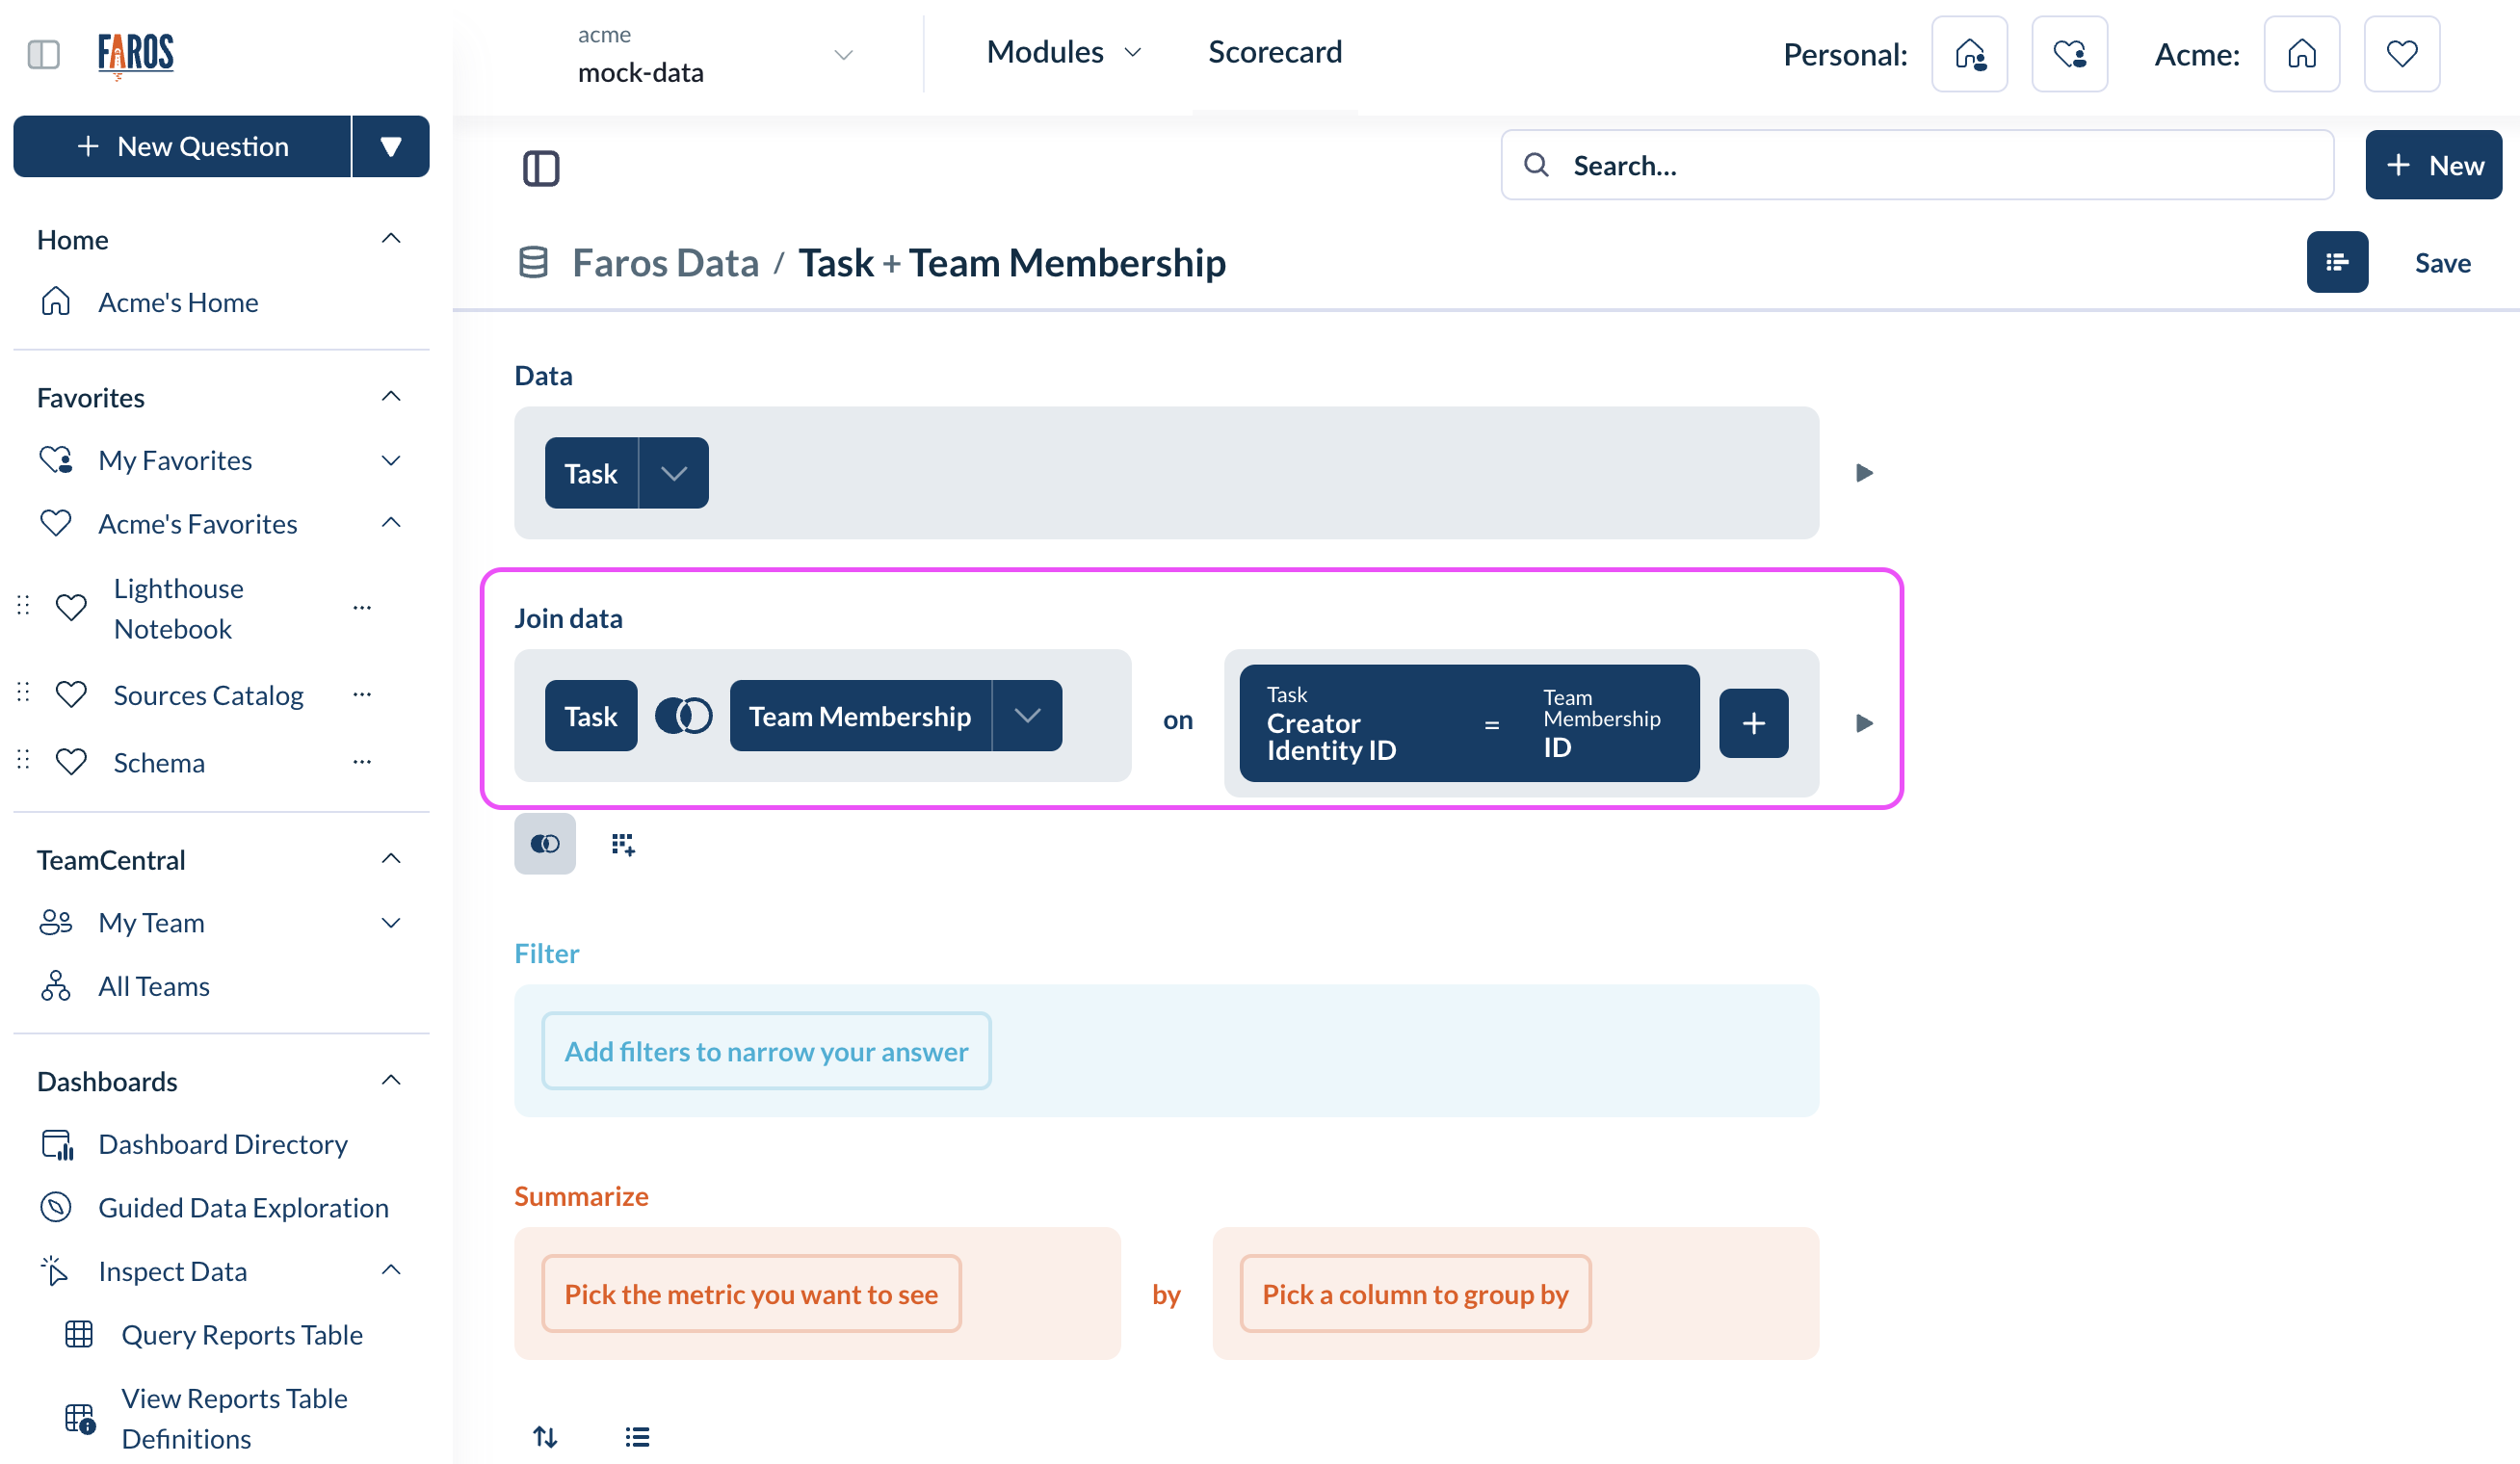
How do I join multiple tables?
To create a chart (also known as a question) joining two tables, go to Dashboards > Dashboard Directory, click on the + New button in the upper right corner, and select Question.
Pick your starting data and first table.
Click the Join button
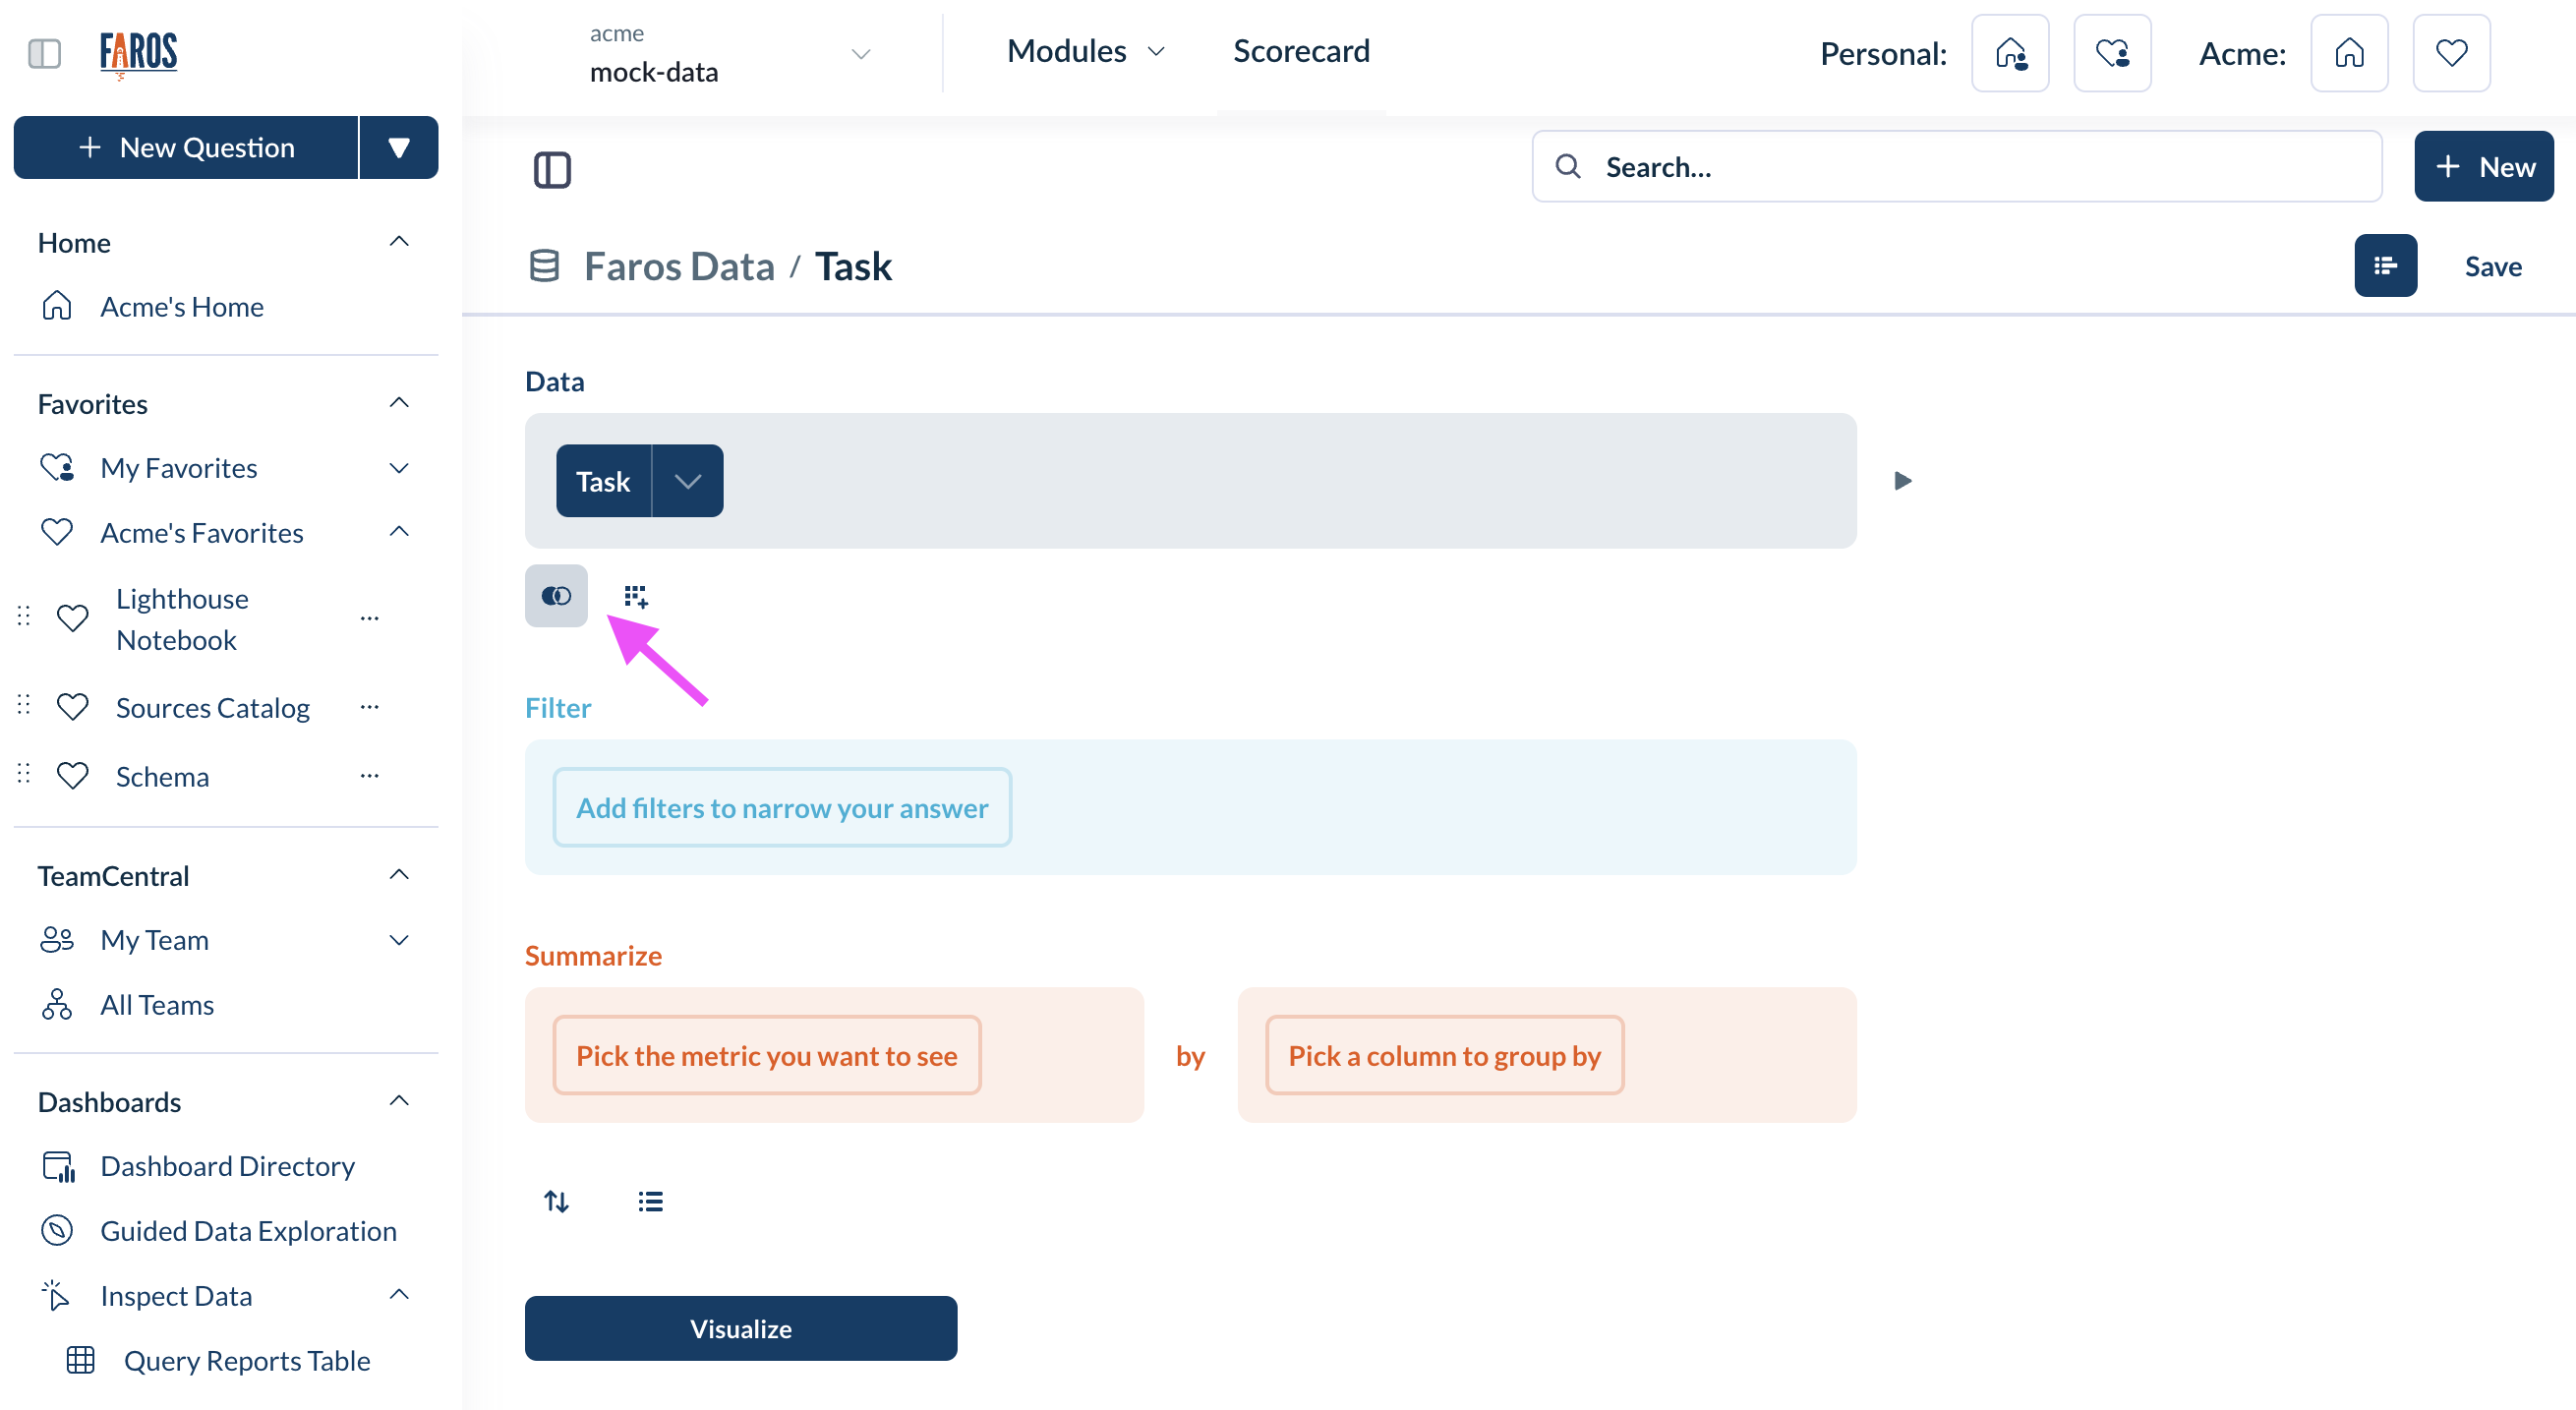
Select your second table. For many tables, the table relationships are built in and you will see the table relationship pre-defined for you.
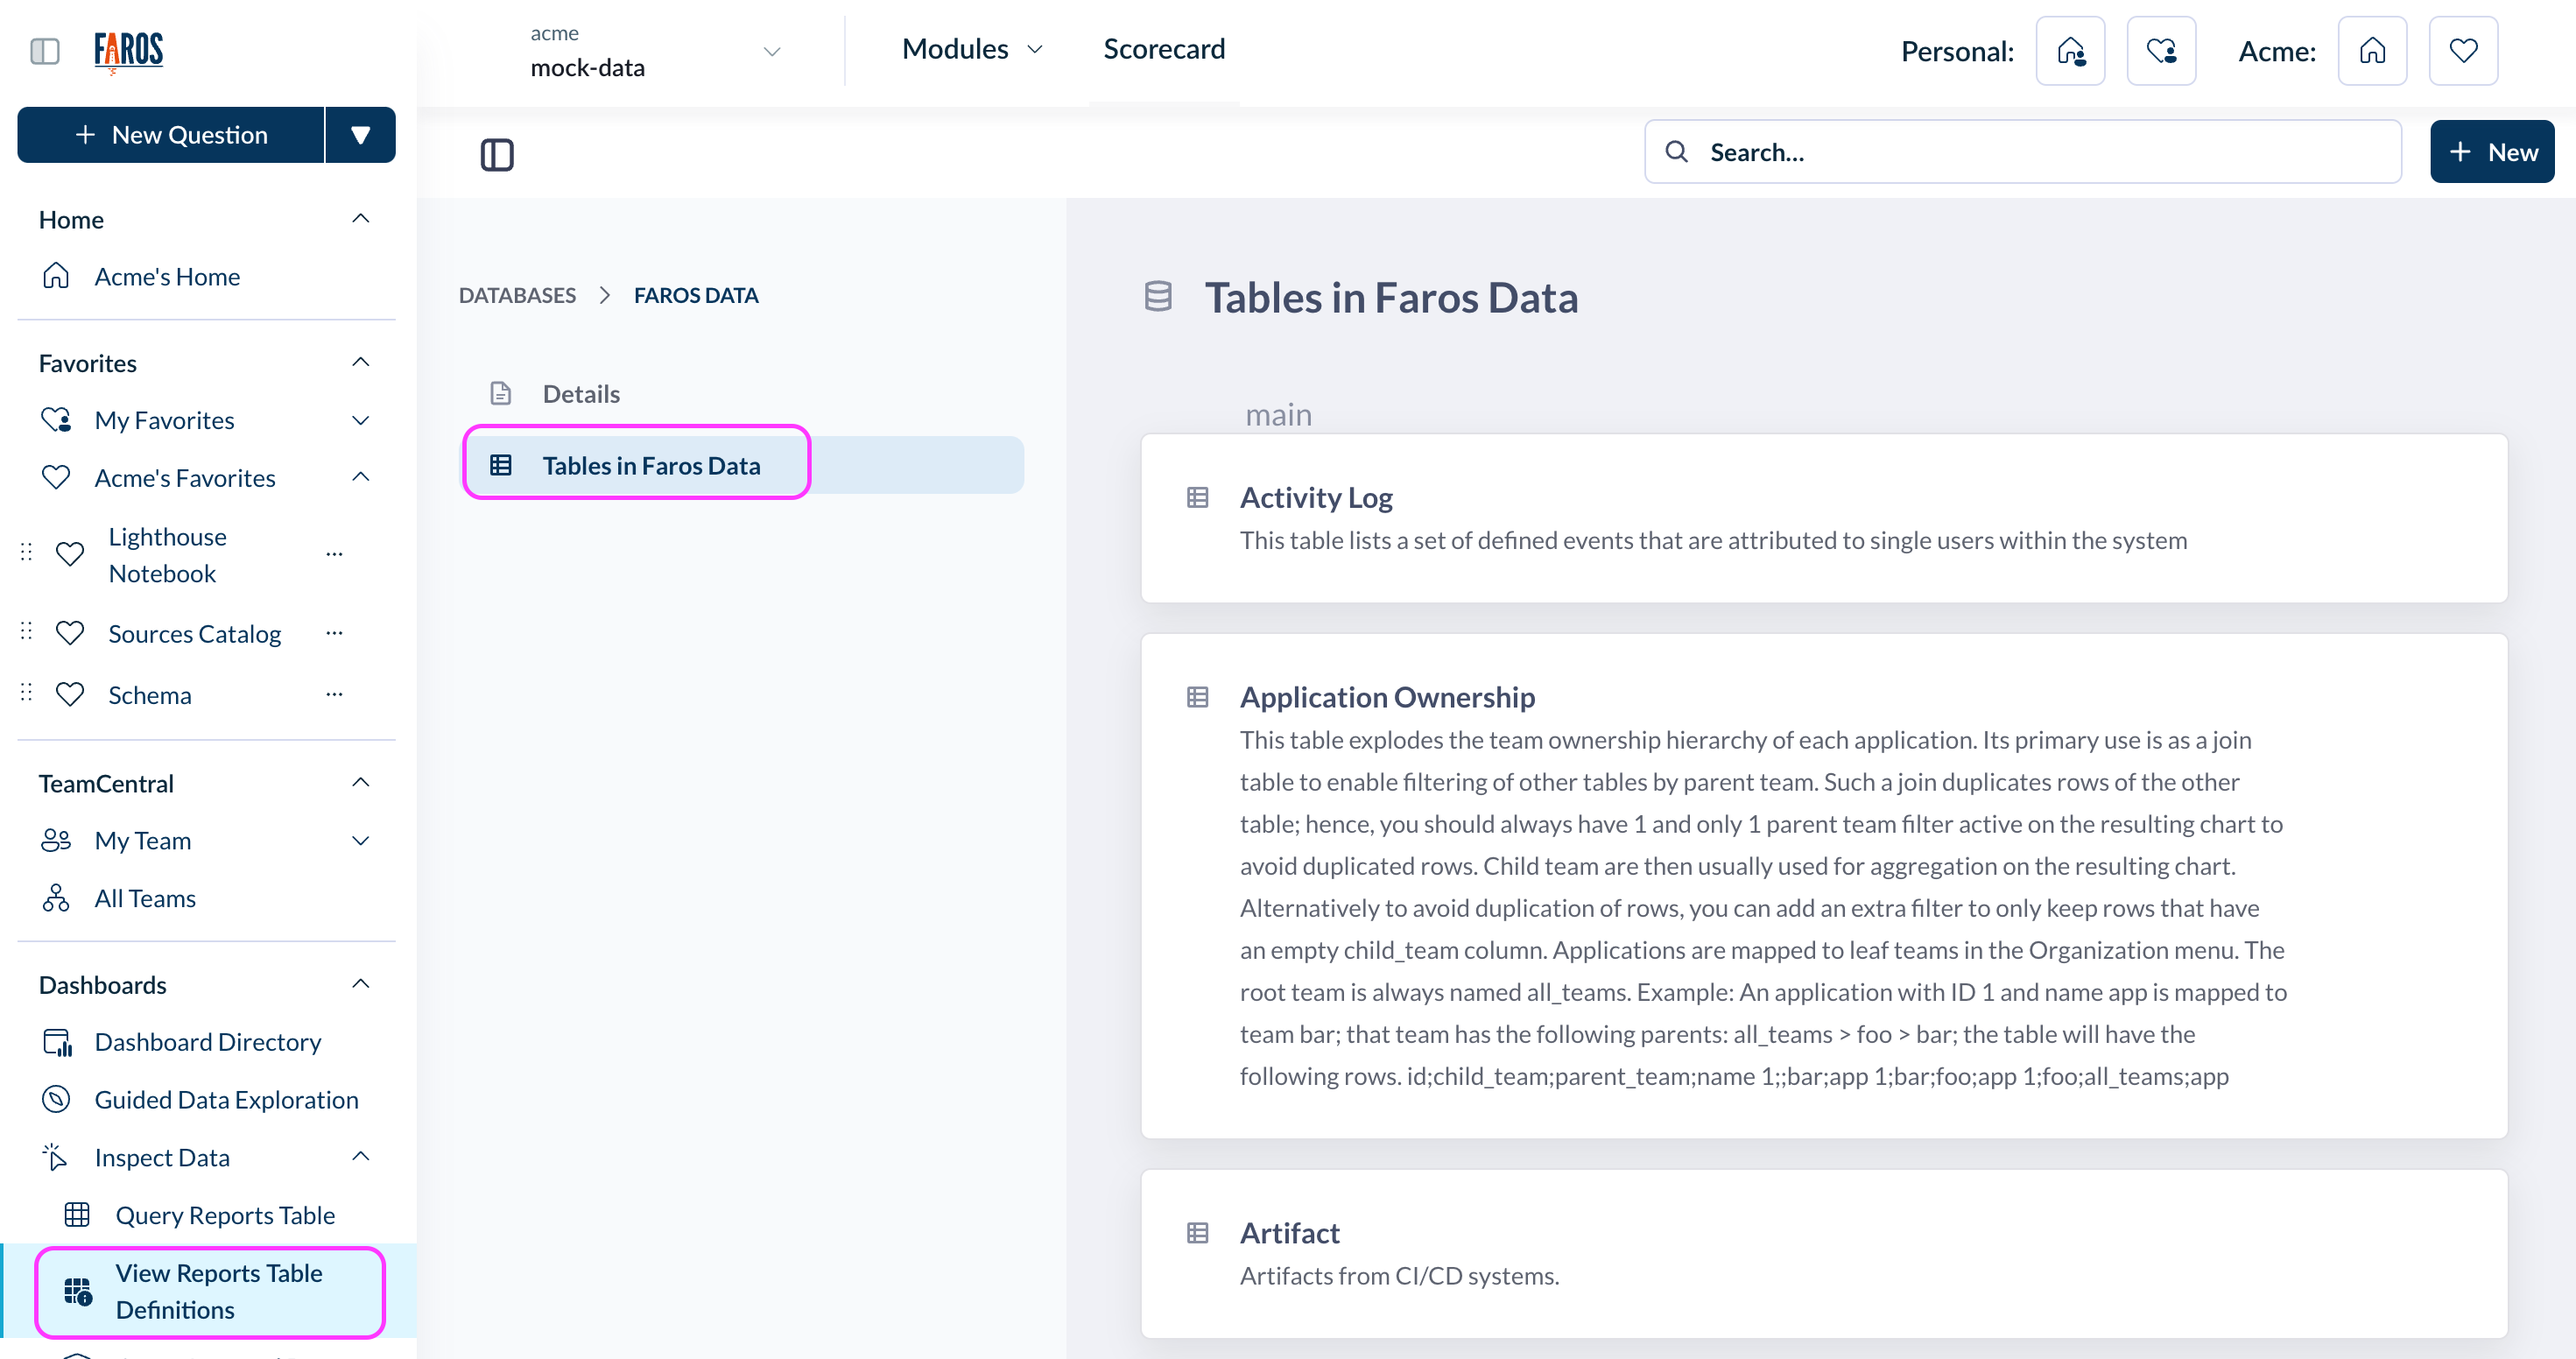
If the table relationship is not built in, you can go to Dashboards > View Reports Table Definitions to find guidance on table relationships. Under Tables in Faros Data, select the table you are interested in (for example, task).
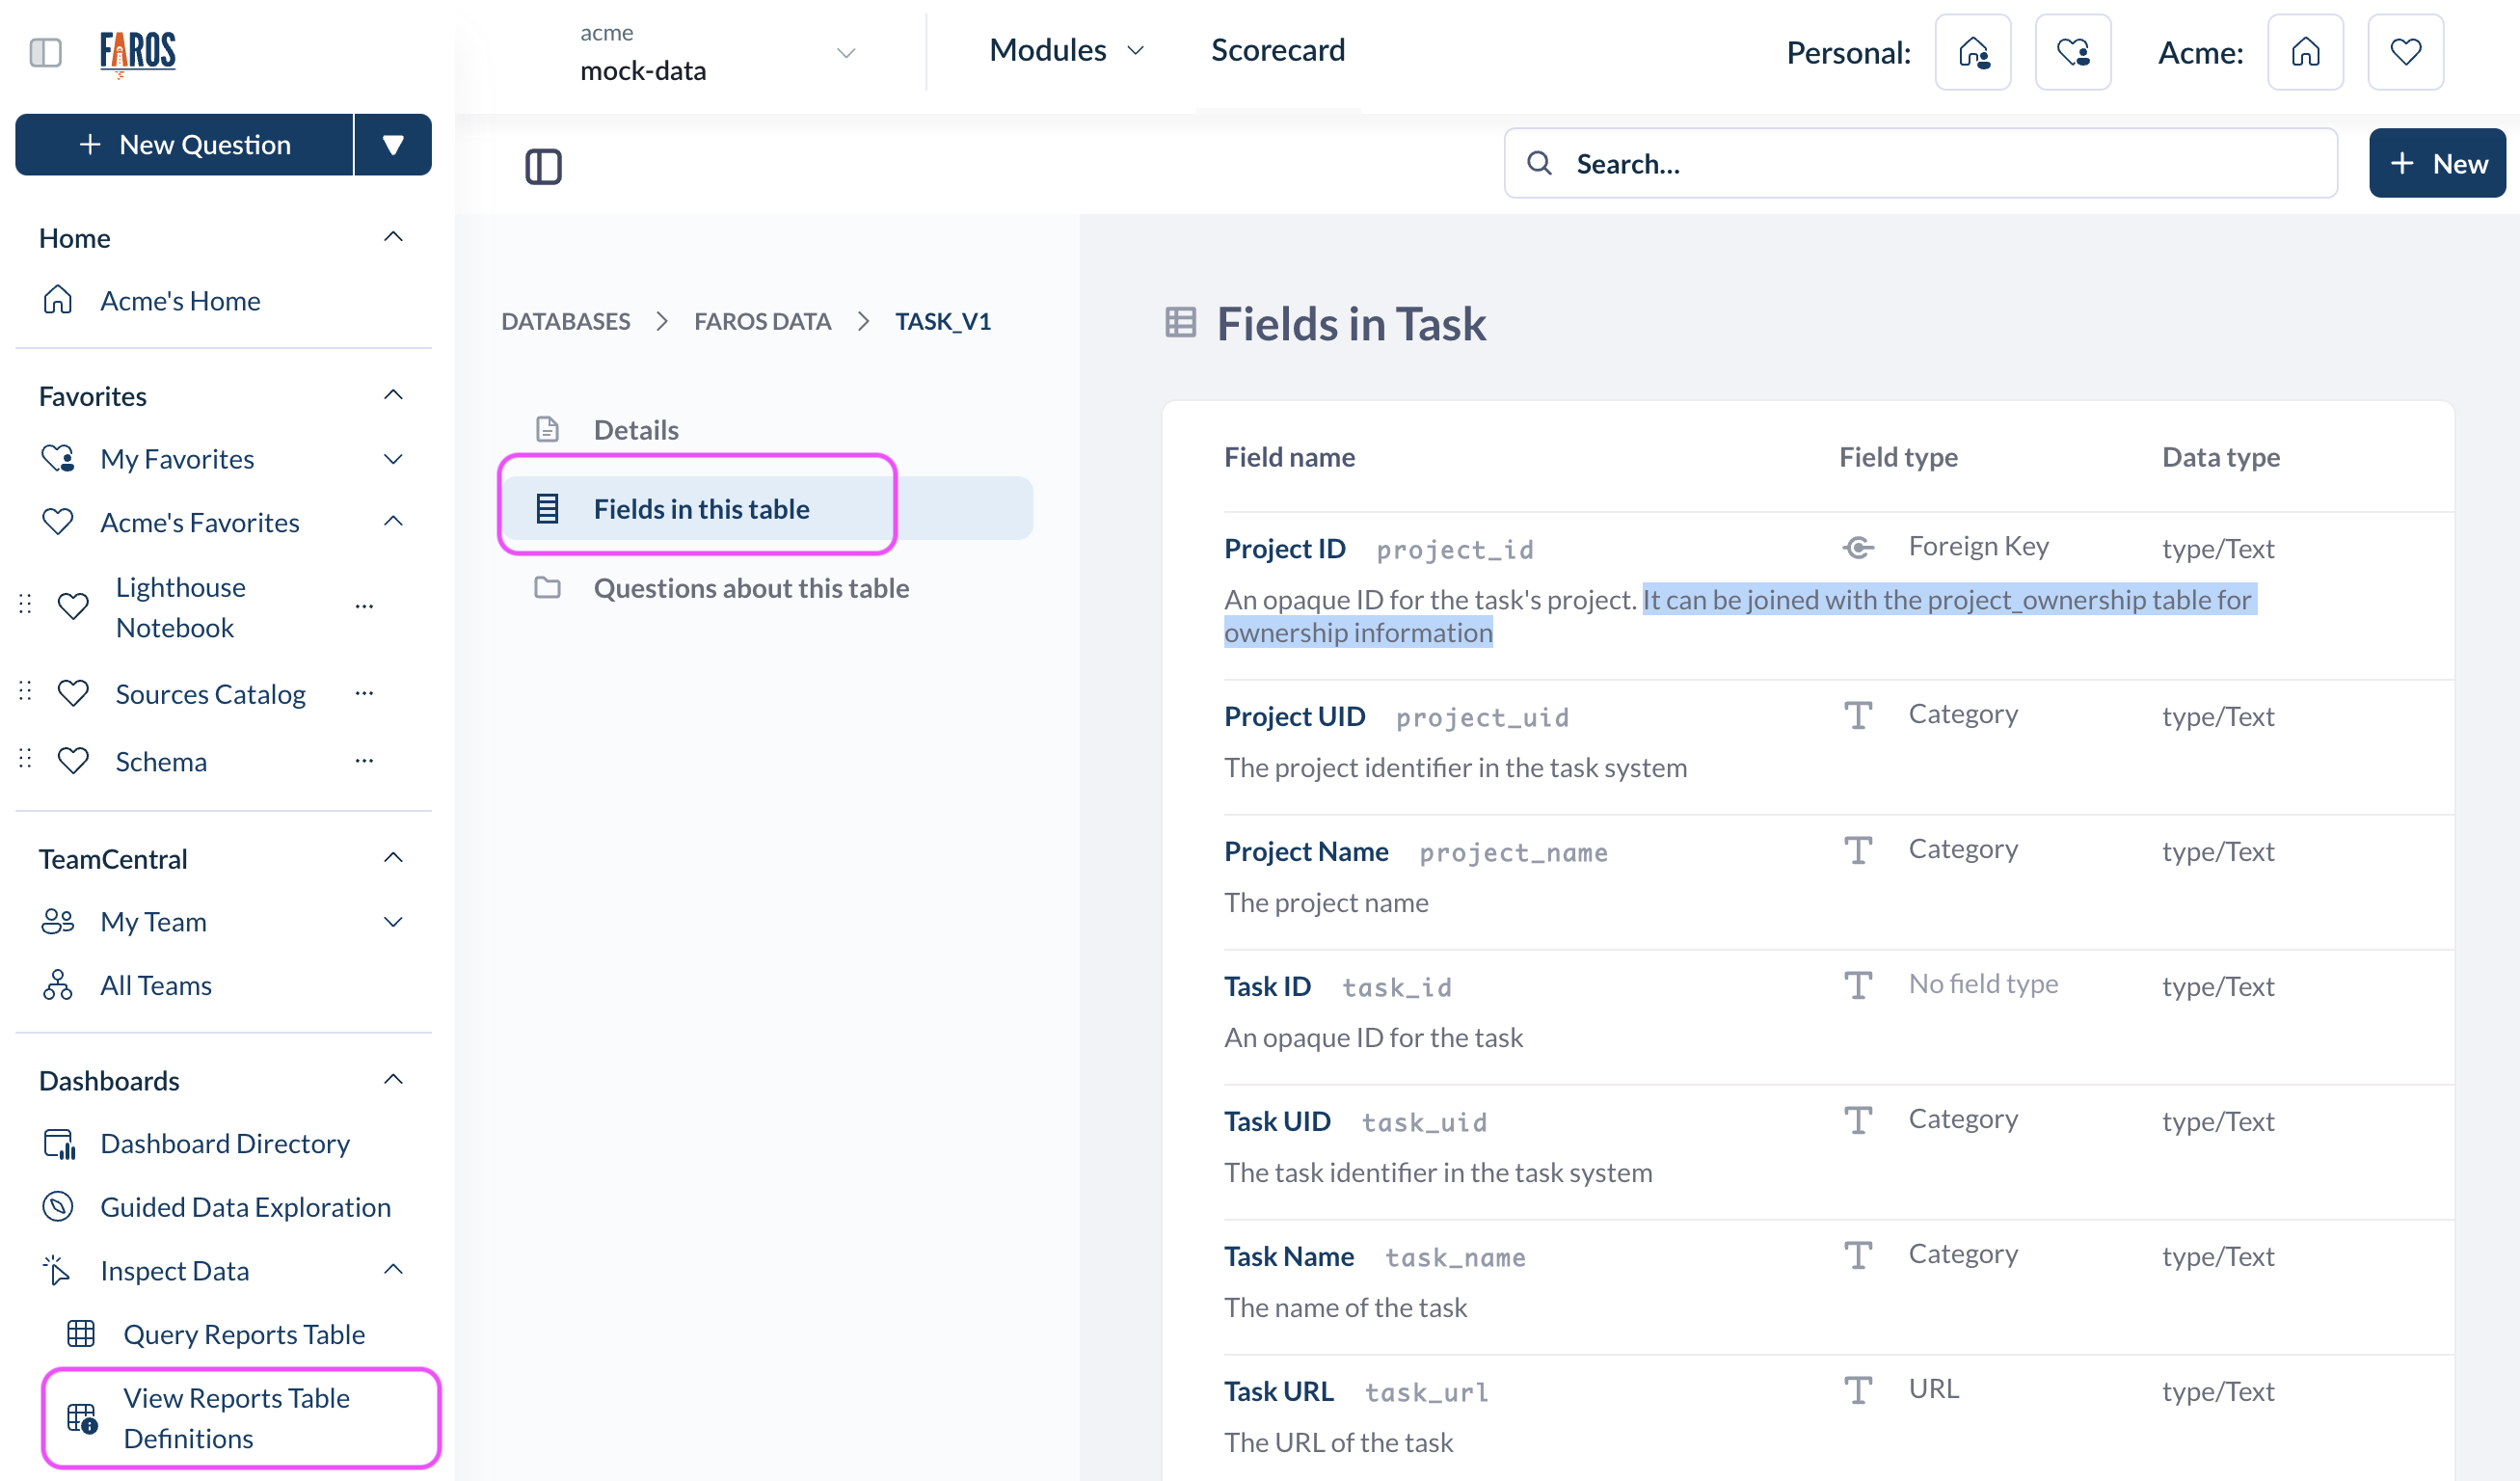
After selecting a table, click on Fields in this table. Here you can find guidance on which tables and fields can be joined.
Updated 4 months ago