
Custom Dashboards
Custom dashboards allow you to dive deeper into your data and build your own insights. You can do something as simple as adding a filter to a pre-built dashboard, or build an entirely new dashboard based on new custom metrics you've created.
Navigation
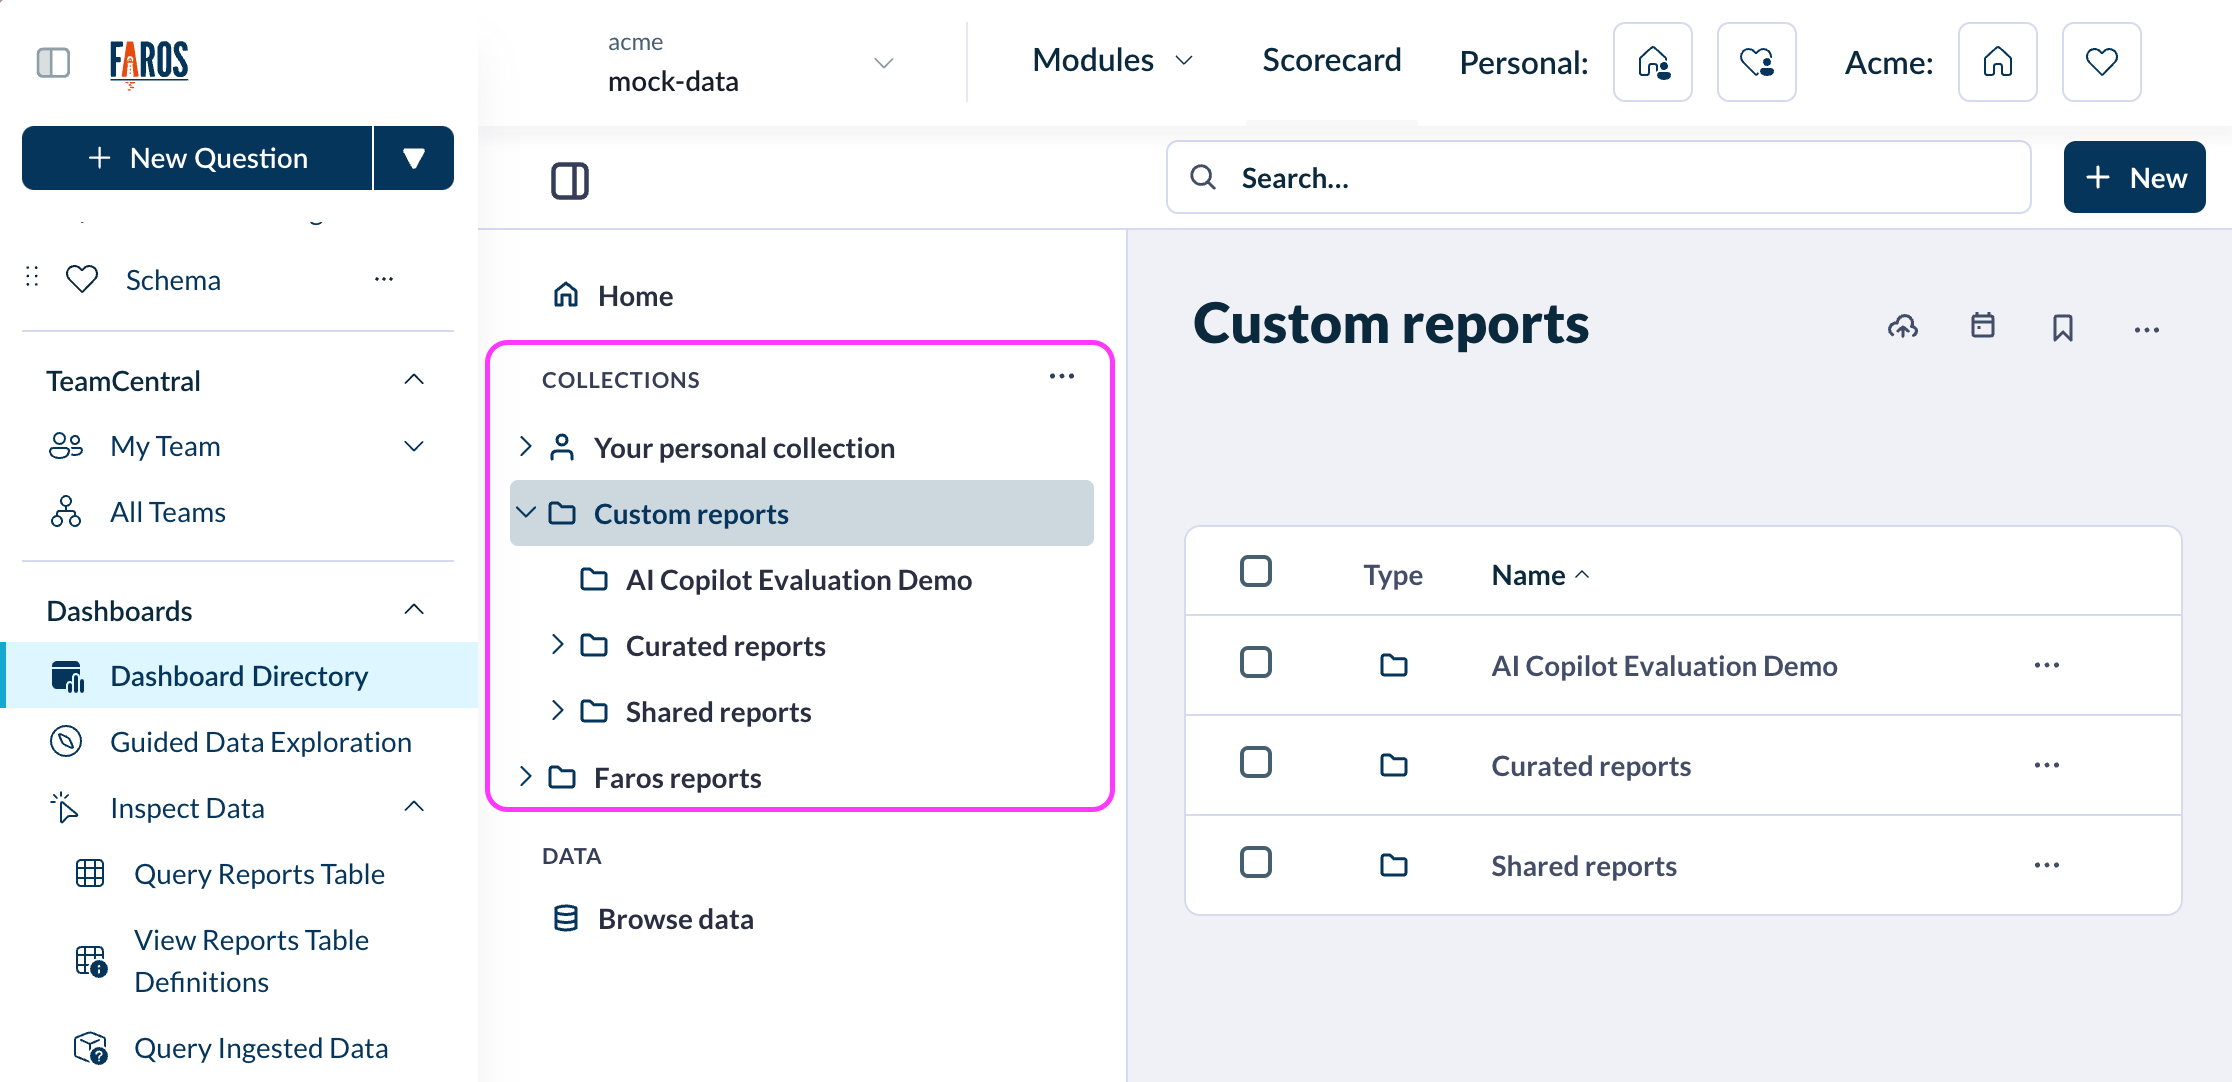
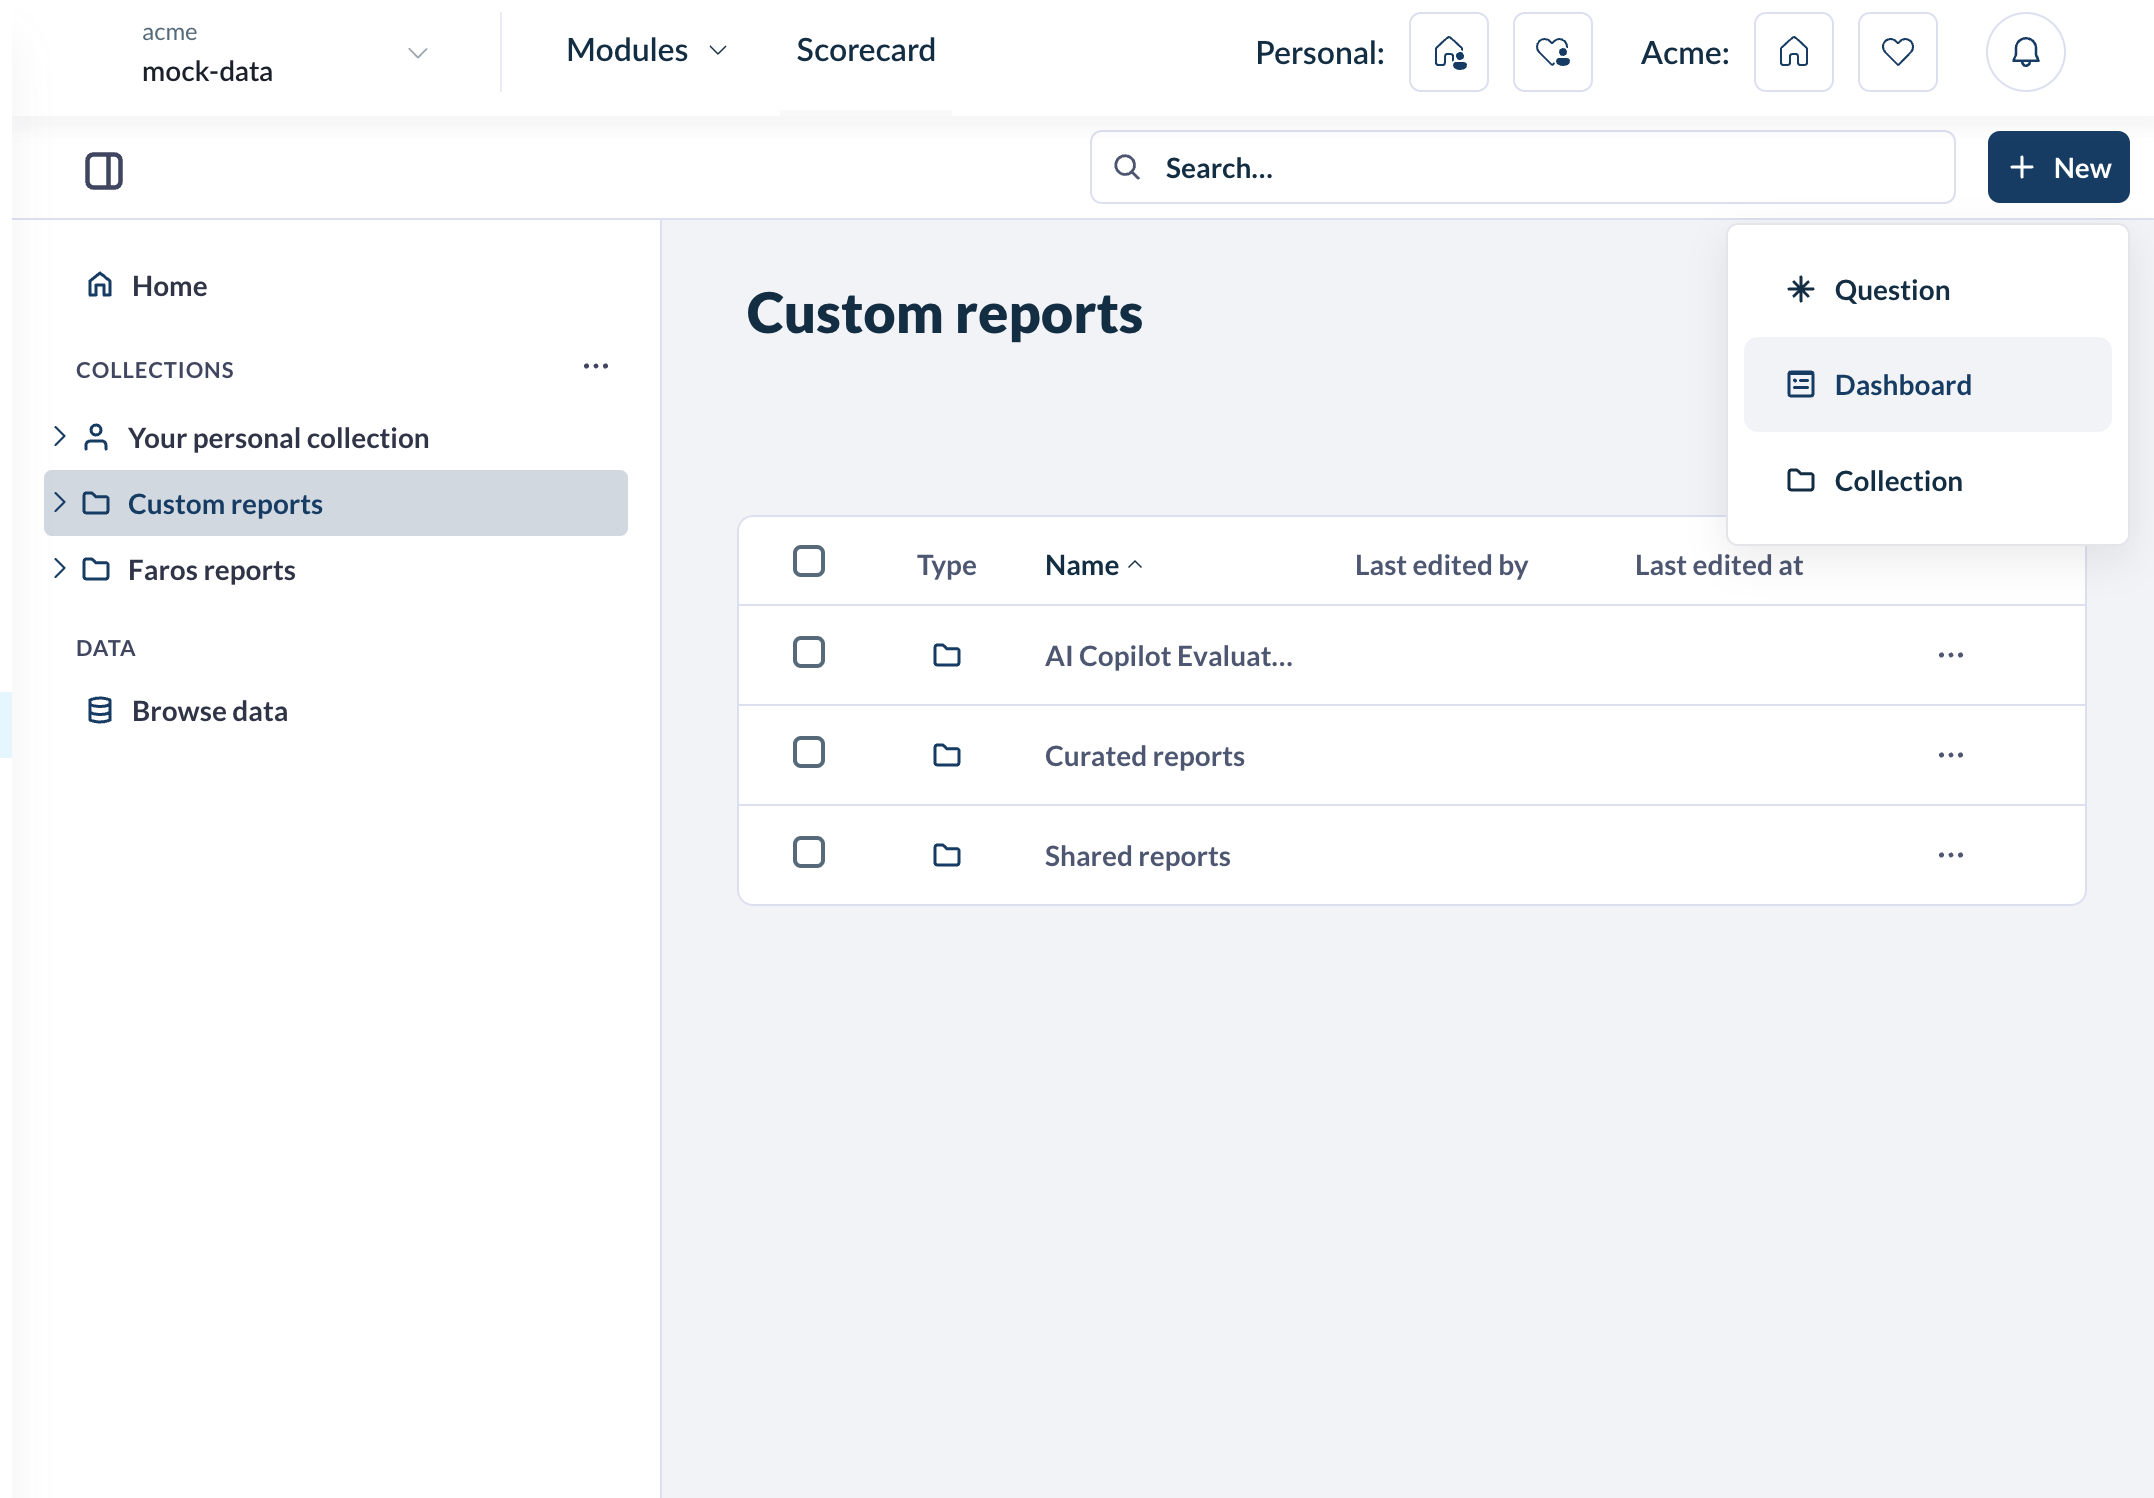
To view custom dashboards, click on Dashboards > Dashboard Directory. Here you will see:
- Your personal collection: Charts and dashboards that are only visible to you.
- Custom reports > Curated reports: By default, these charts and dashboards are editable by admins and owners and viewable by the rest of your organization (but your org may have different permissions configured).
- Custom reports > Shared reports: Charts and dashboards that can be viewed and edited by multiple users (depending on their Faros AI user role).
- Faros reports: Pre-built charts and dashboards.
Creating Charts
Modifying an Existing Chart
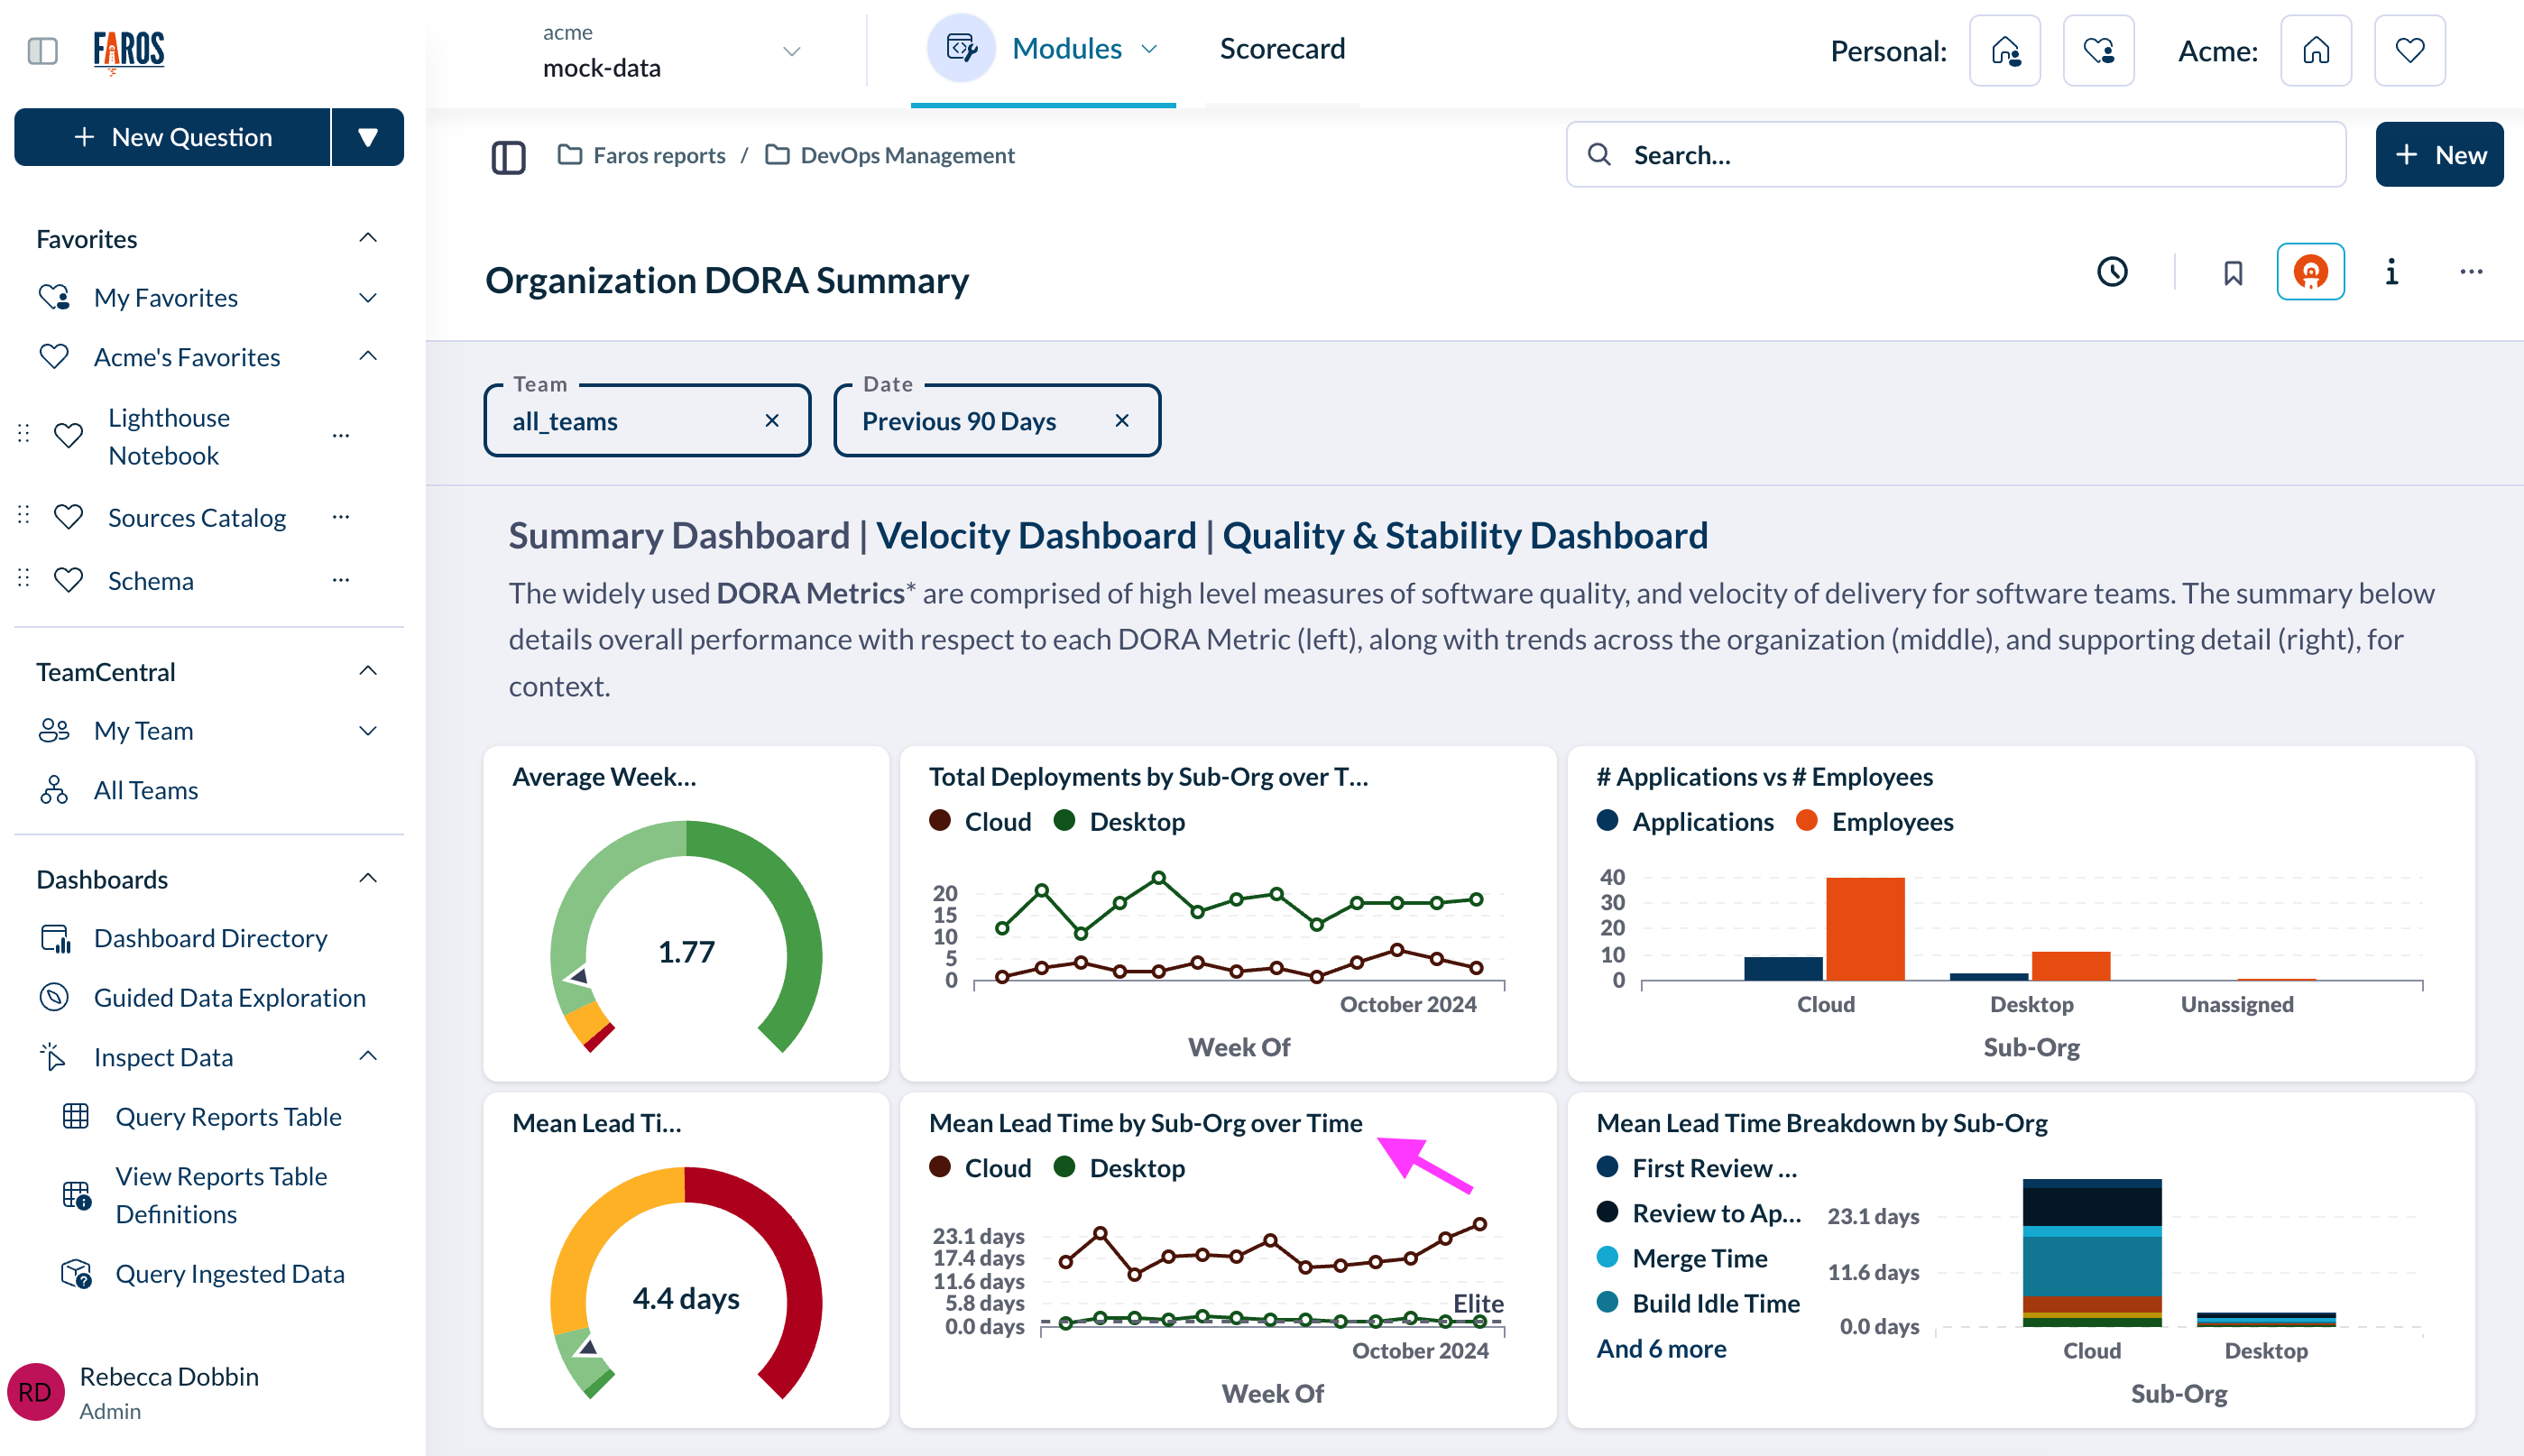
We recommend starting here when building new charts. Leveraging an existing chart is a great way to familiarize yourself with the data and format of charts (also called questions). To begin, click on the name of a chart from a dashboard view. This will bring up the details screen for the chart.
Add or remove filters, change the visualization settings, or make more involved changes in the editor view. Your resulting card can be as similar or as different from the original as you like.
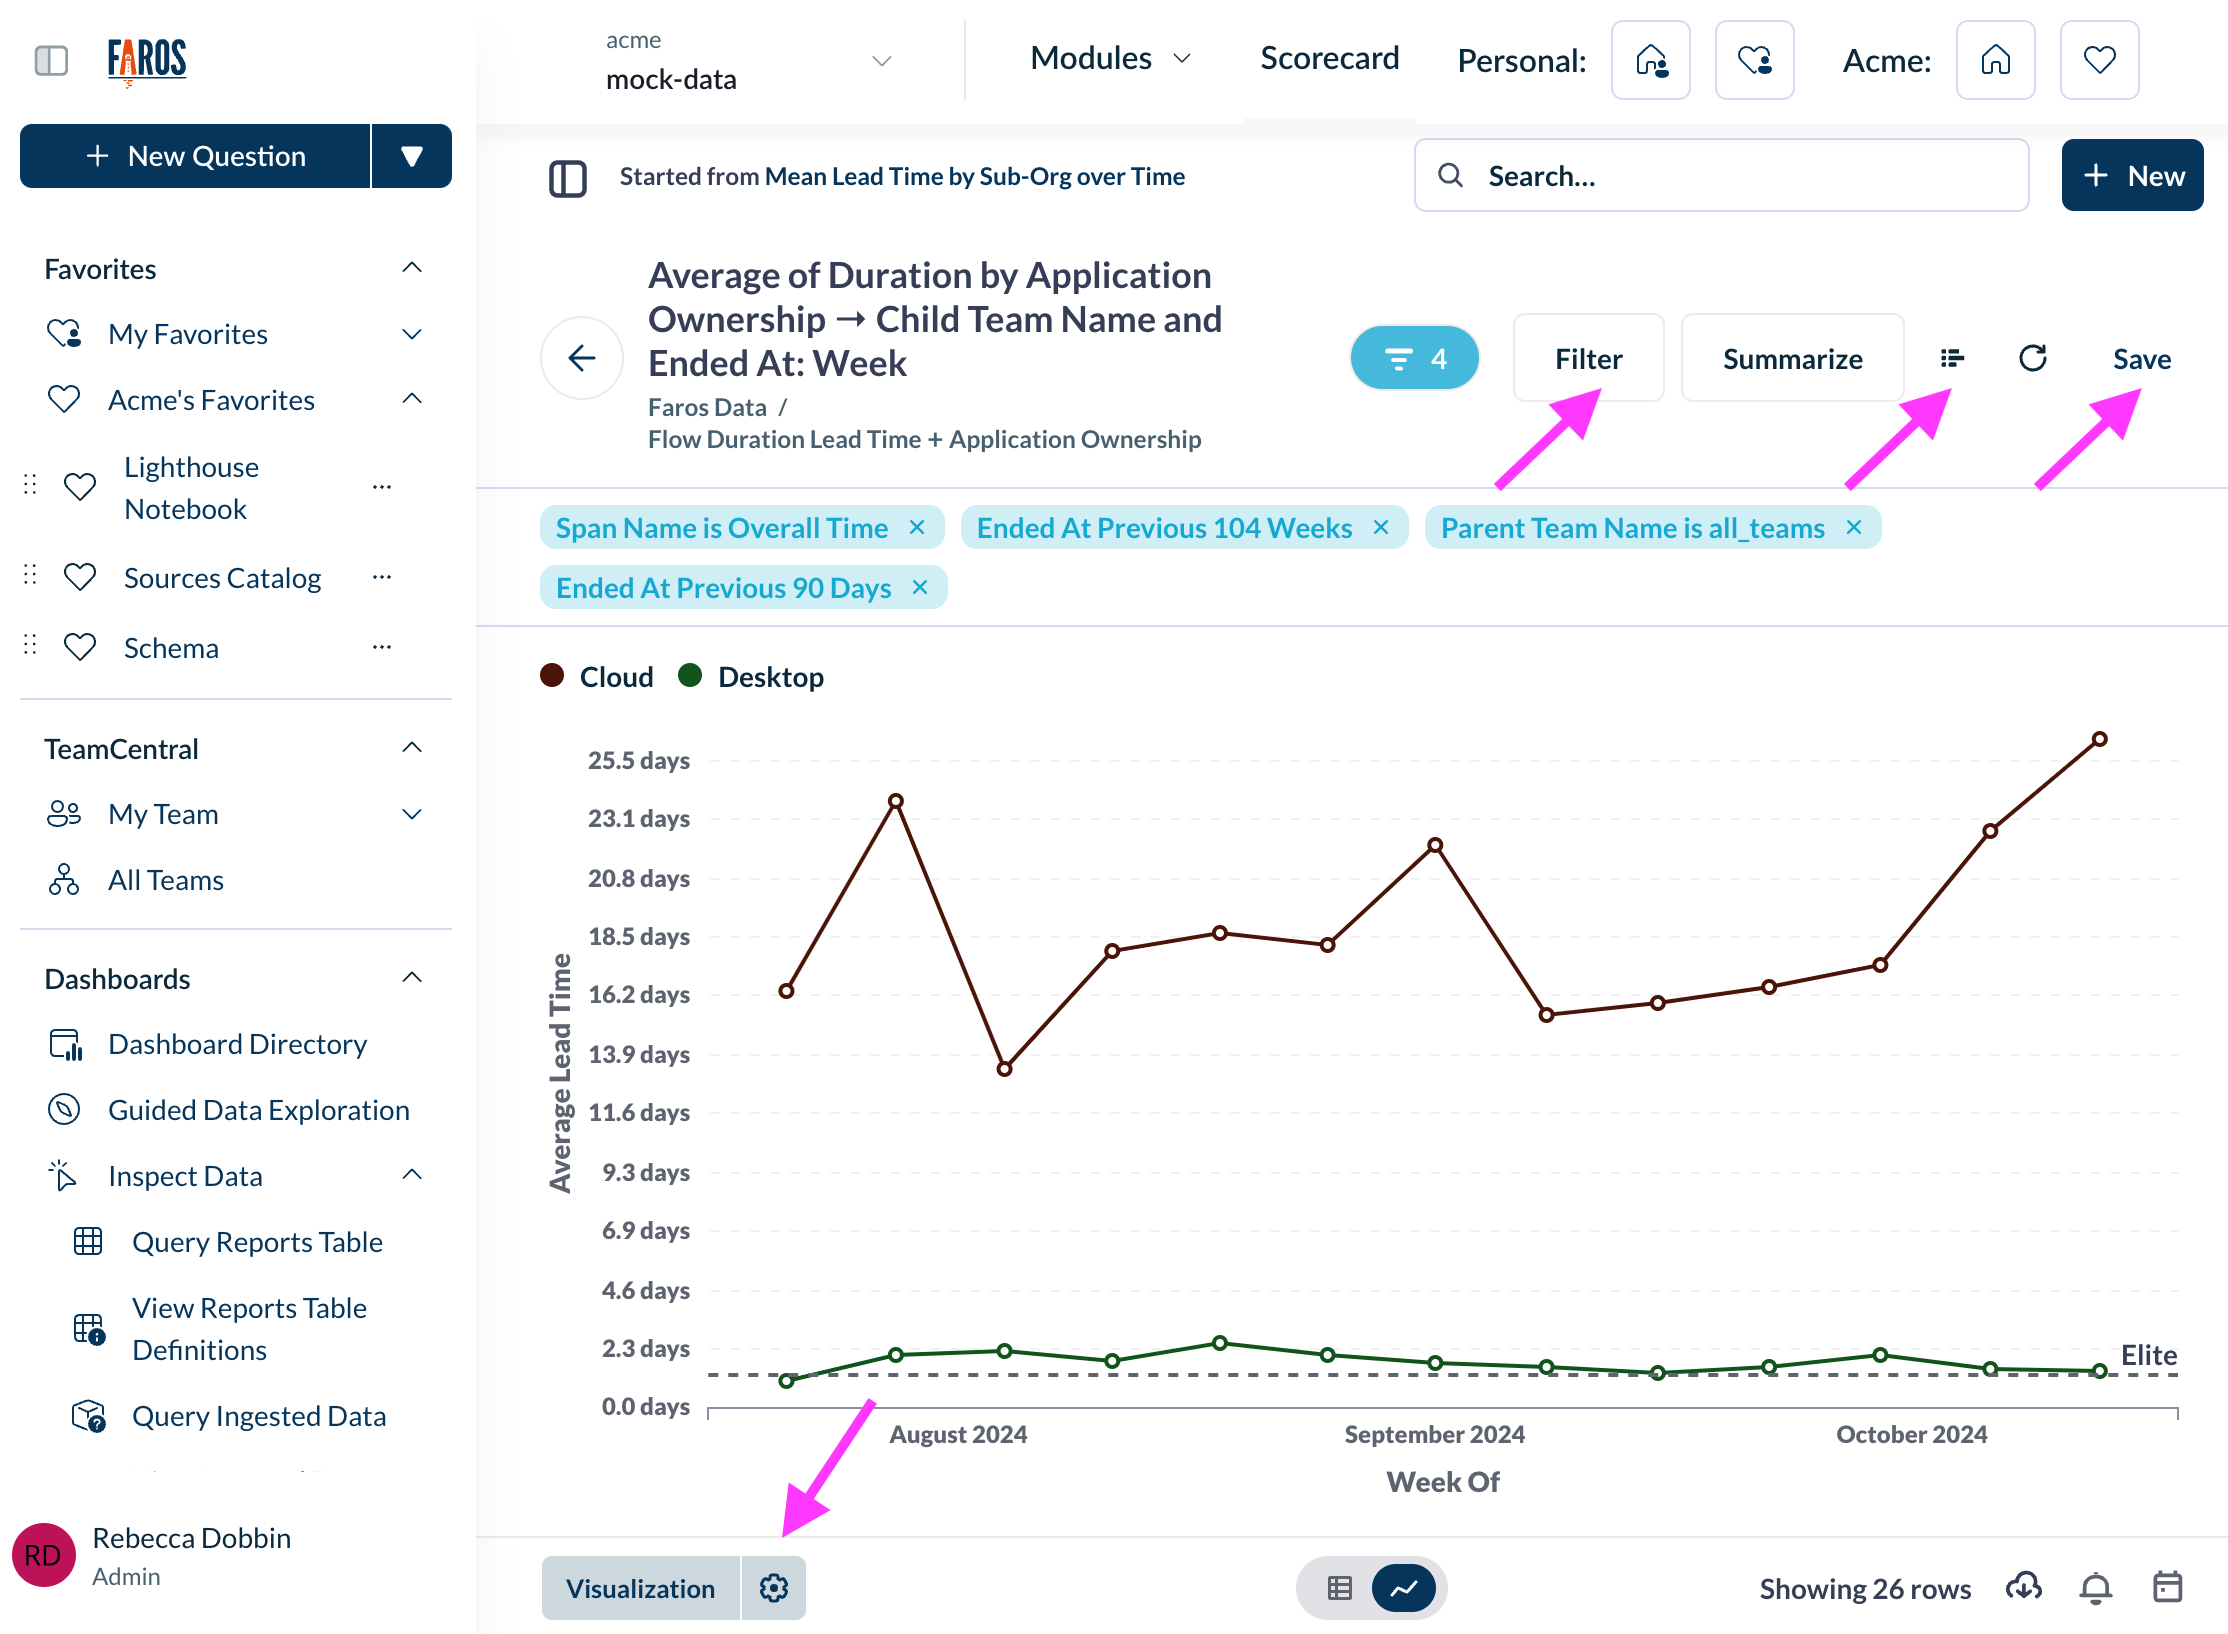
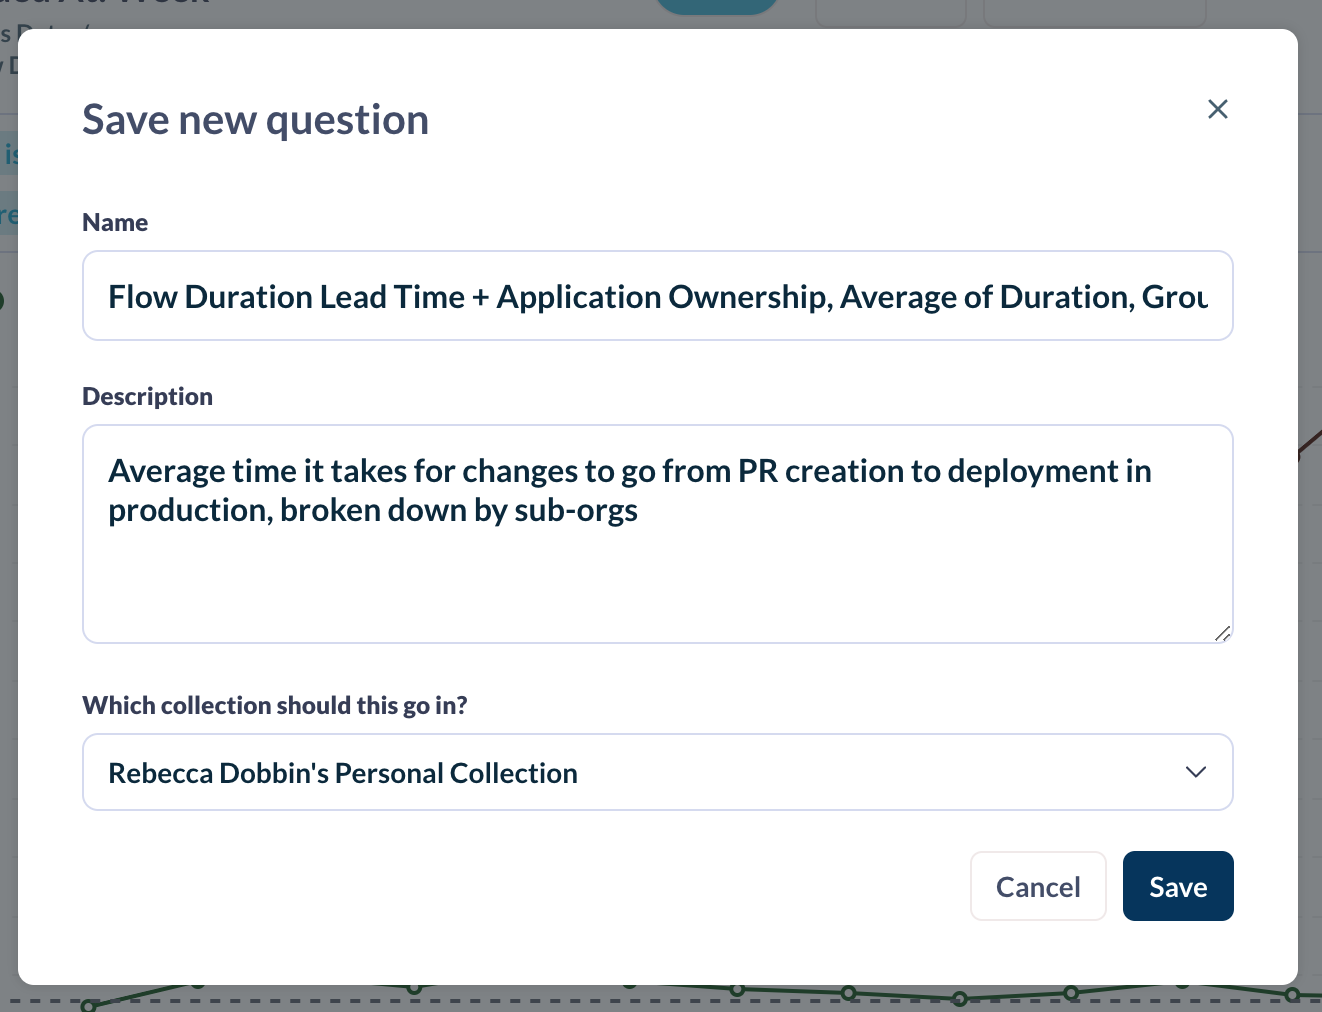
When you're happy with what you have, click Save. This will save as a new chart (it will not overwrite the existing one). You can provide a name, description, and select which folder to save the chart in.
Creating a New Chart from Scratch
Once you feel comfortable modifying existing charts, you can begin to build your own from scratch.
Go to Dashboards > Dashboard Directory and click the + New button in the upper right corner. Select Question to build a new chart.

Before you begin, you should spend some time looking at the data table references found under Dashboards > View Reports Table Definitions. These will help familiarize you with the data so you'll know what to leverage for your new chart.
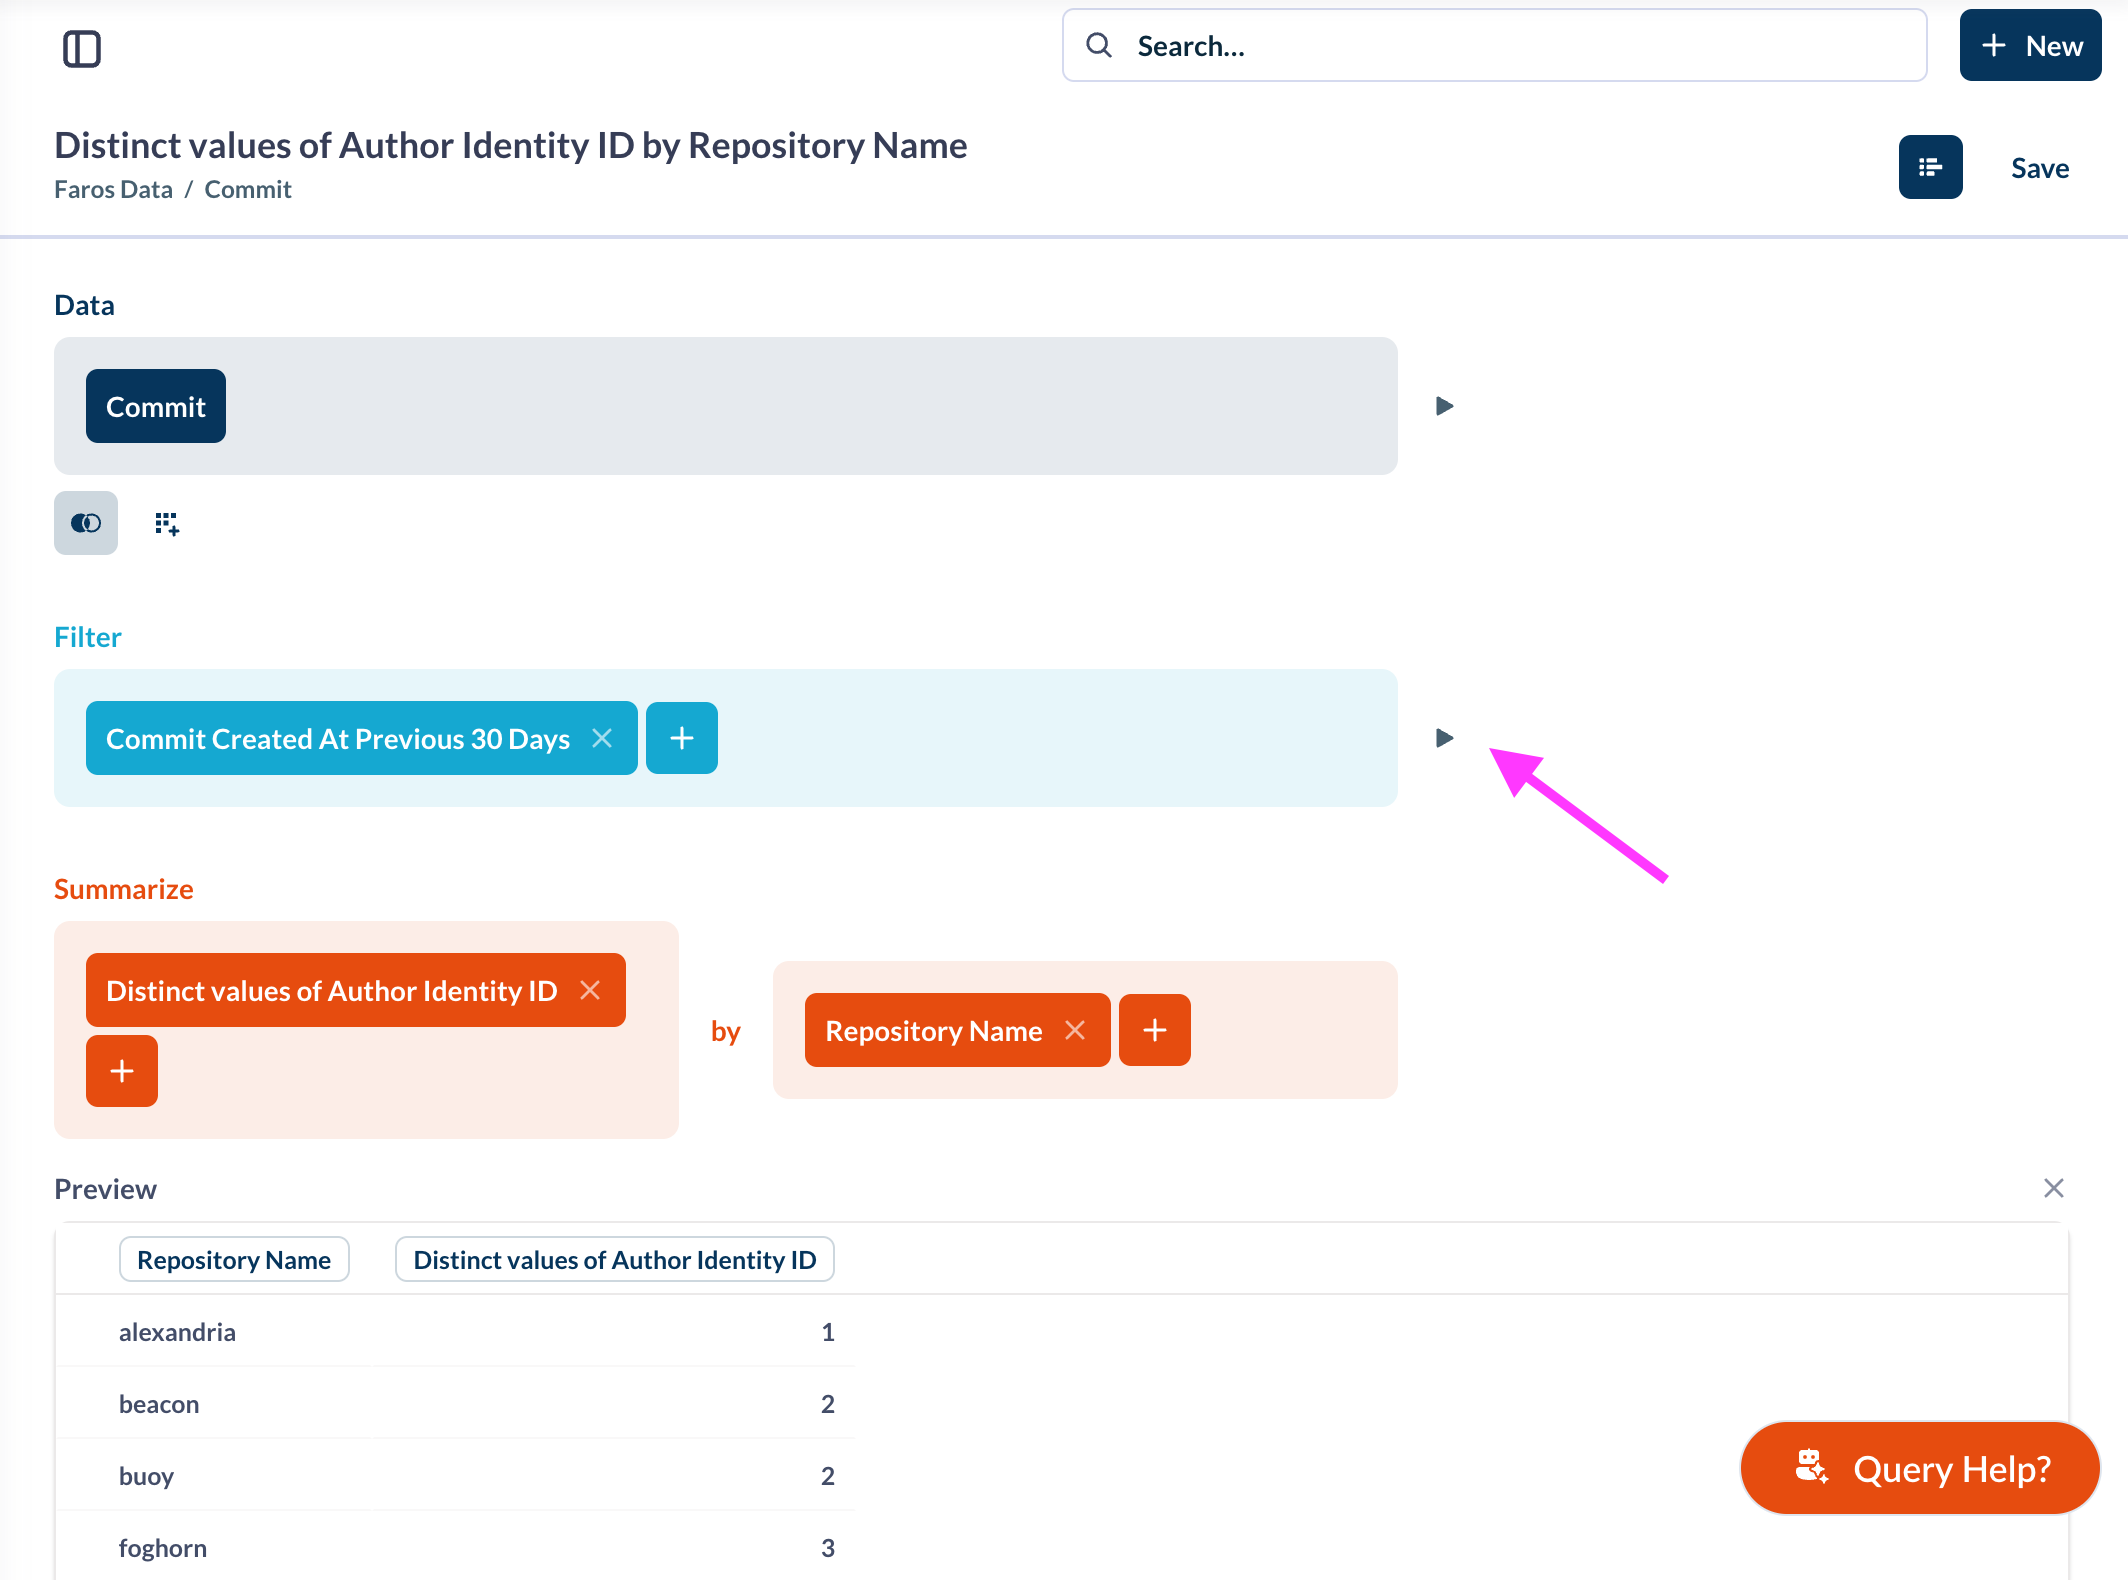
If you have any trouble filling out the UI question builder, remember you can refer to this same builder view for existing questions to see how they are created. You also can click the play button next to any of the sections in the builder. This will give you a data preview. Use this to check your various filters, summaries and group by's.
Viewing Edit History on a Chart
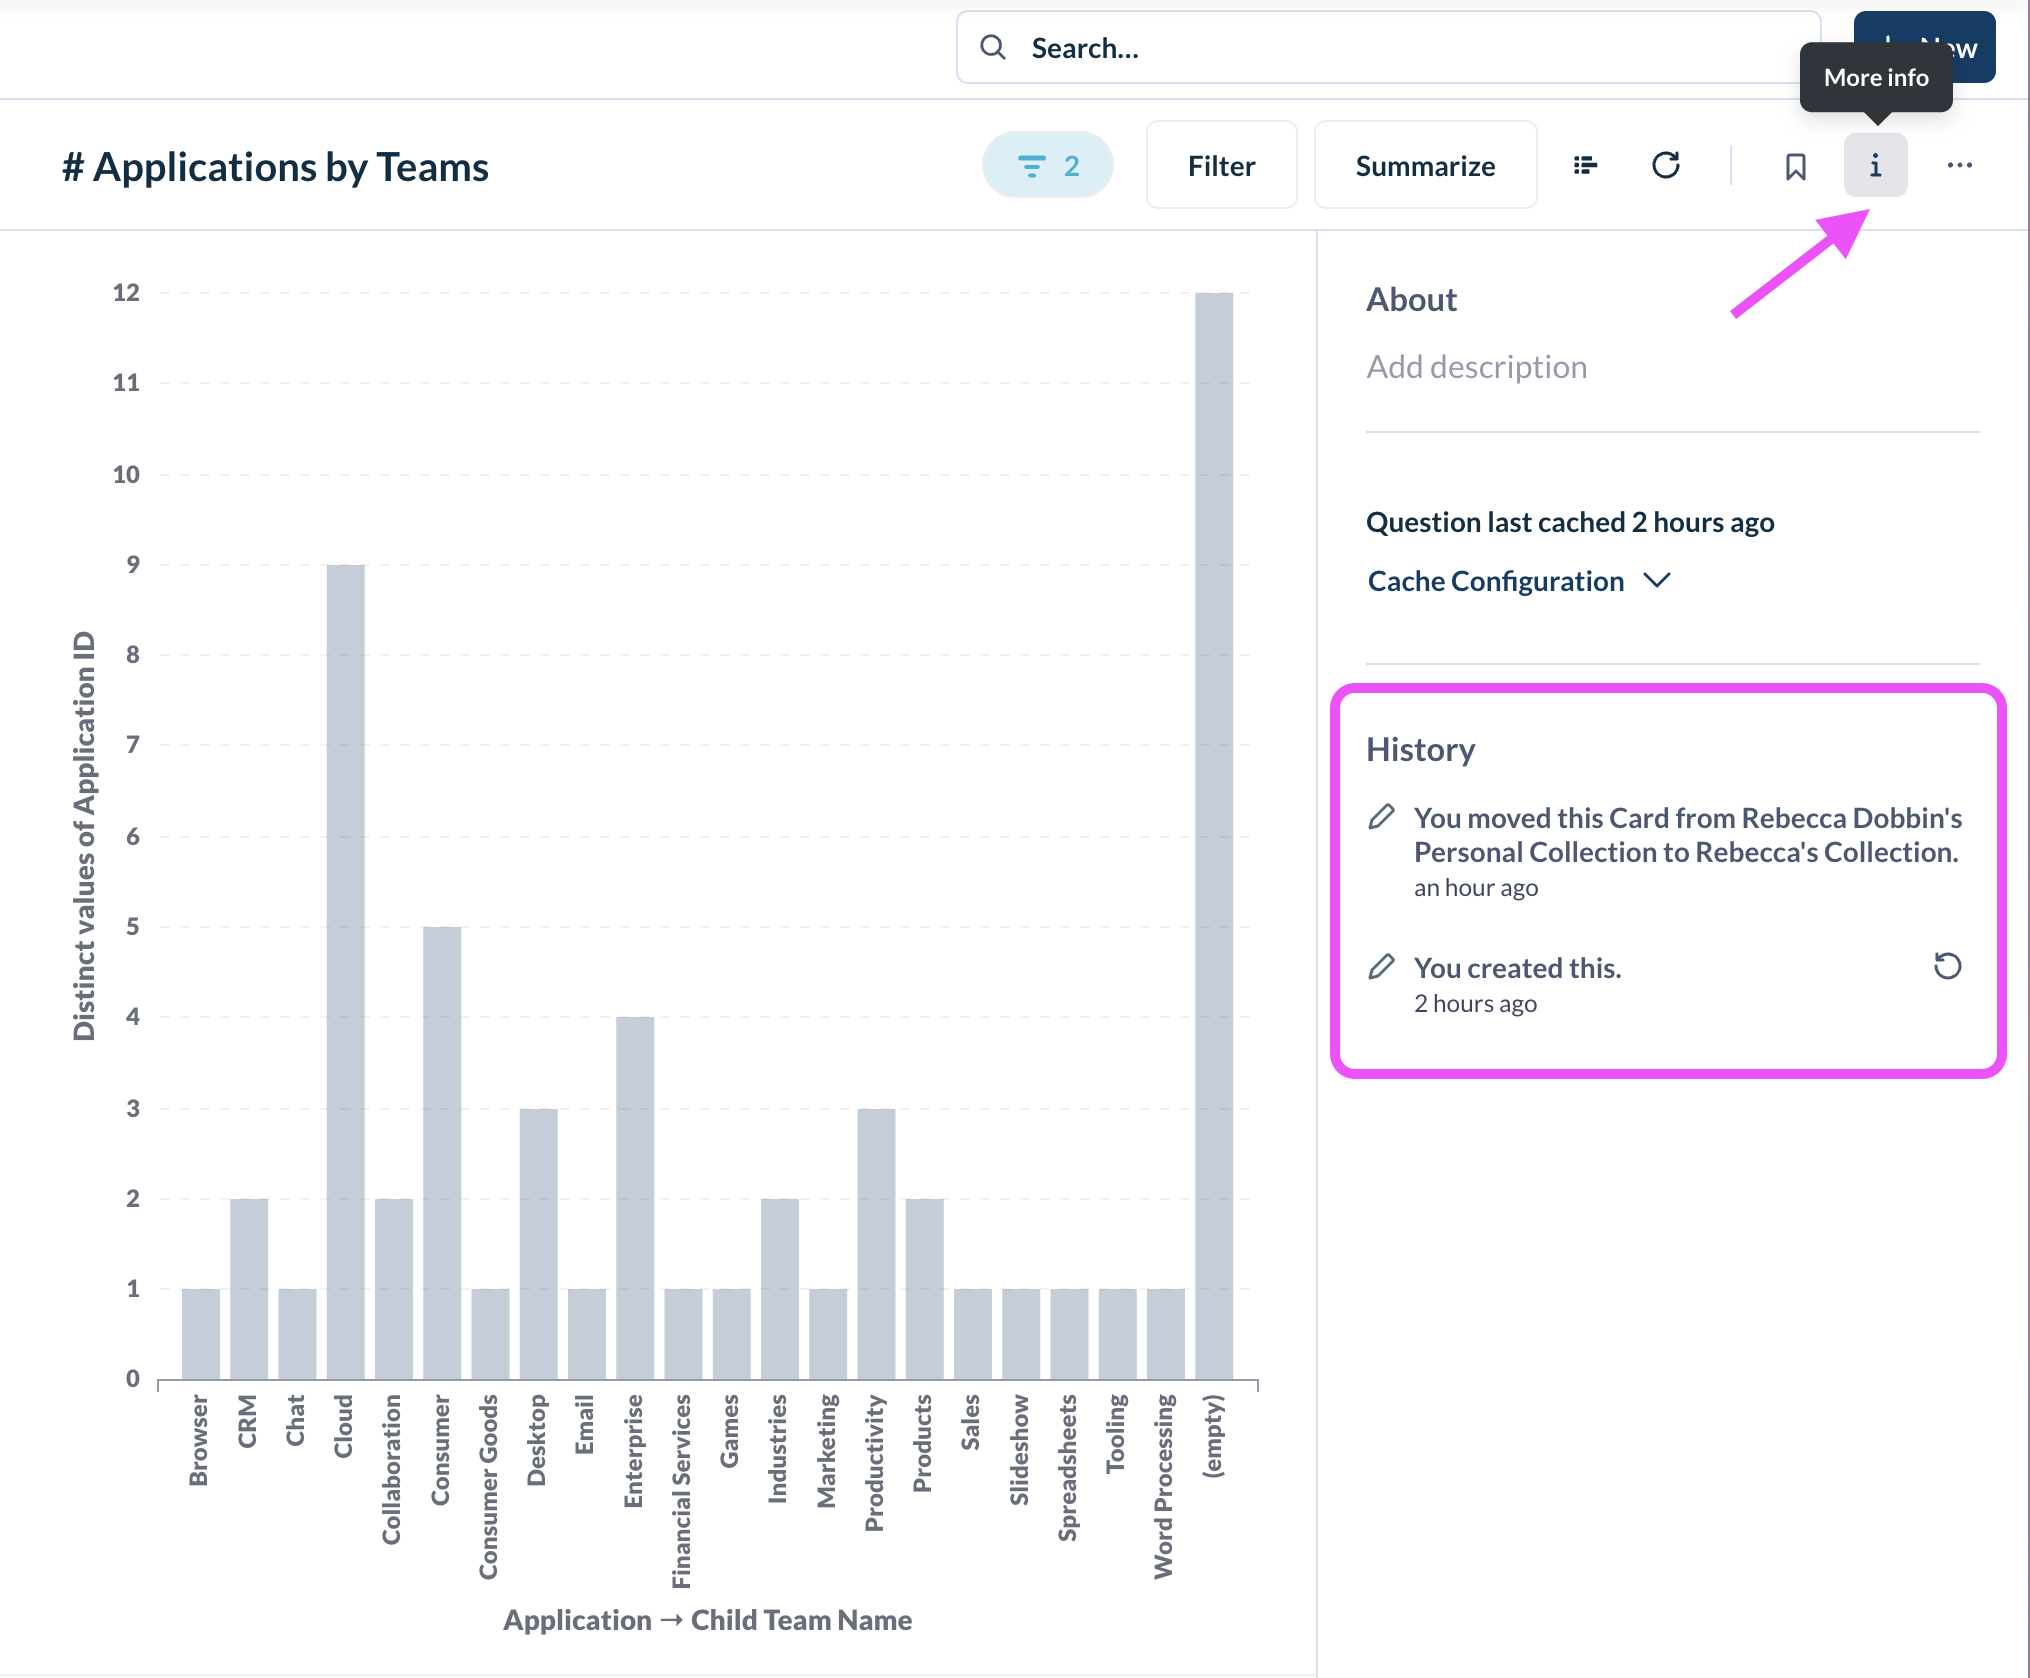
You can view history on a chart by clicking the i icon and viewing History in the right side panel.
Creating Dashboards
As with charts, it is possible to create a new dashboard by modifying an existing one or by building from scratch.
Cloning an Existing Dashboard
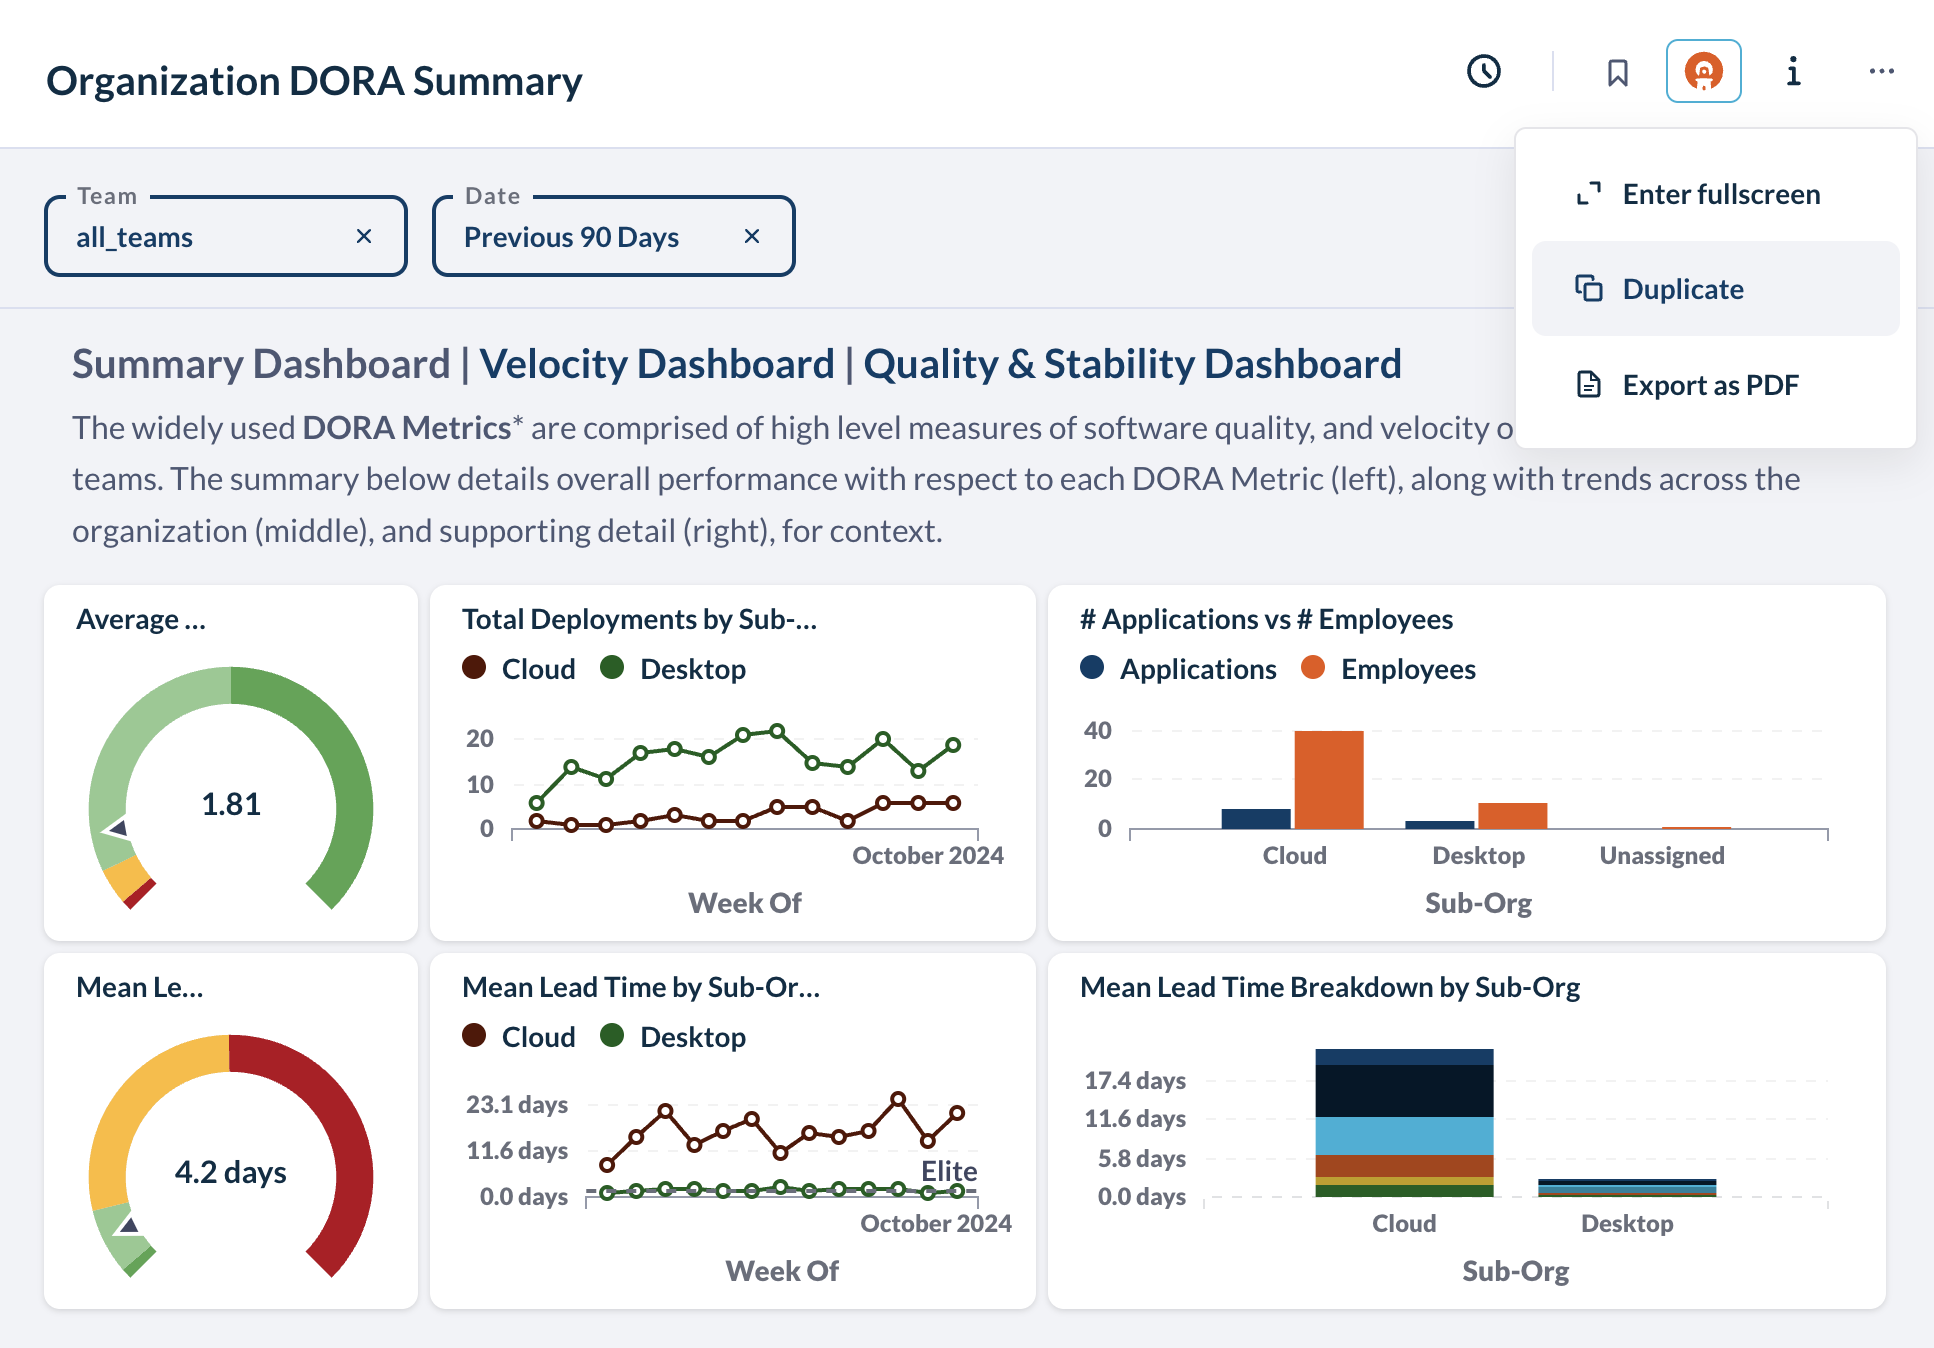
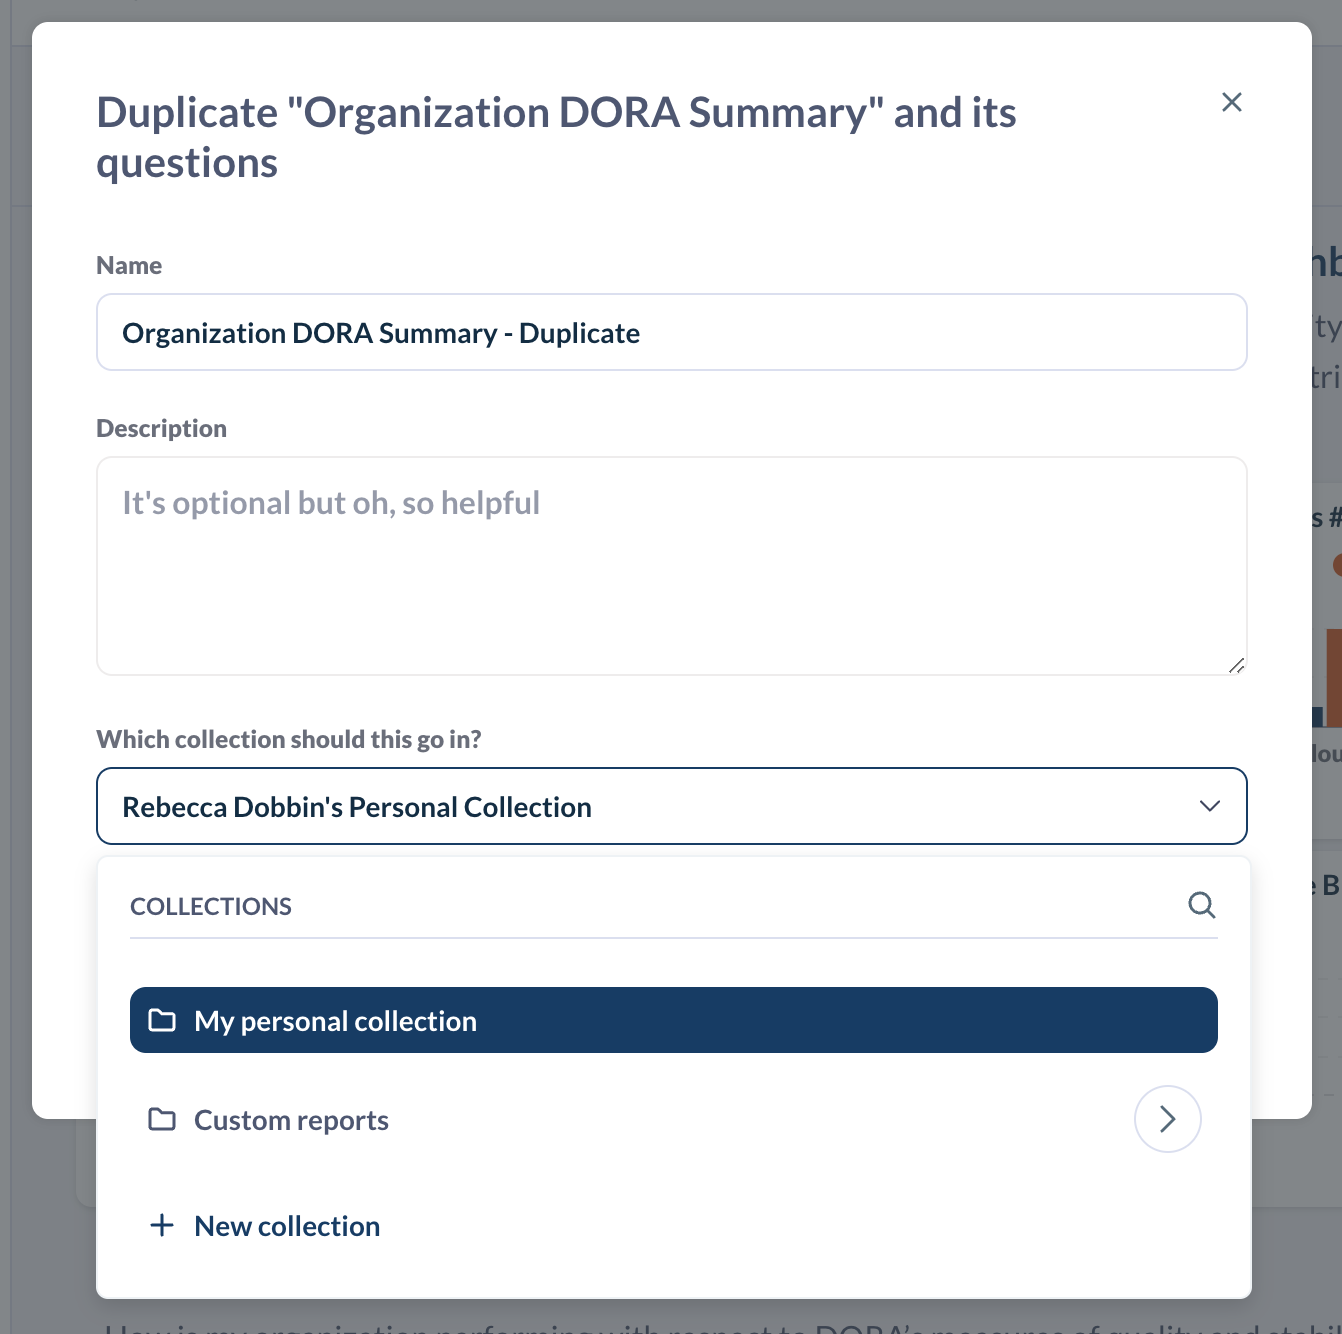
Say you only want to perform a small change such as removing or resizing a chart on one of the existing dashboards. Faros pre-build dashboards cannot be edited, but all dashboards can be duplicated. Select the ... button in the top right corner of the dashboard you are interested in and select Duplicate. Save the dashboard to your personal collection. This will create an editable copy of the dashboard.
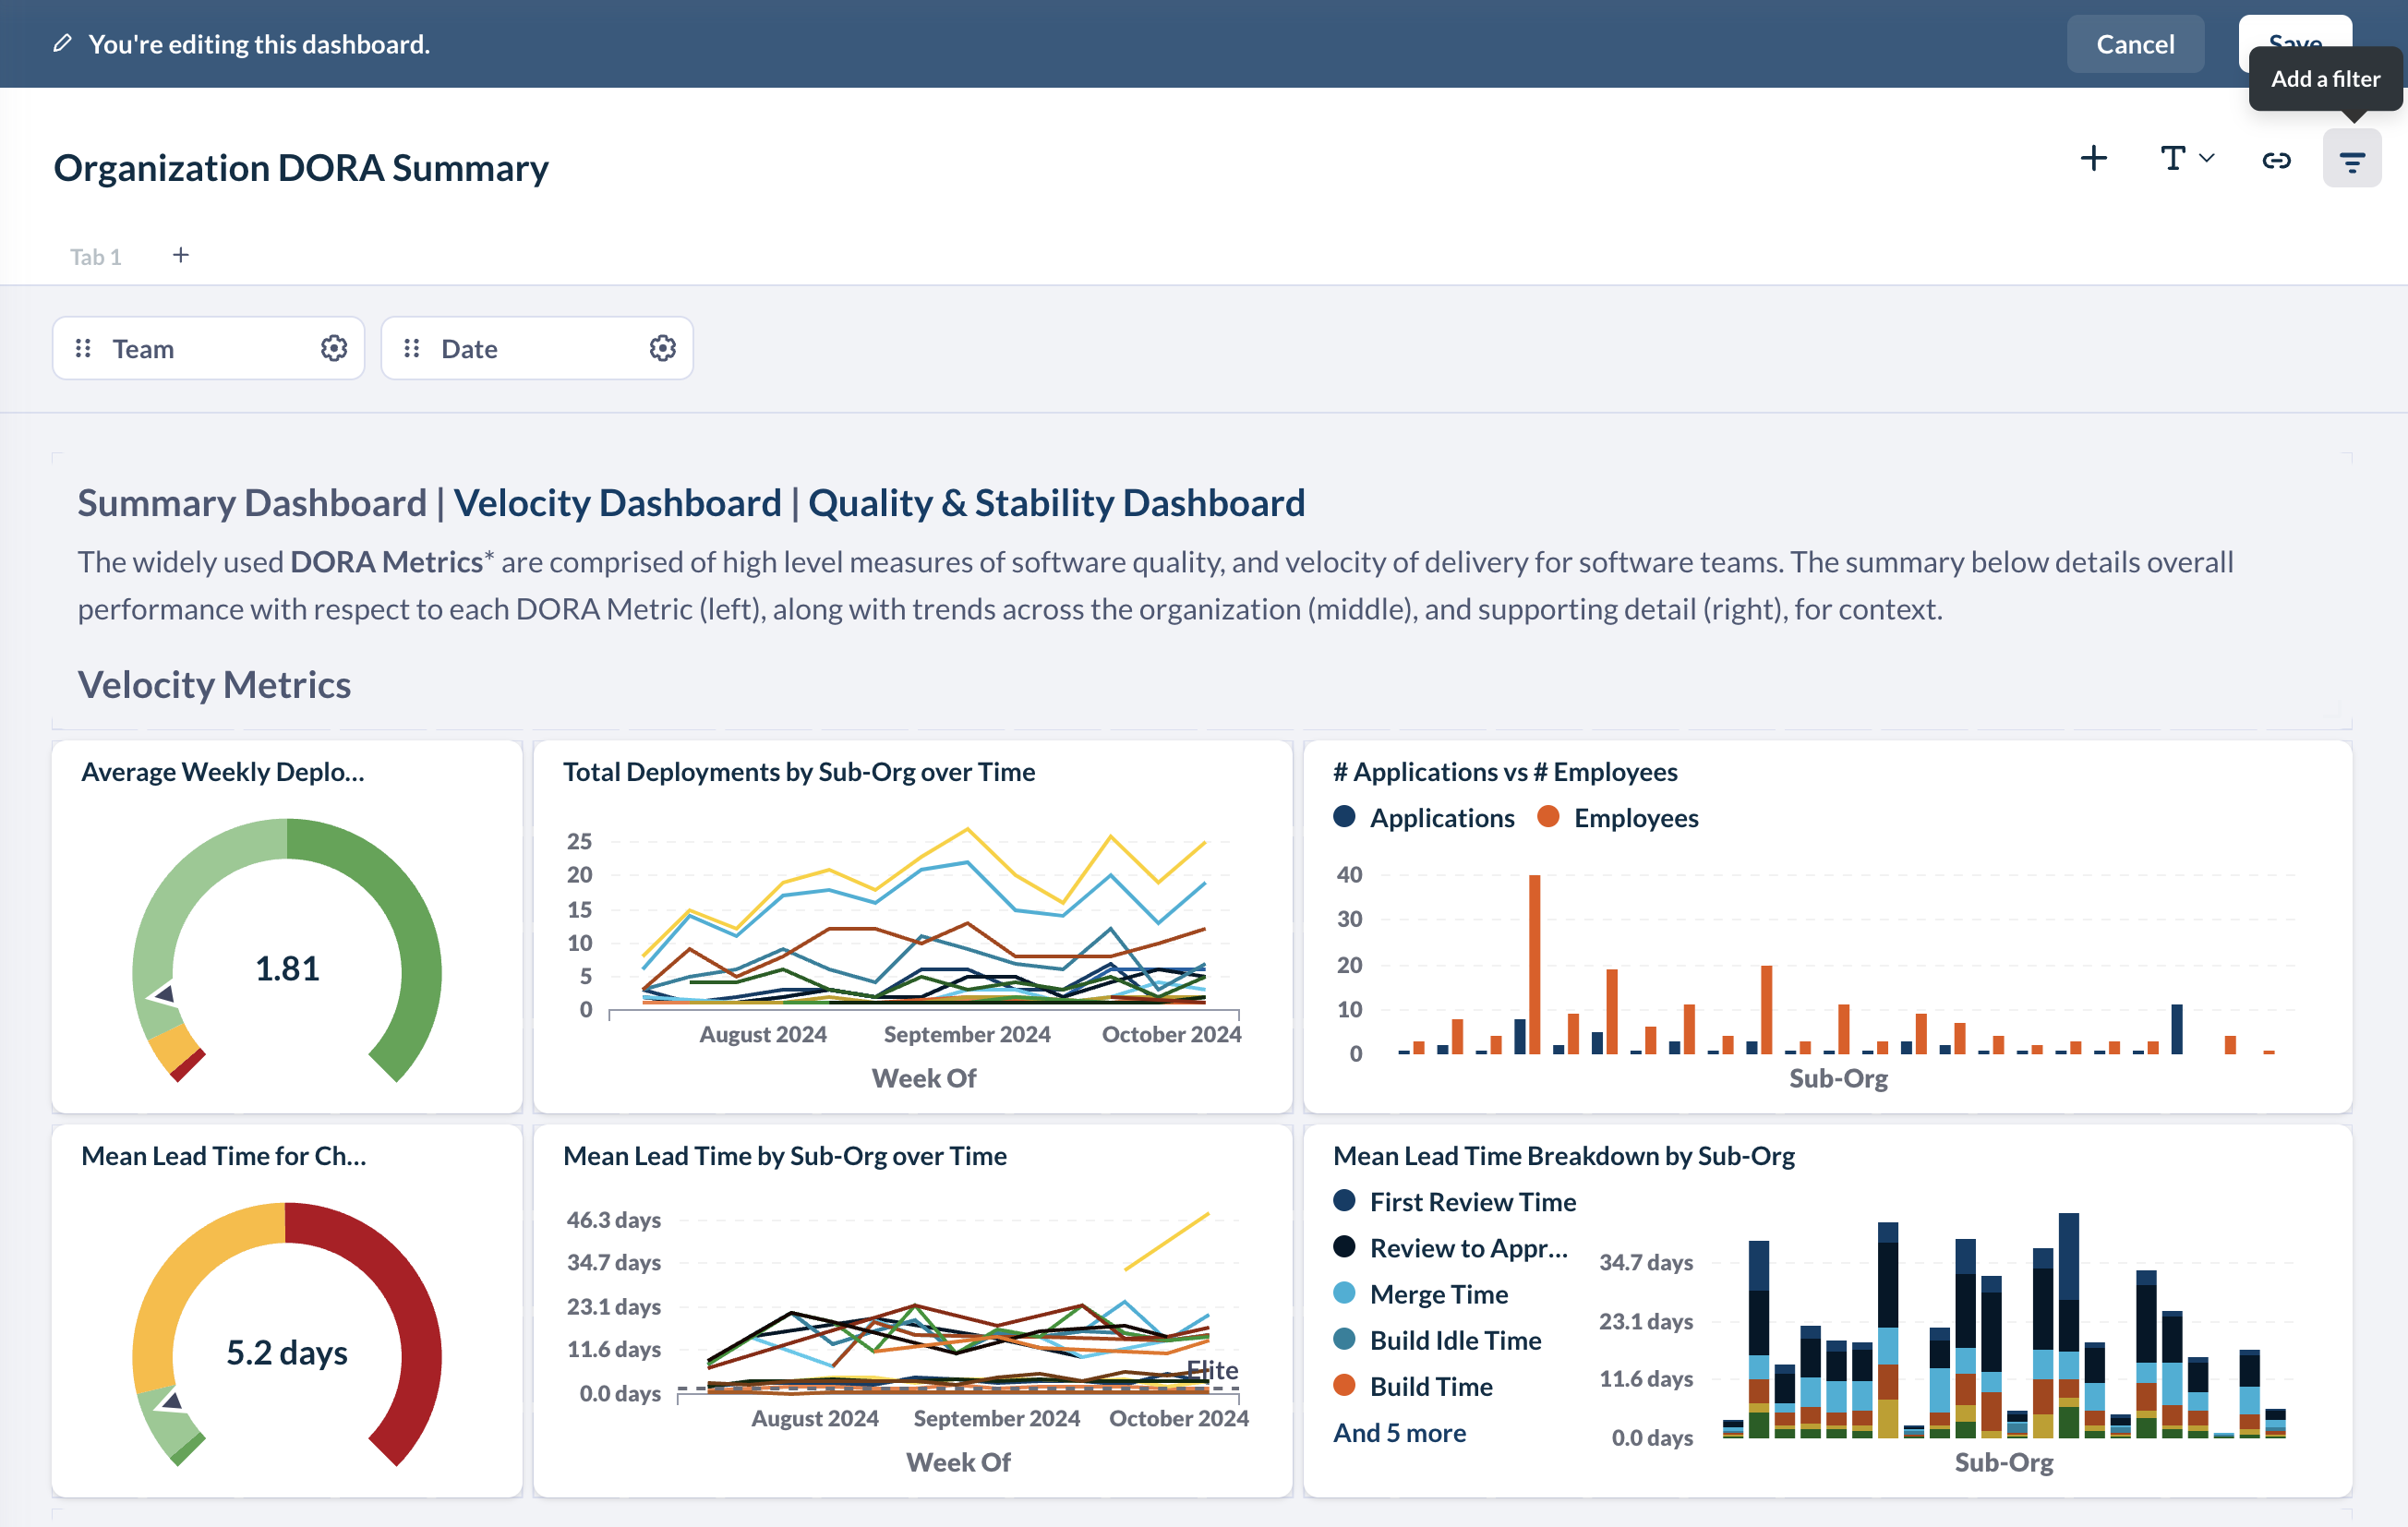
Customize your new dashboard however you want. Edit the dashboard by selecting the pencil icon in the top right. Now you can move and resize charts, delete or add new ones! You're also able to modify the filters or click behavior of any cards.
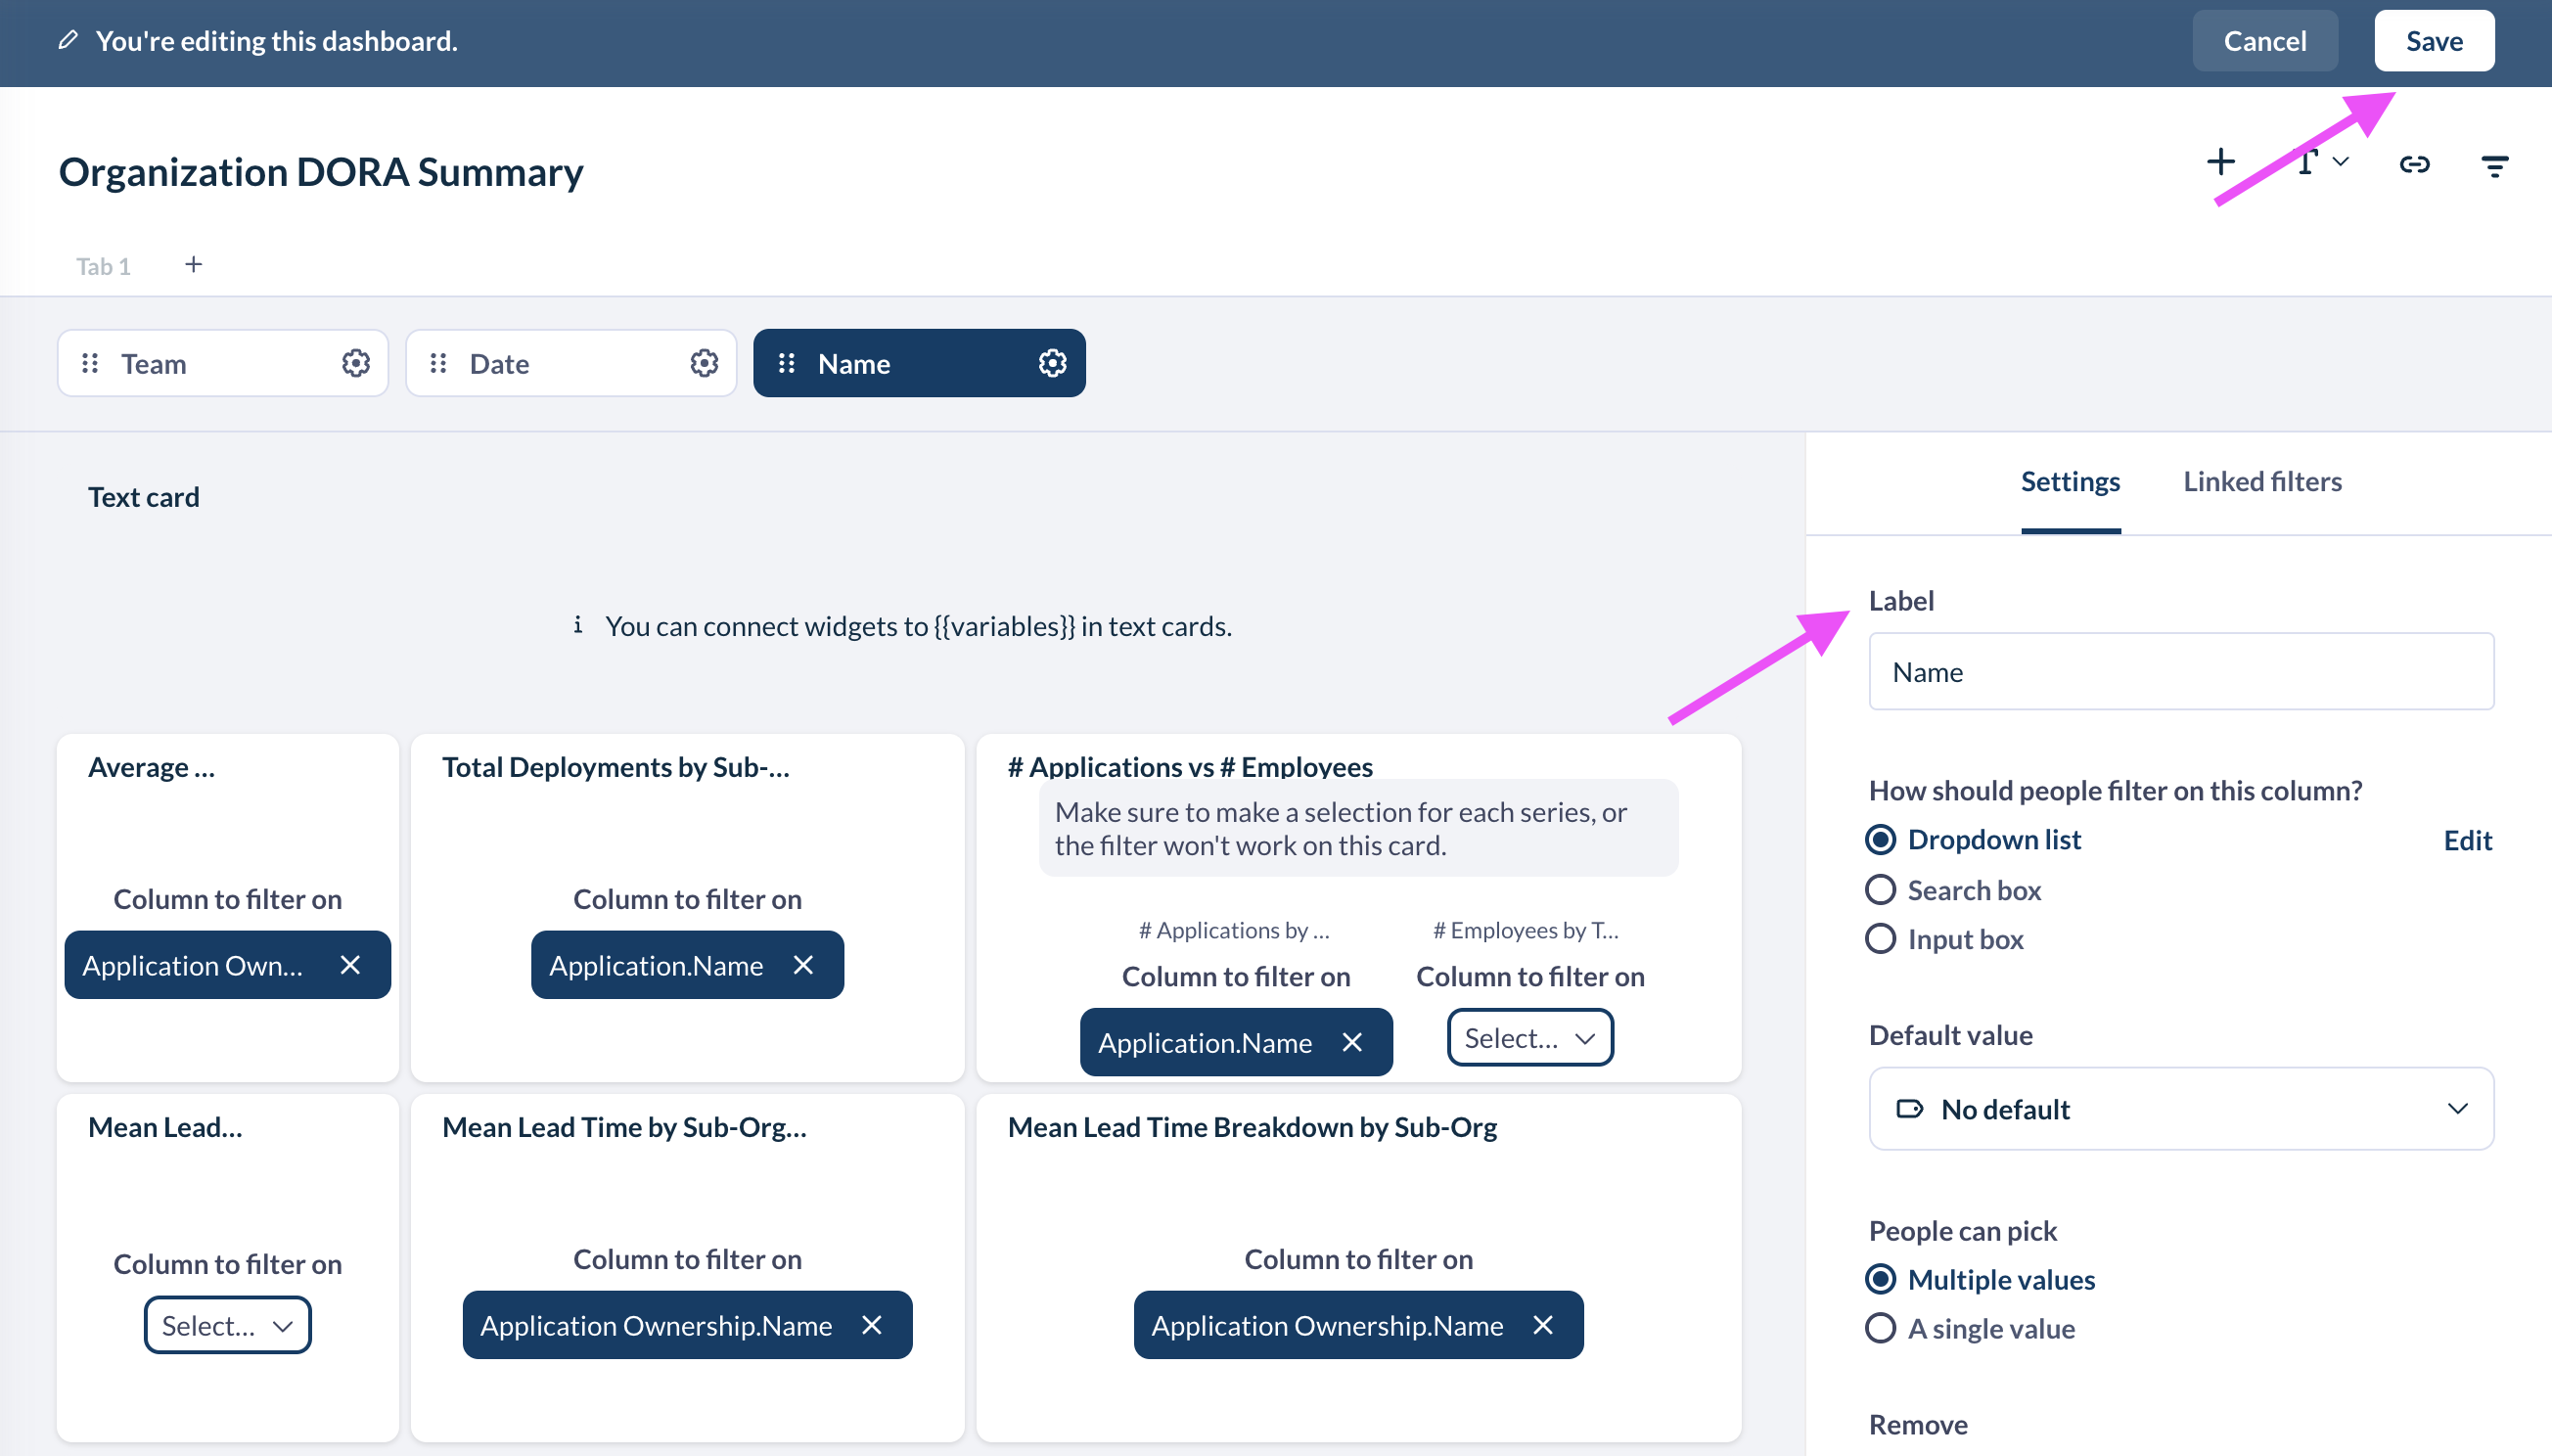
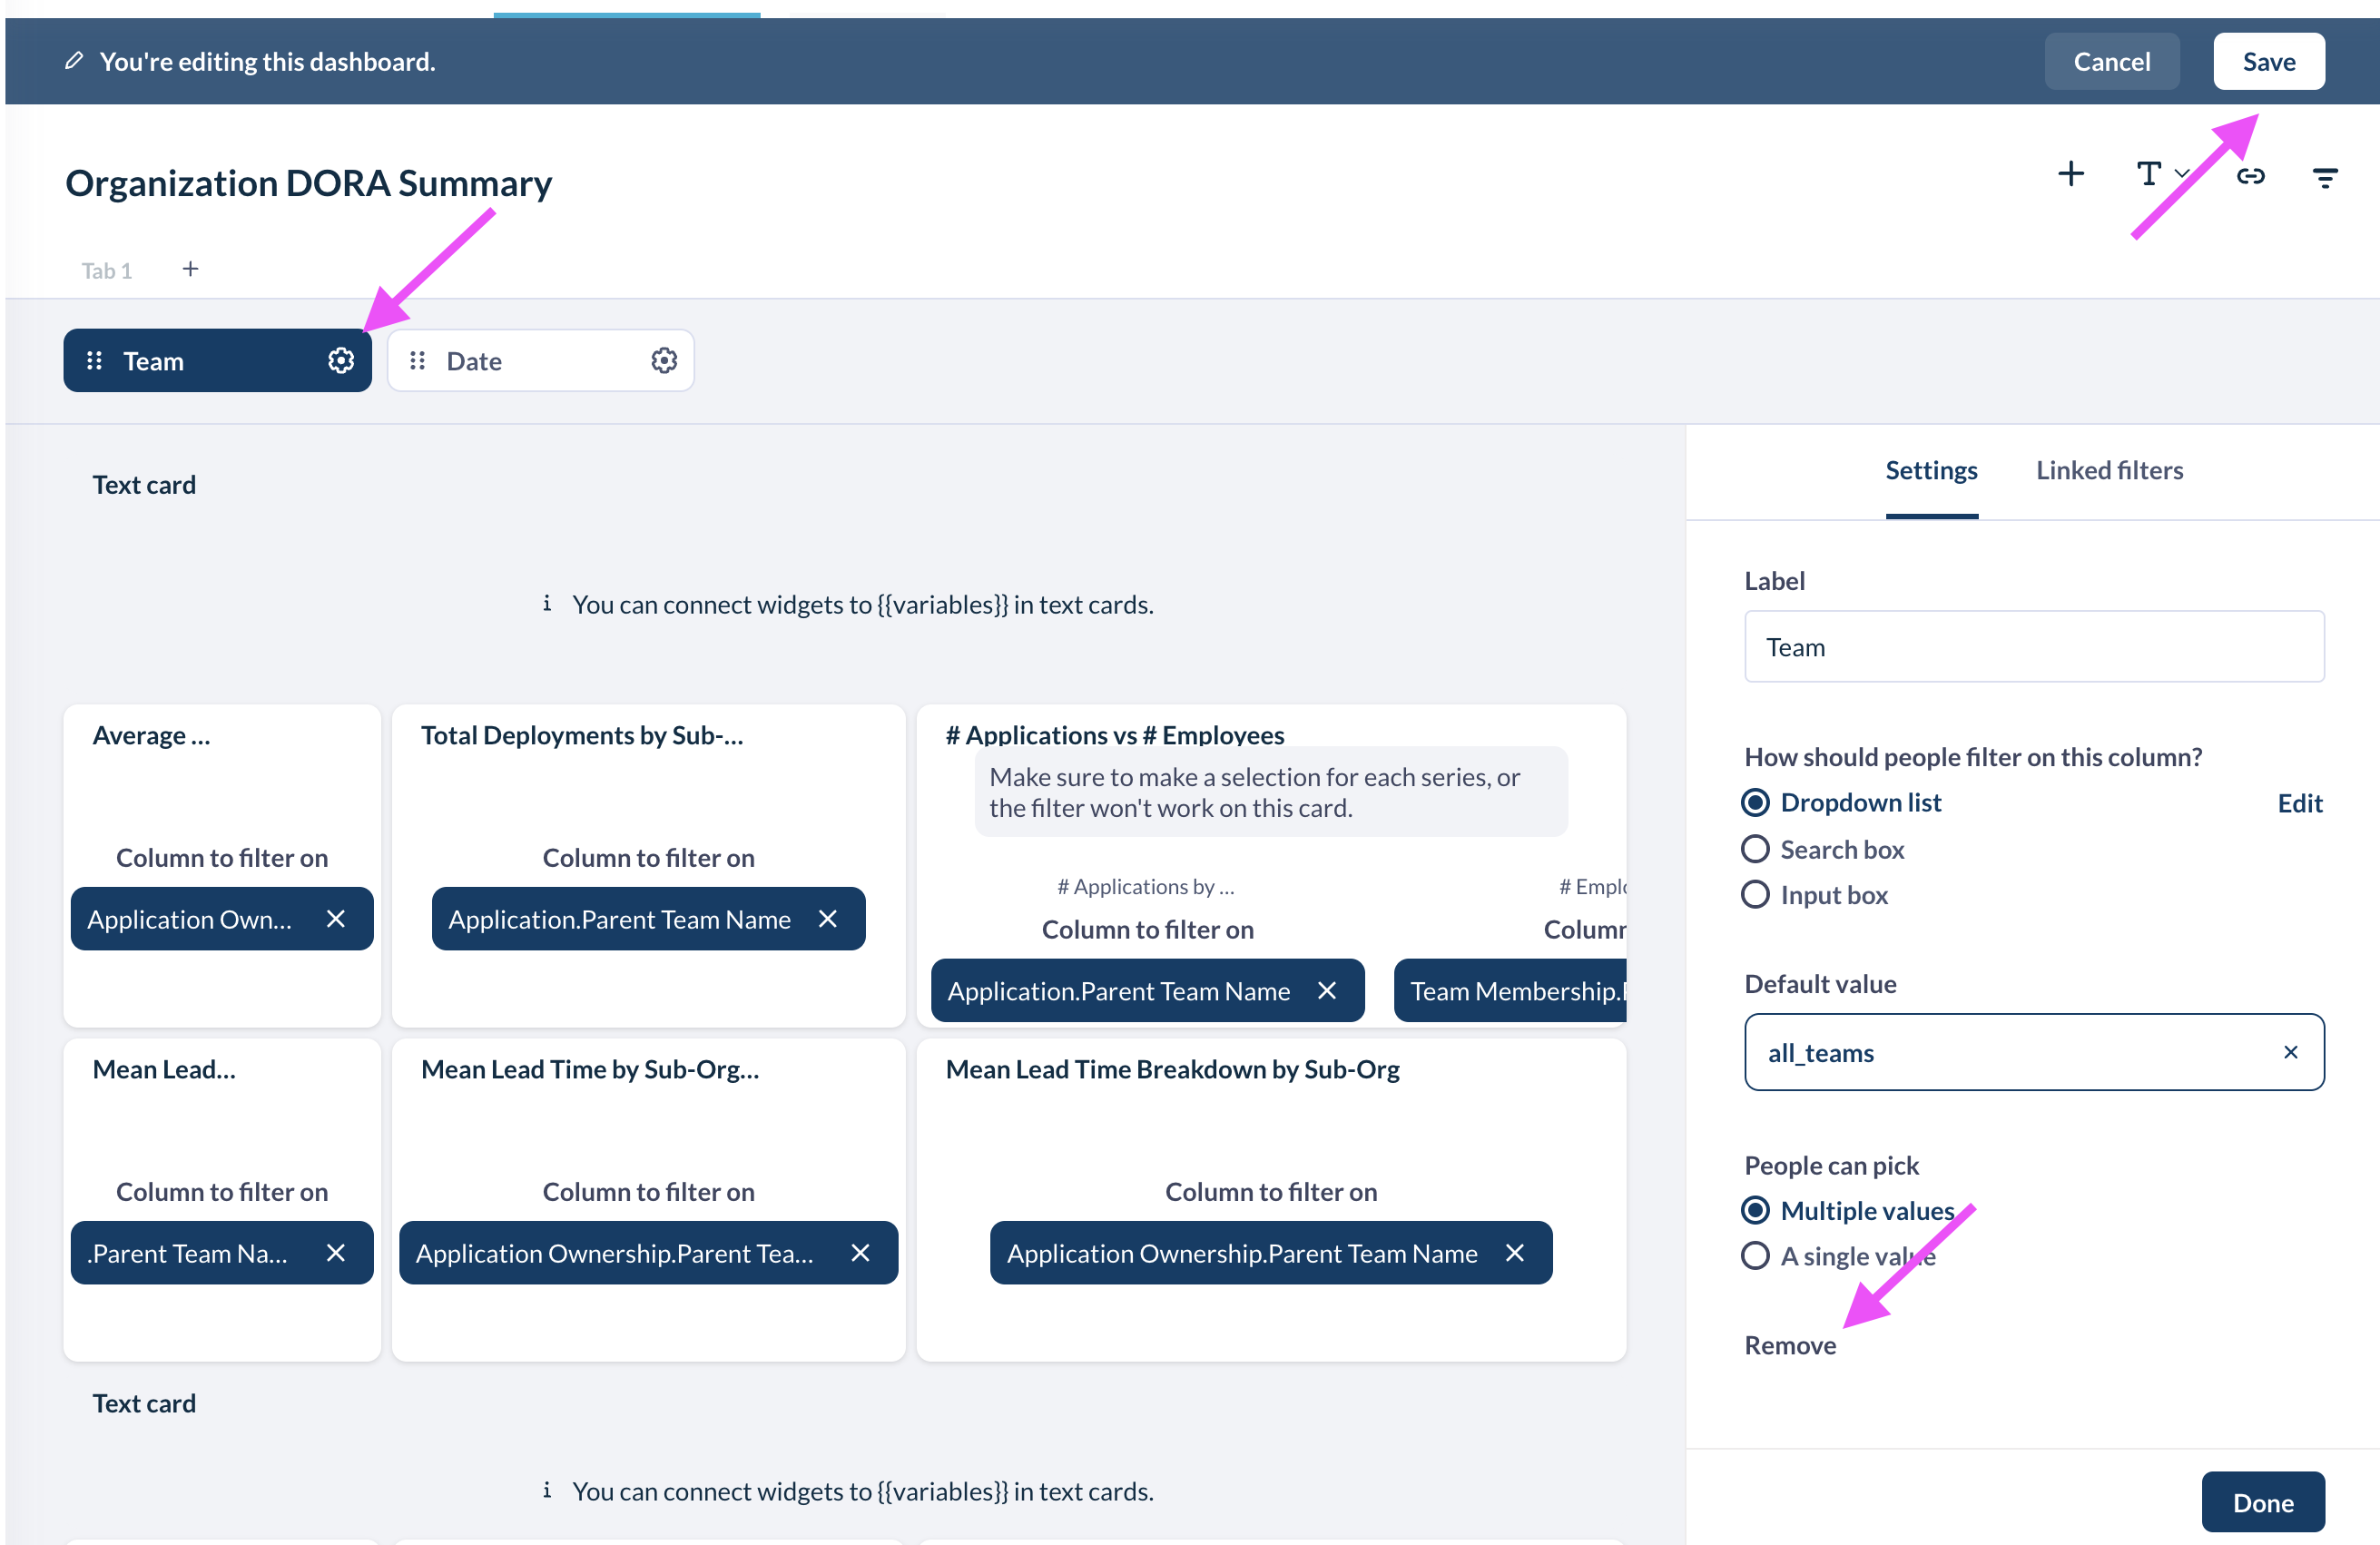
Adding & Removing Filters from Dashboards
-
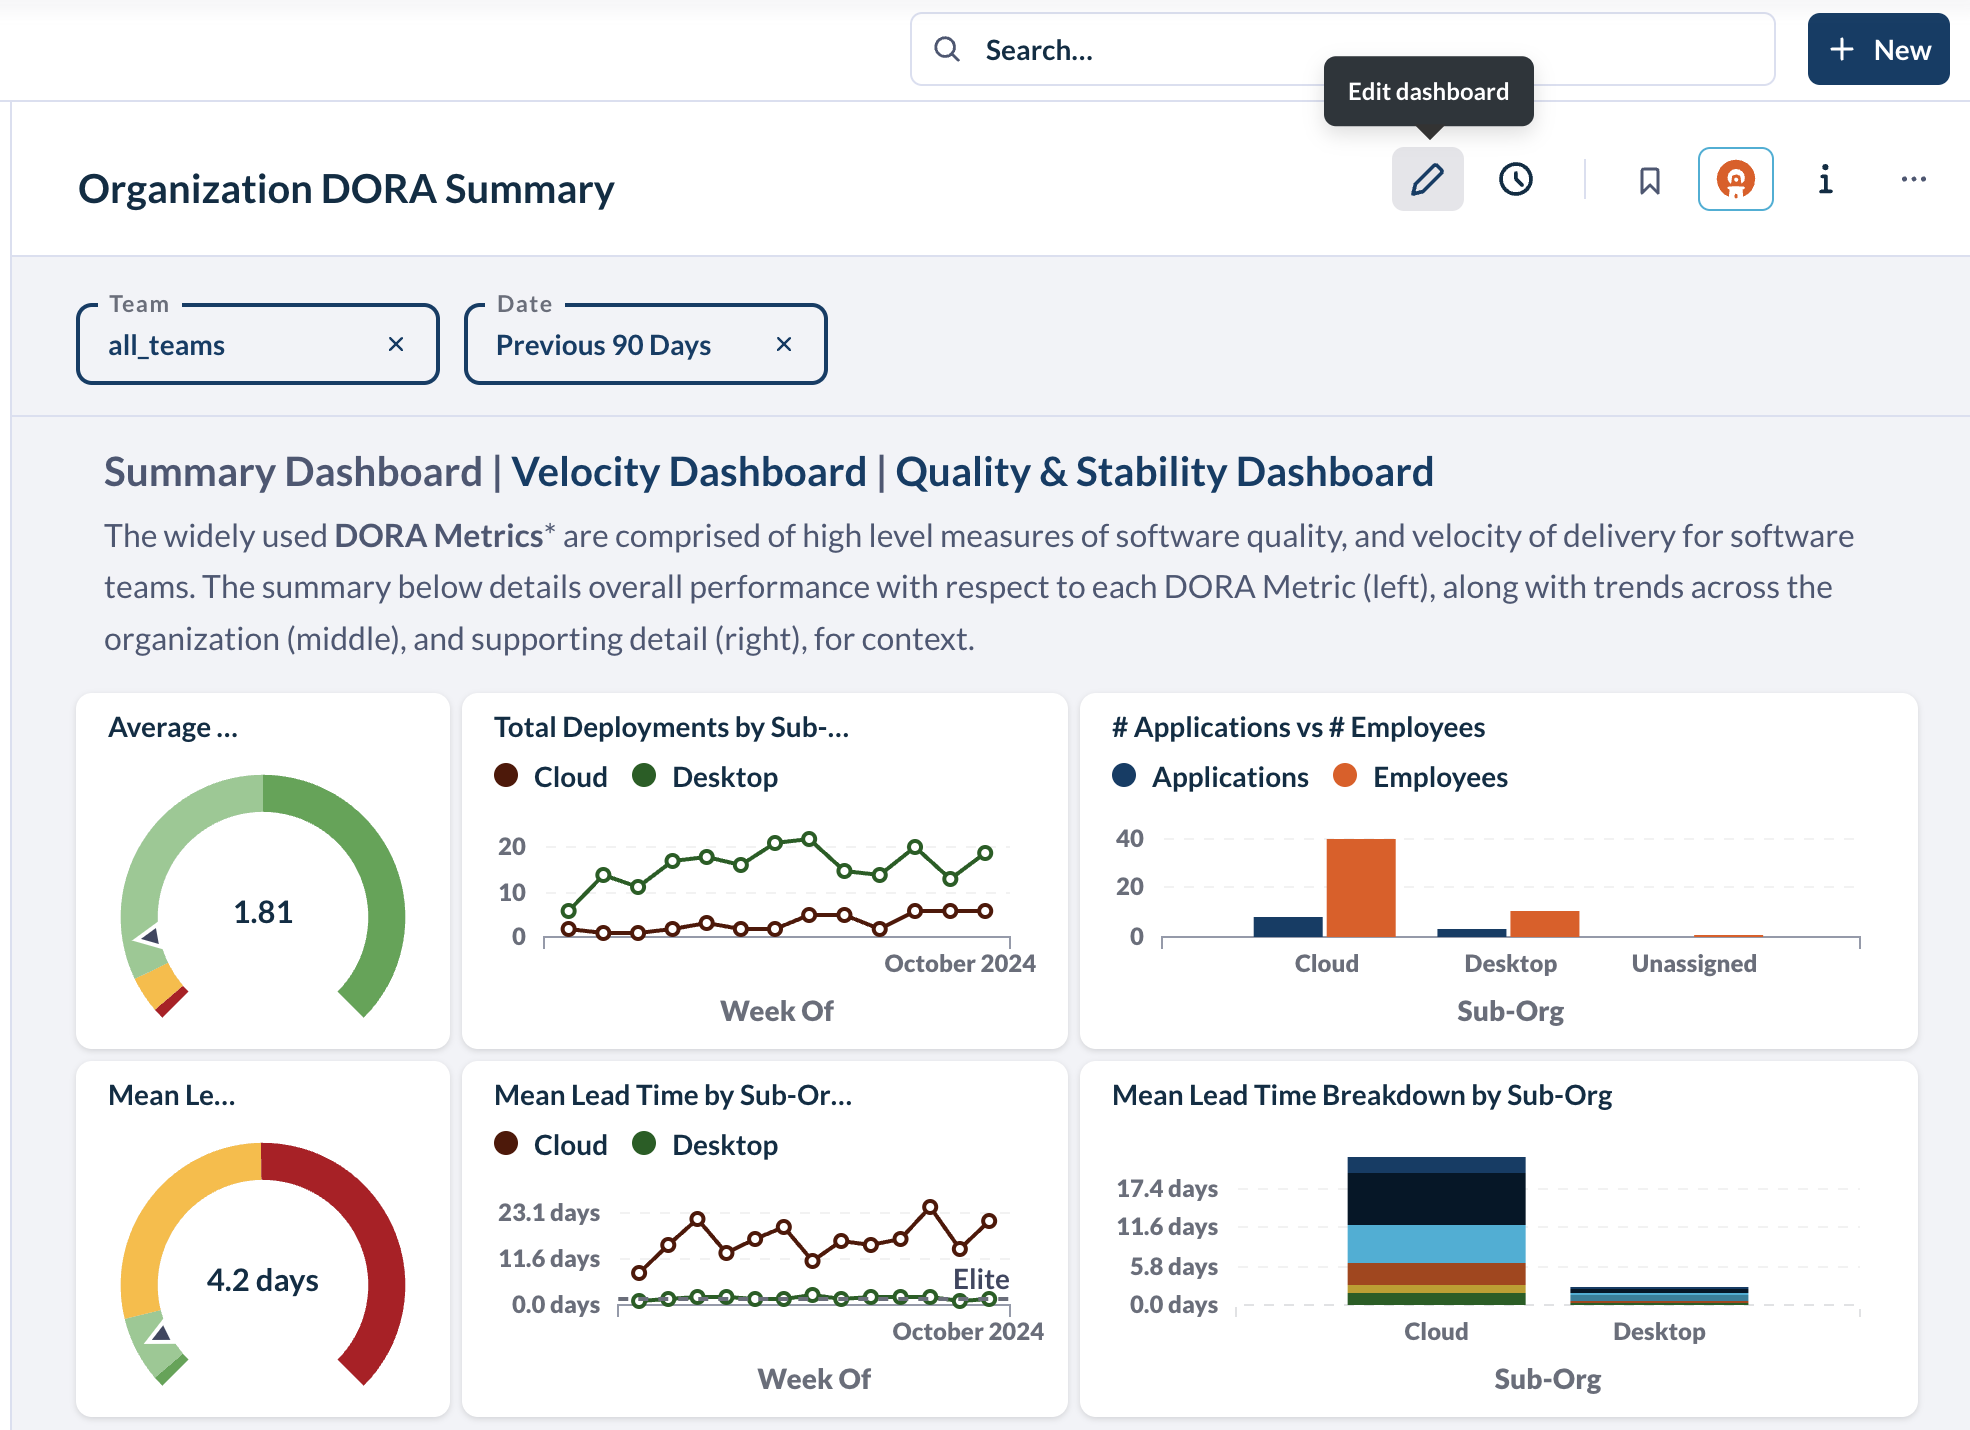
Click the edit icon above a dashboard
-
- Note: if you do not have edit access for a dashboard, either ask your Faros AI admin to update your user role, or you can duplicate the dashboard and add it to your personal collection first (once in your personal collection, you will have edit rights). Faros pre-built dashboards are not editable, and need to be cloned first. See section above for details.
-
-
To remove a filter, click the filter, then click Remove and Save
-
-
To add a filter,
-
Click the Add a filter icon in the upper right corner
-
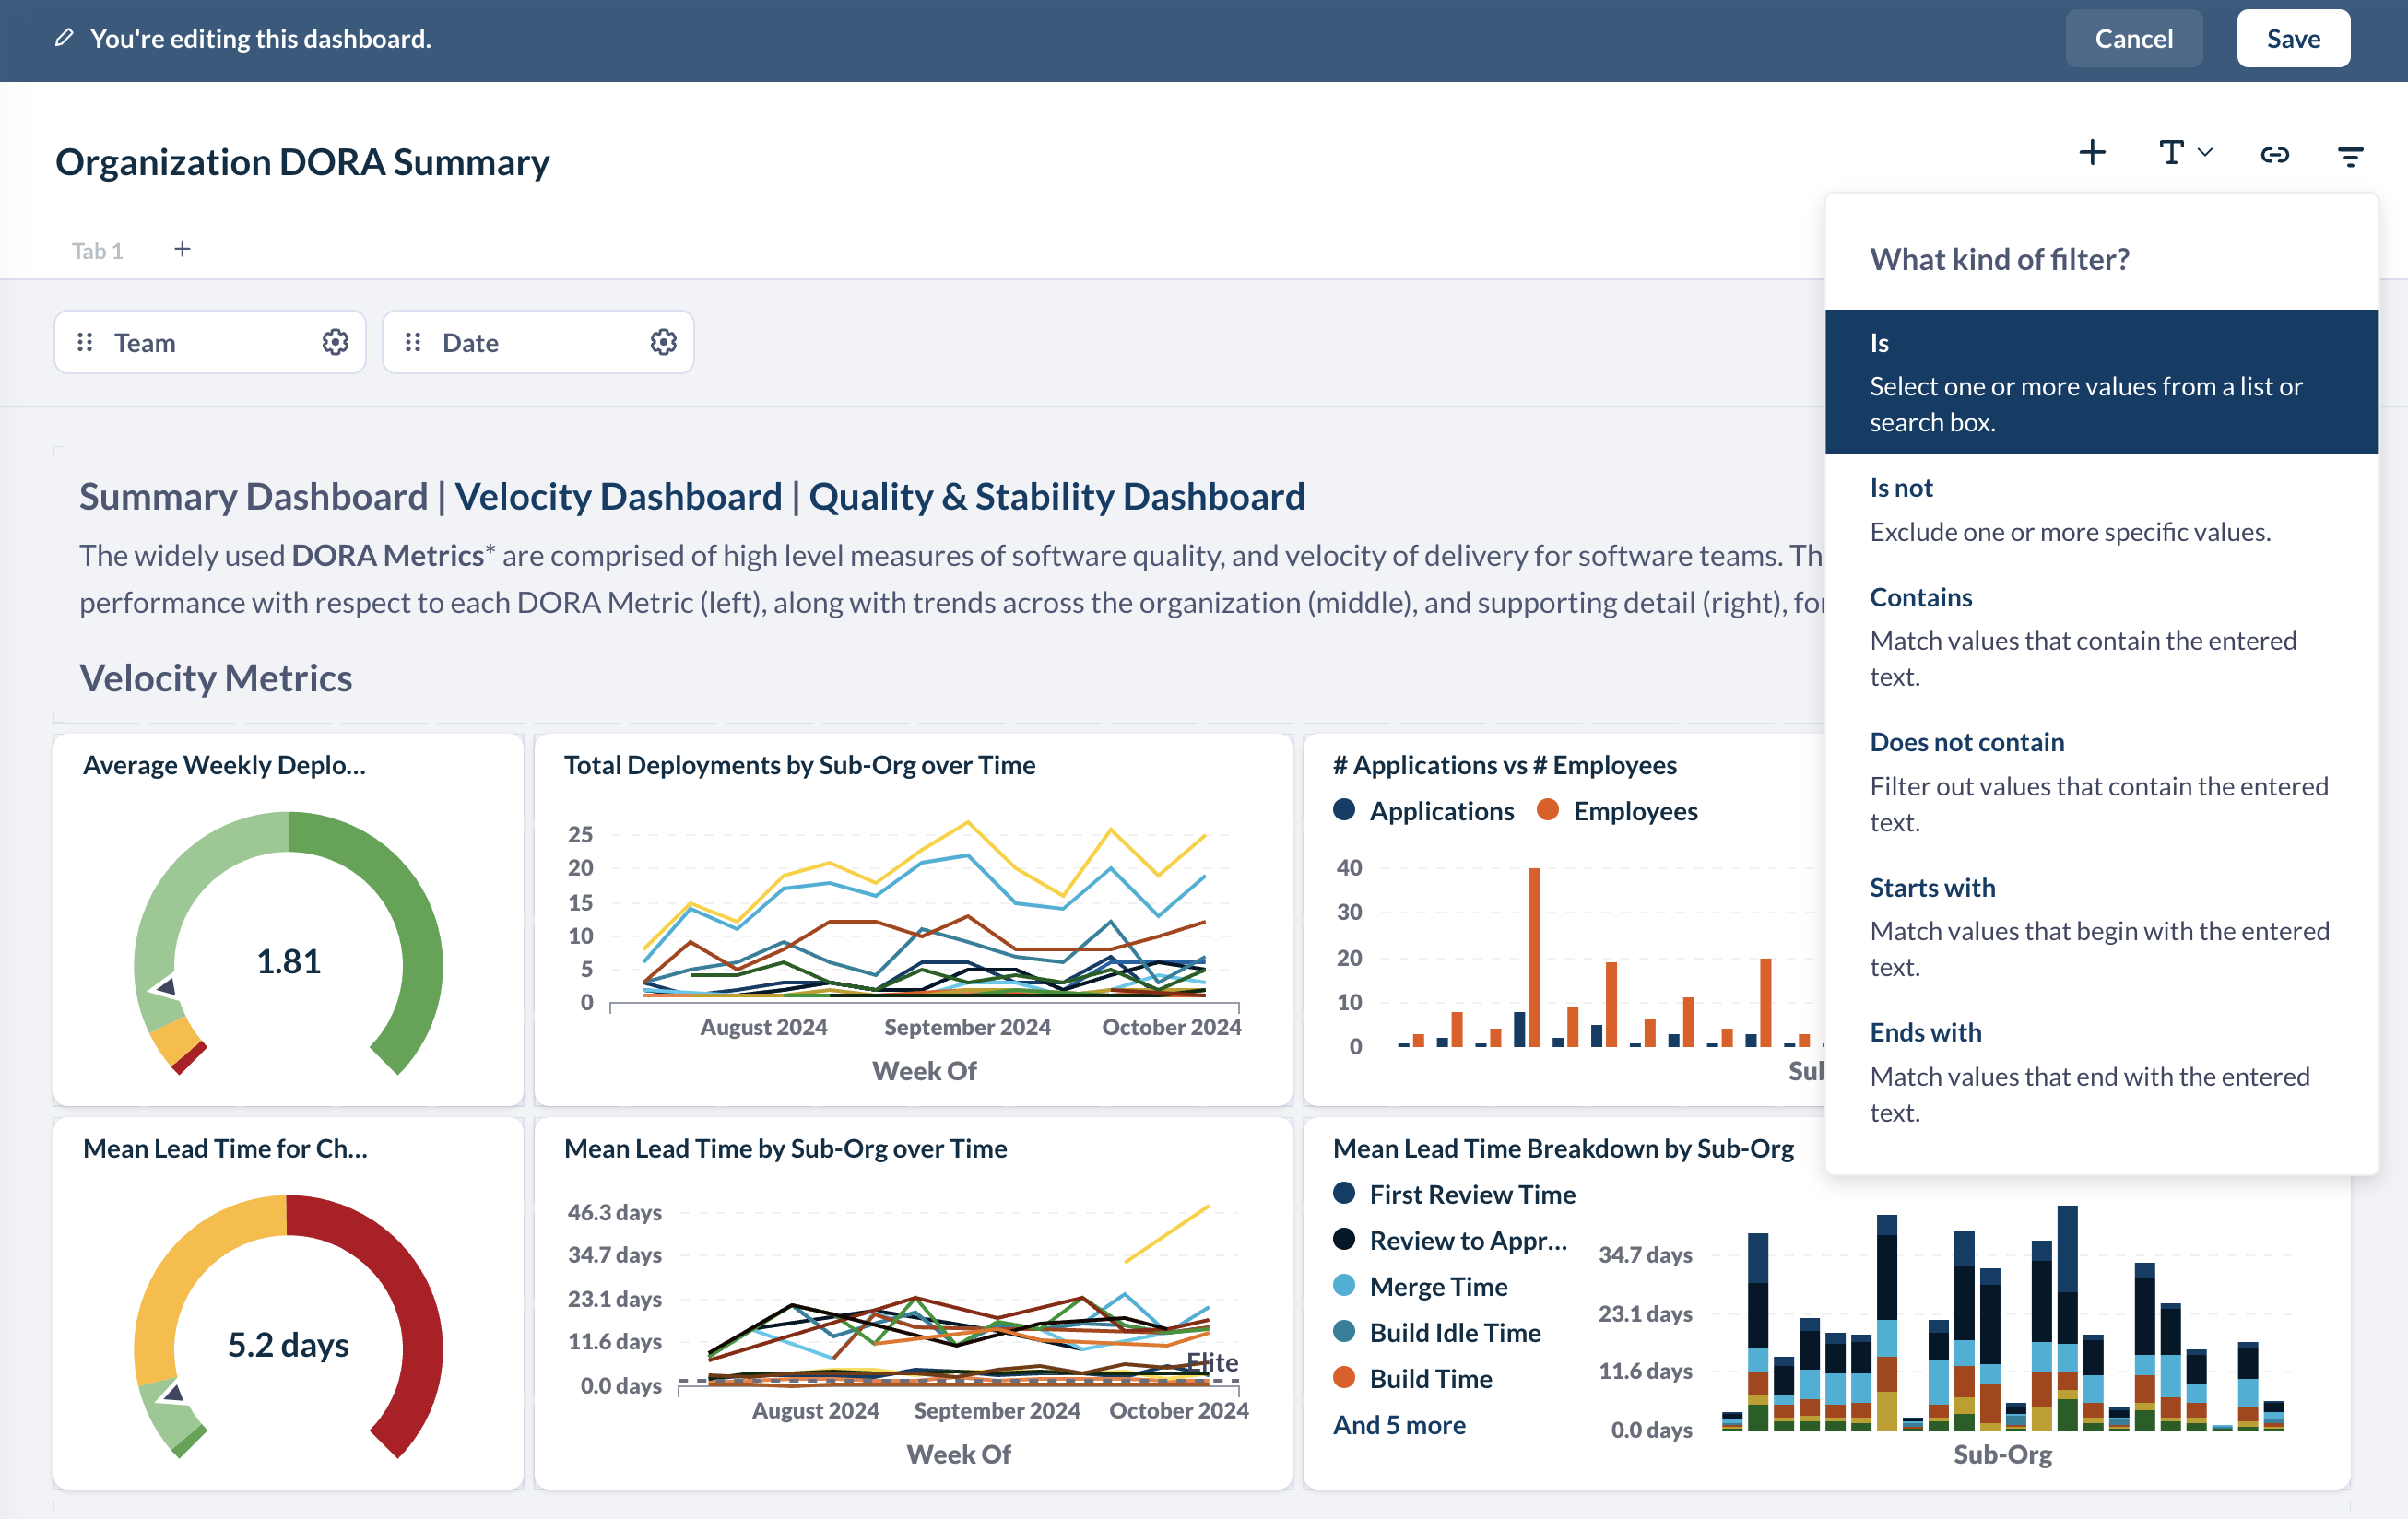
Choose the kind of filter you'd like to add
-
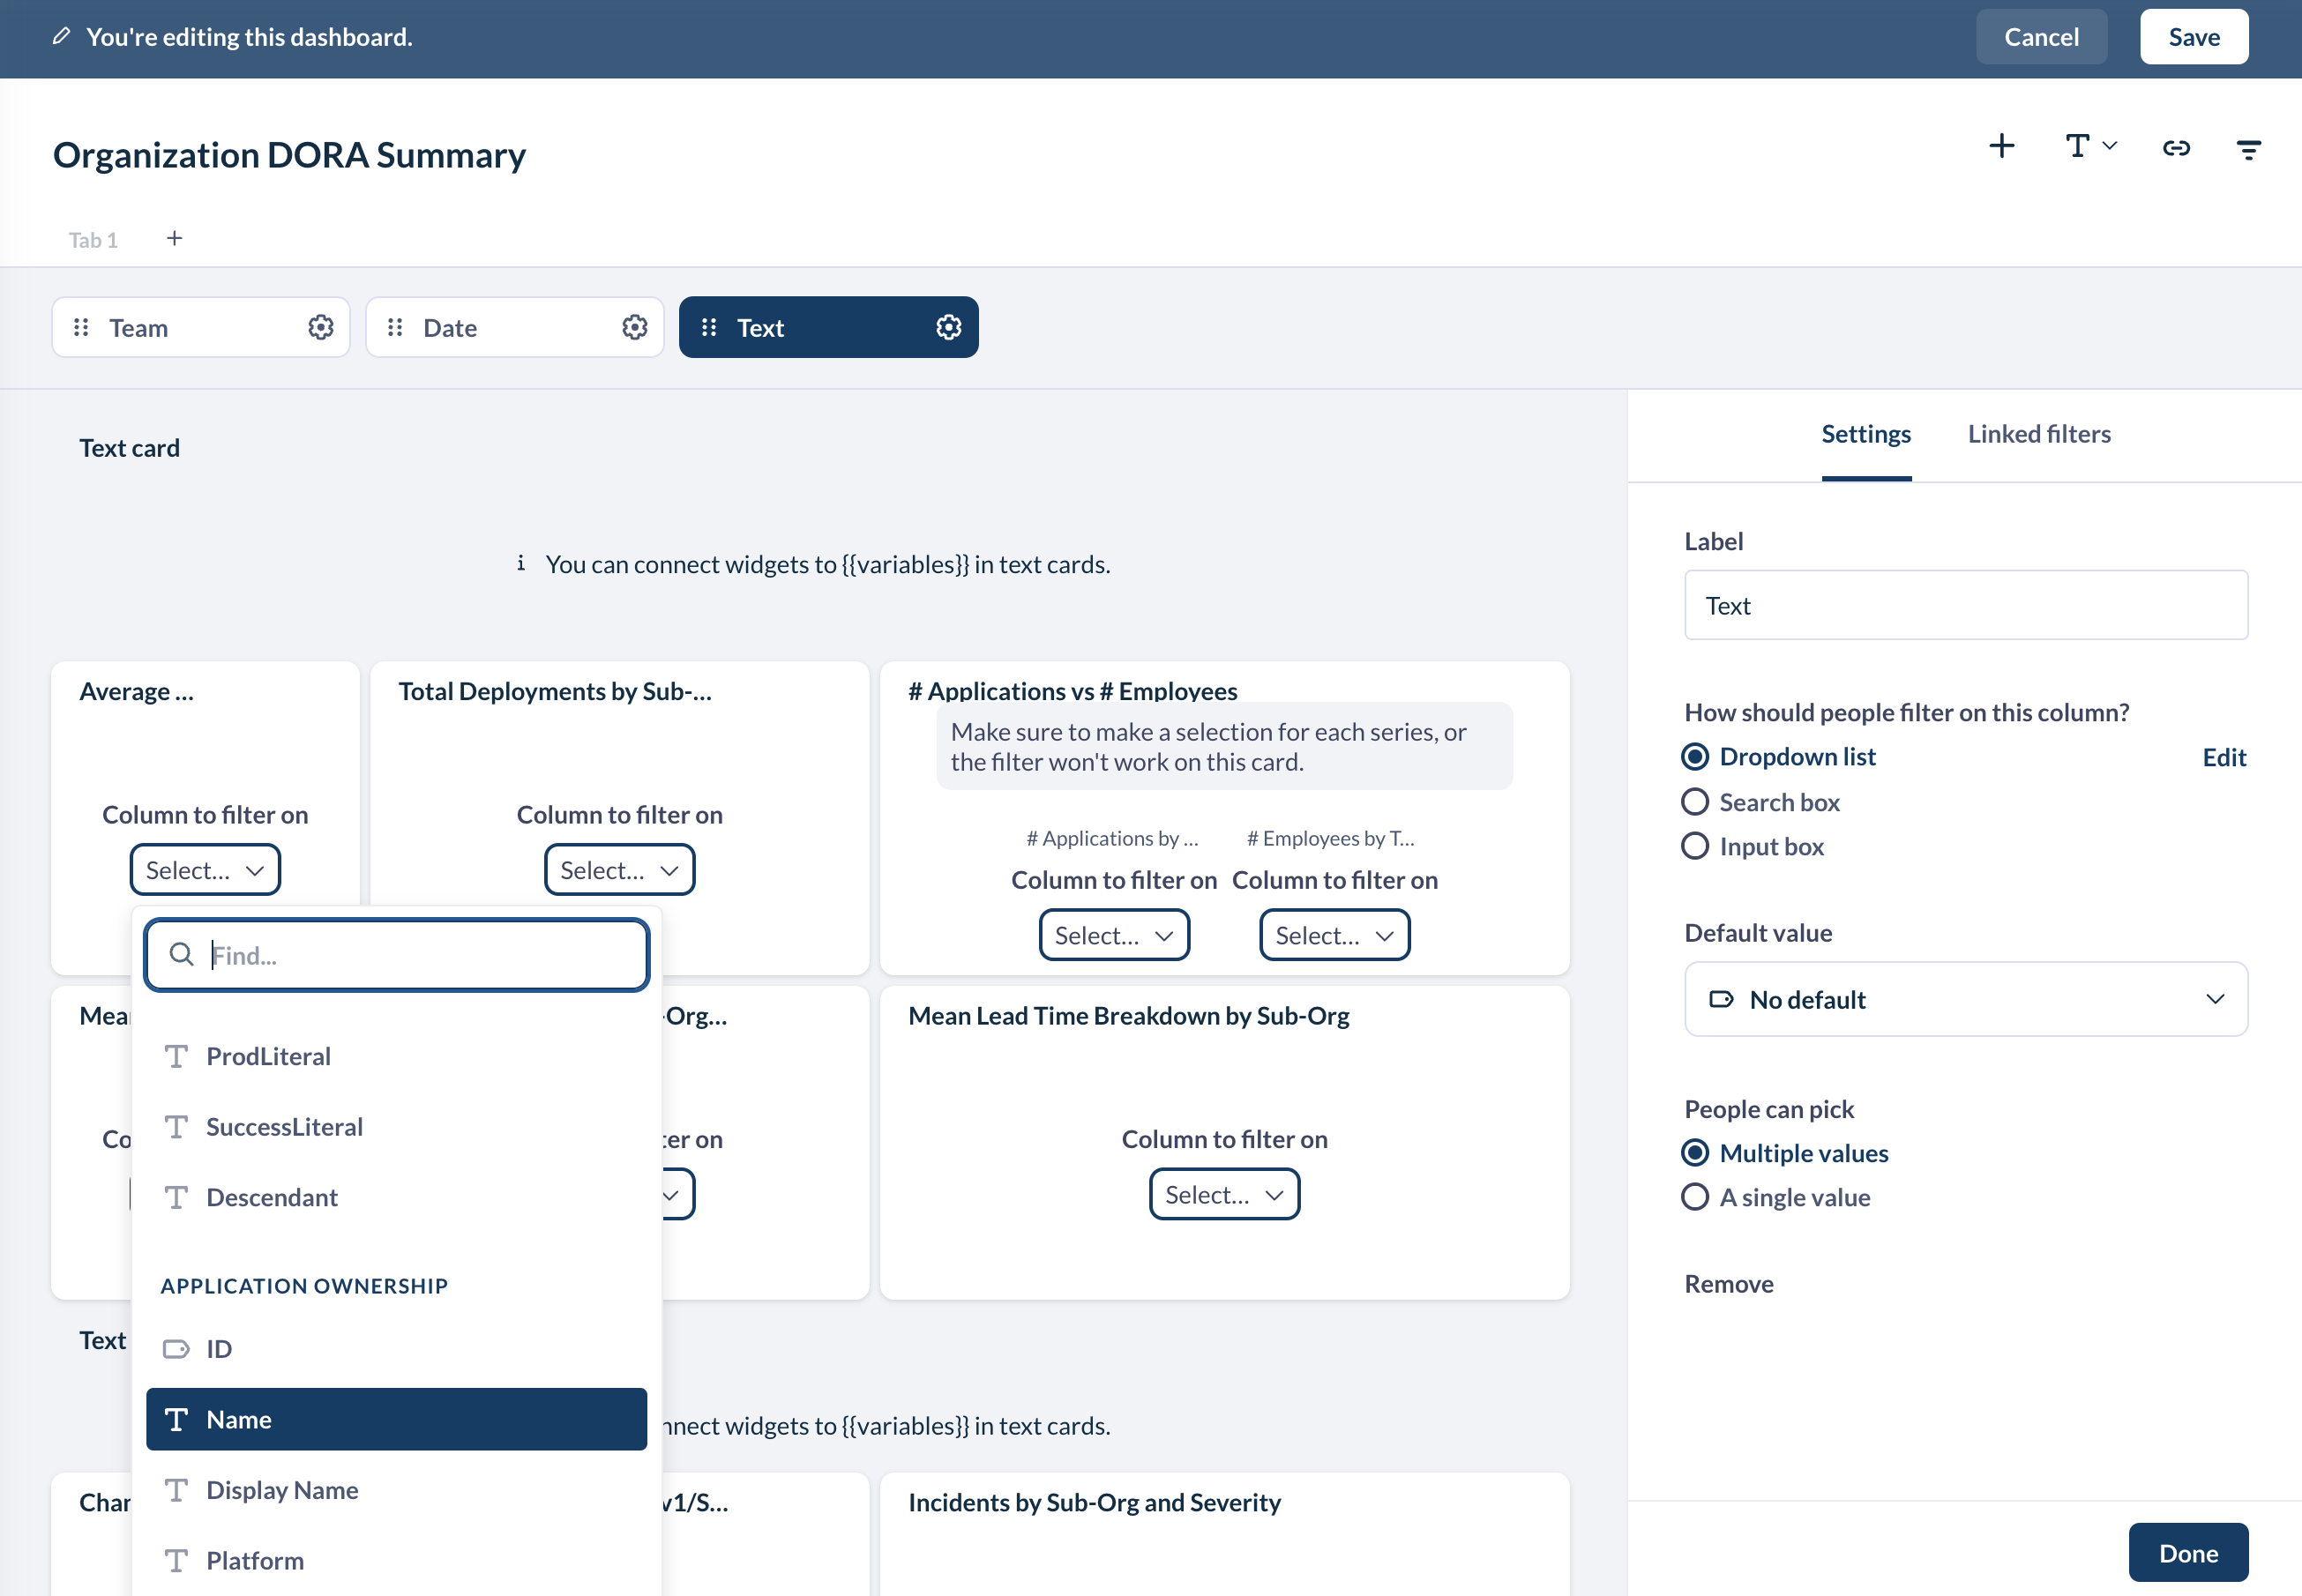
Choose which field to filter on for each chart
-
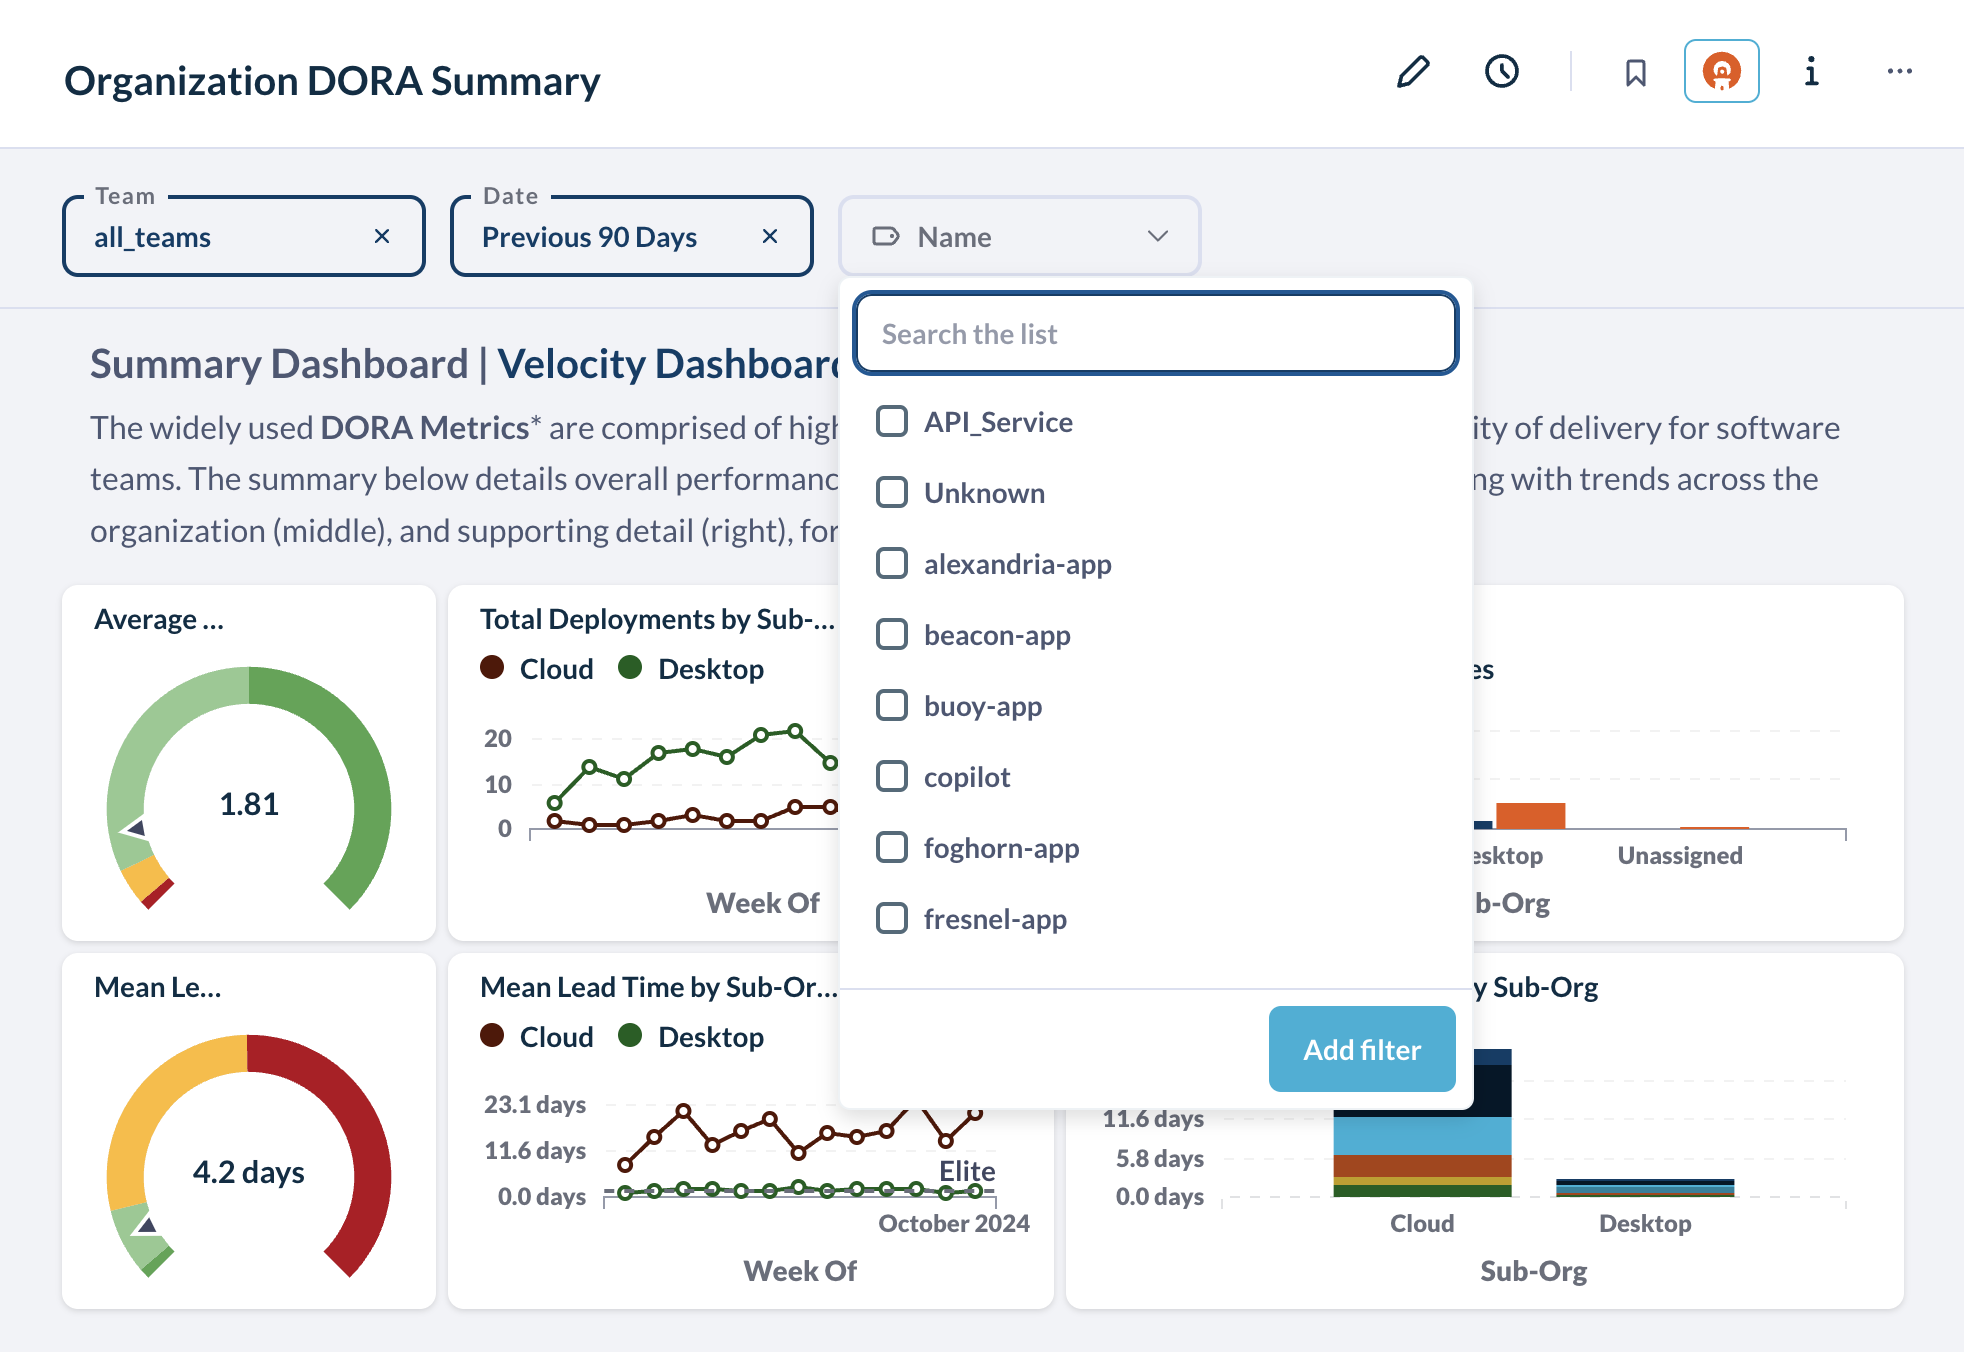
The field will auto-populate on all relevant charts
-
Label your filter and save
-
Your filter will now appear at the top of your dashboard
-
Editing Dashboards & Charts Collaboratively
In order for others to be able to view and edit your dashboards, they must be in the Shared reports folder. To edit, users must have an adequate user role assigned.
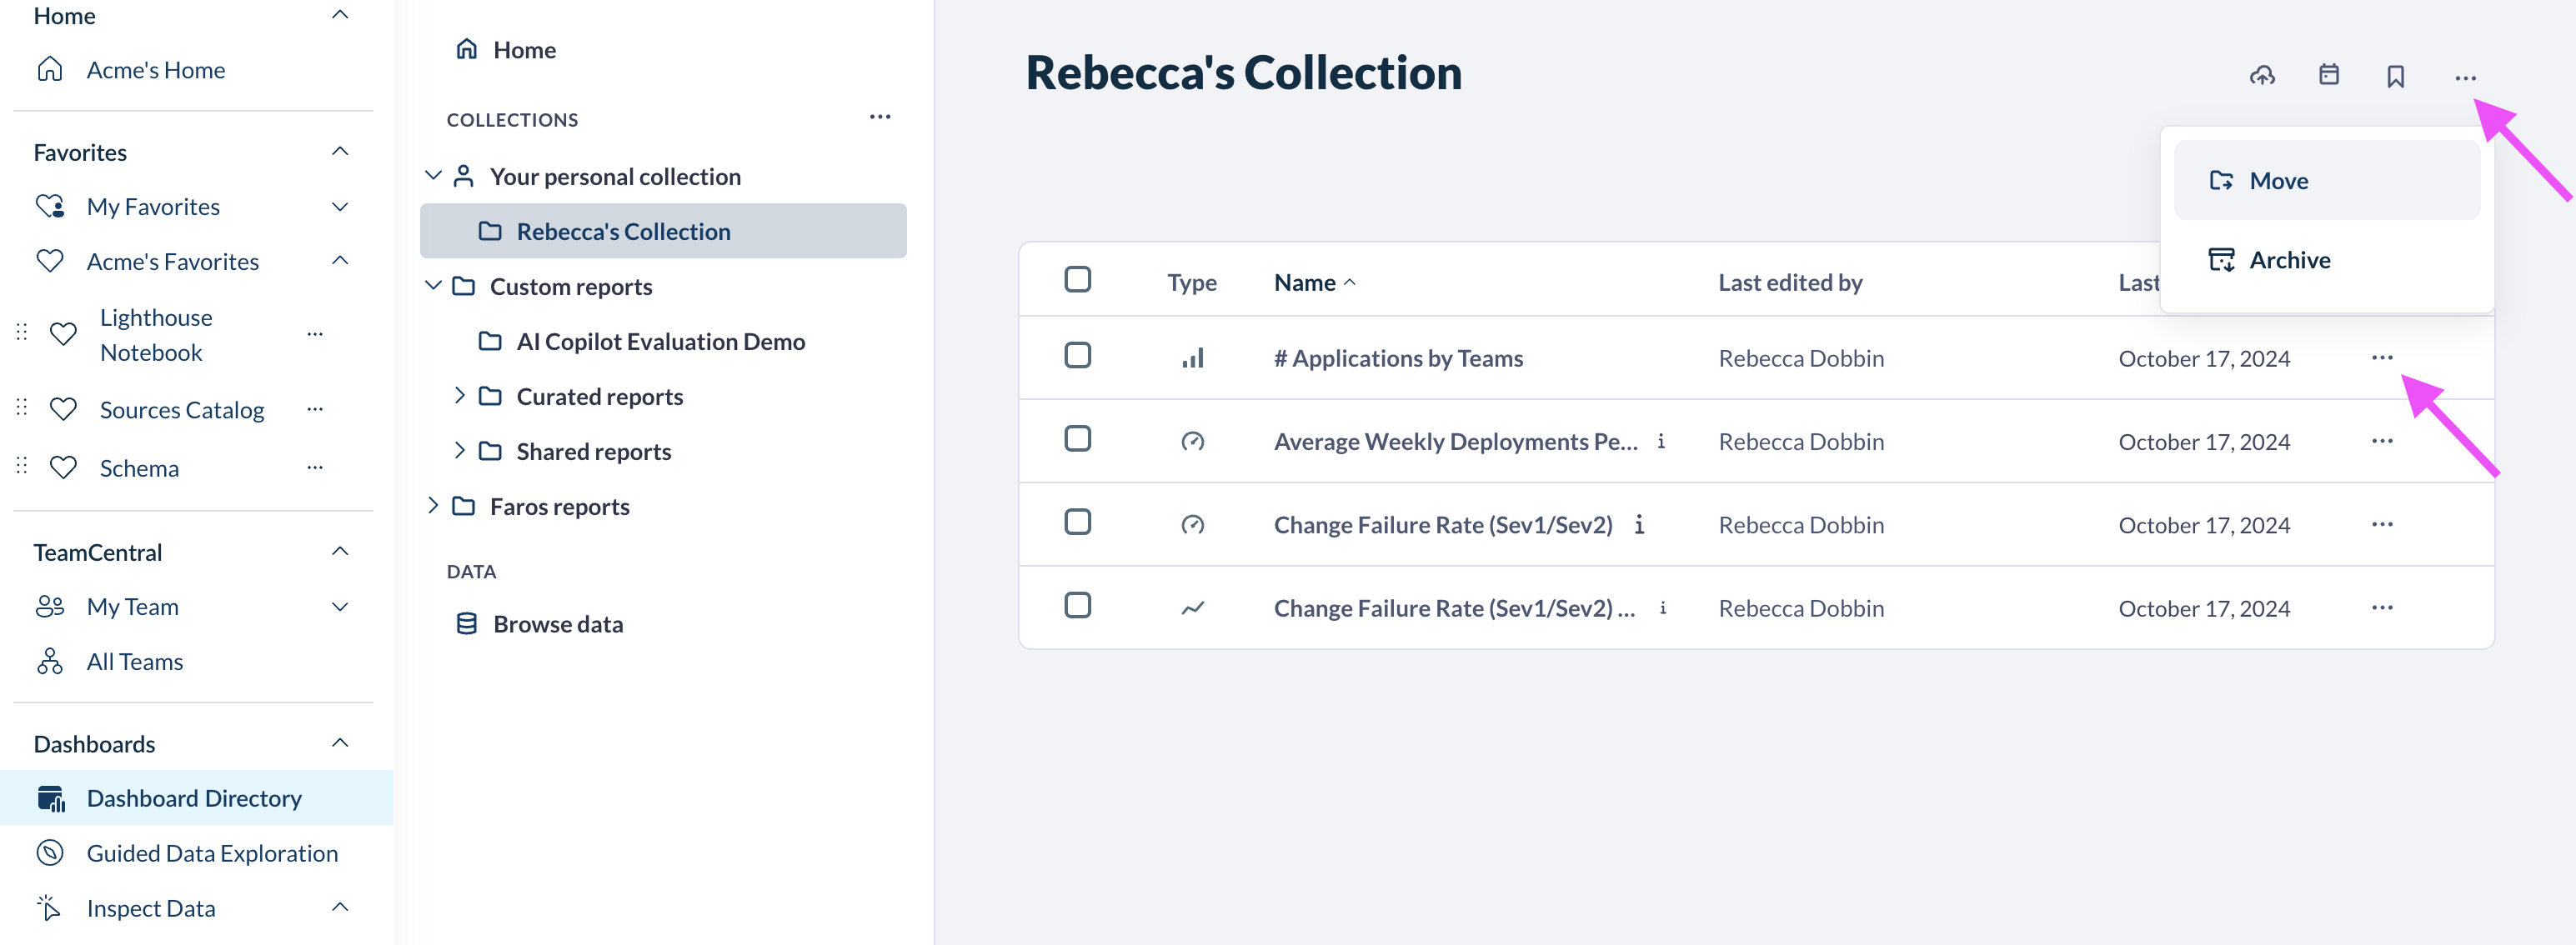
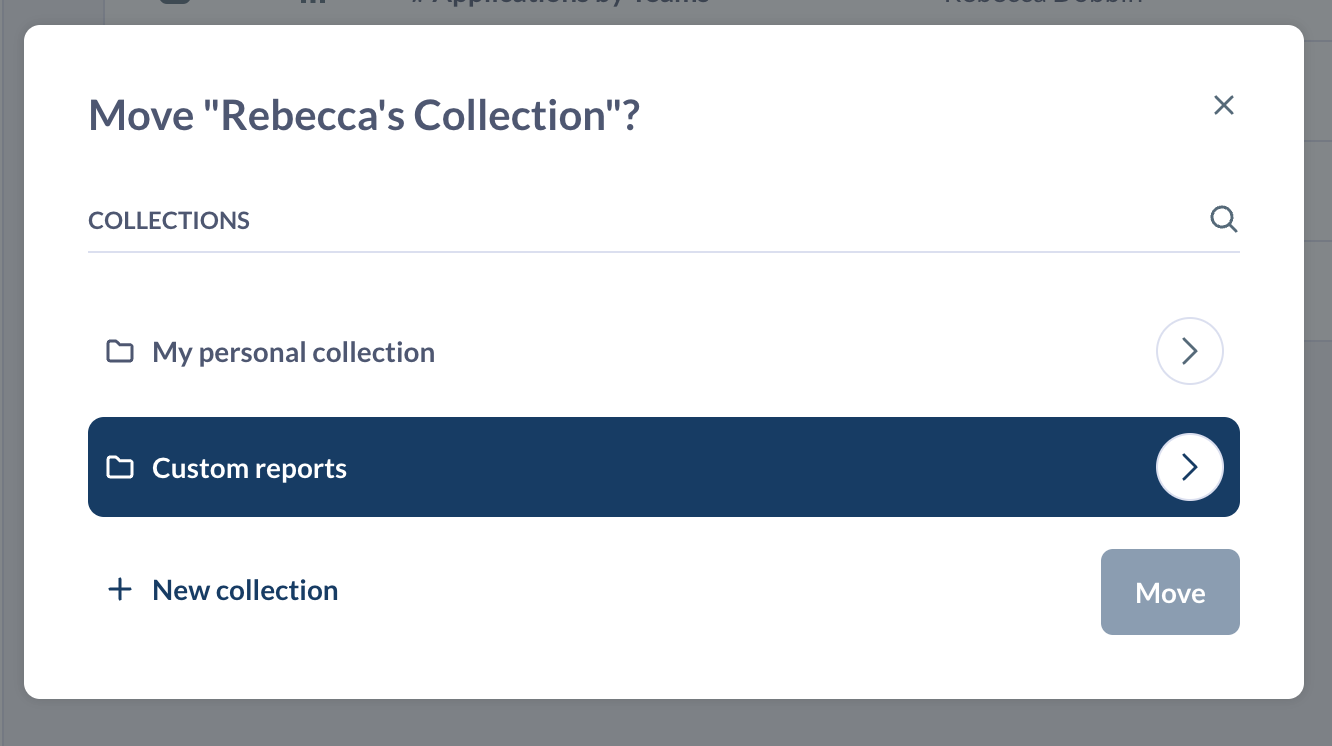
To move a dashboard to the shared reports folder:
-
Go to Dashboard Directory > Your personal collection
-
Click the ... and select Move either next to a collection or next to an individual chart

-
Move it to Custom Reports > Shared Reports
Creating a Dashboard from Scratch
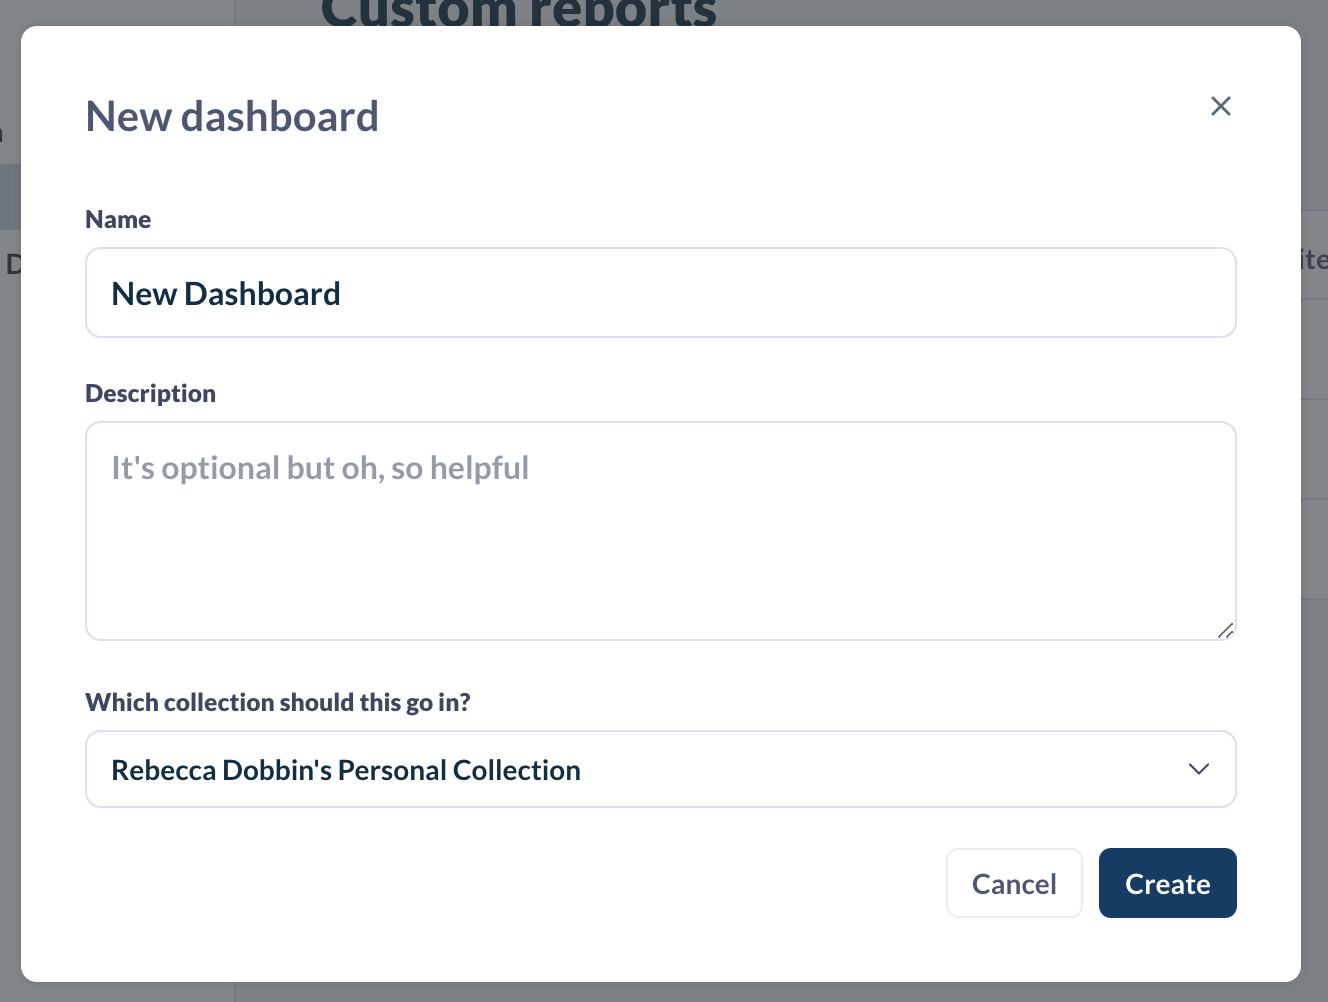
Sometimes you may want to start with a completely empty dashboard. In those cases, go to Dashboards > Dashboard Directory and select + New > Dashboard.
Name your dashboard, enter an optional description, and choose which folder you'd like it saved in. You can see more details on folders here.
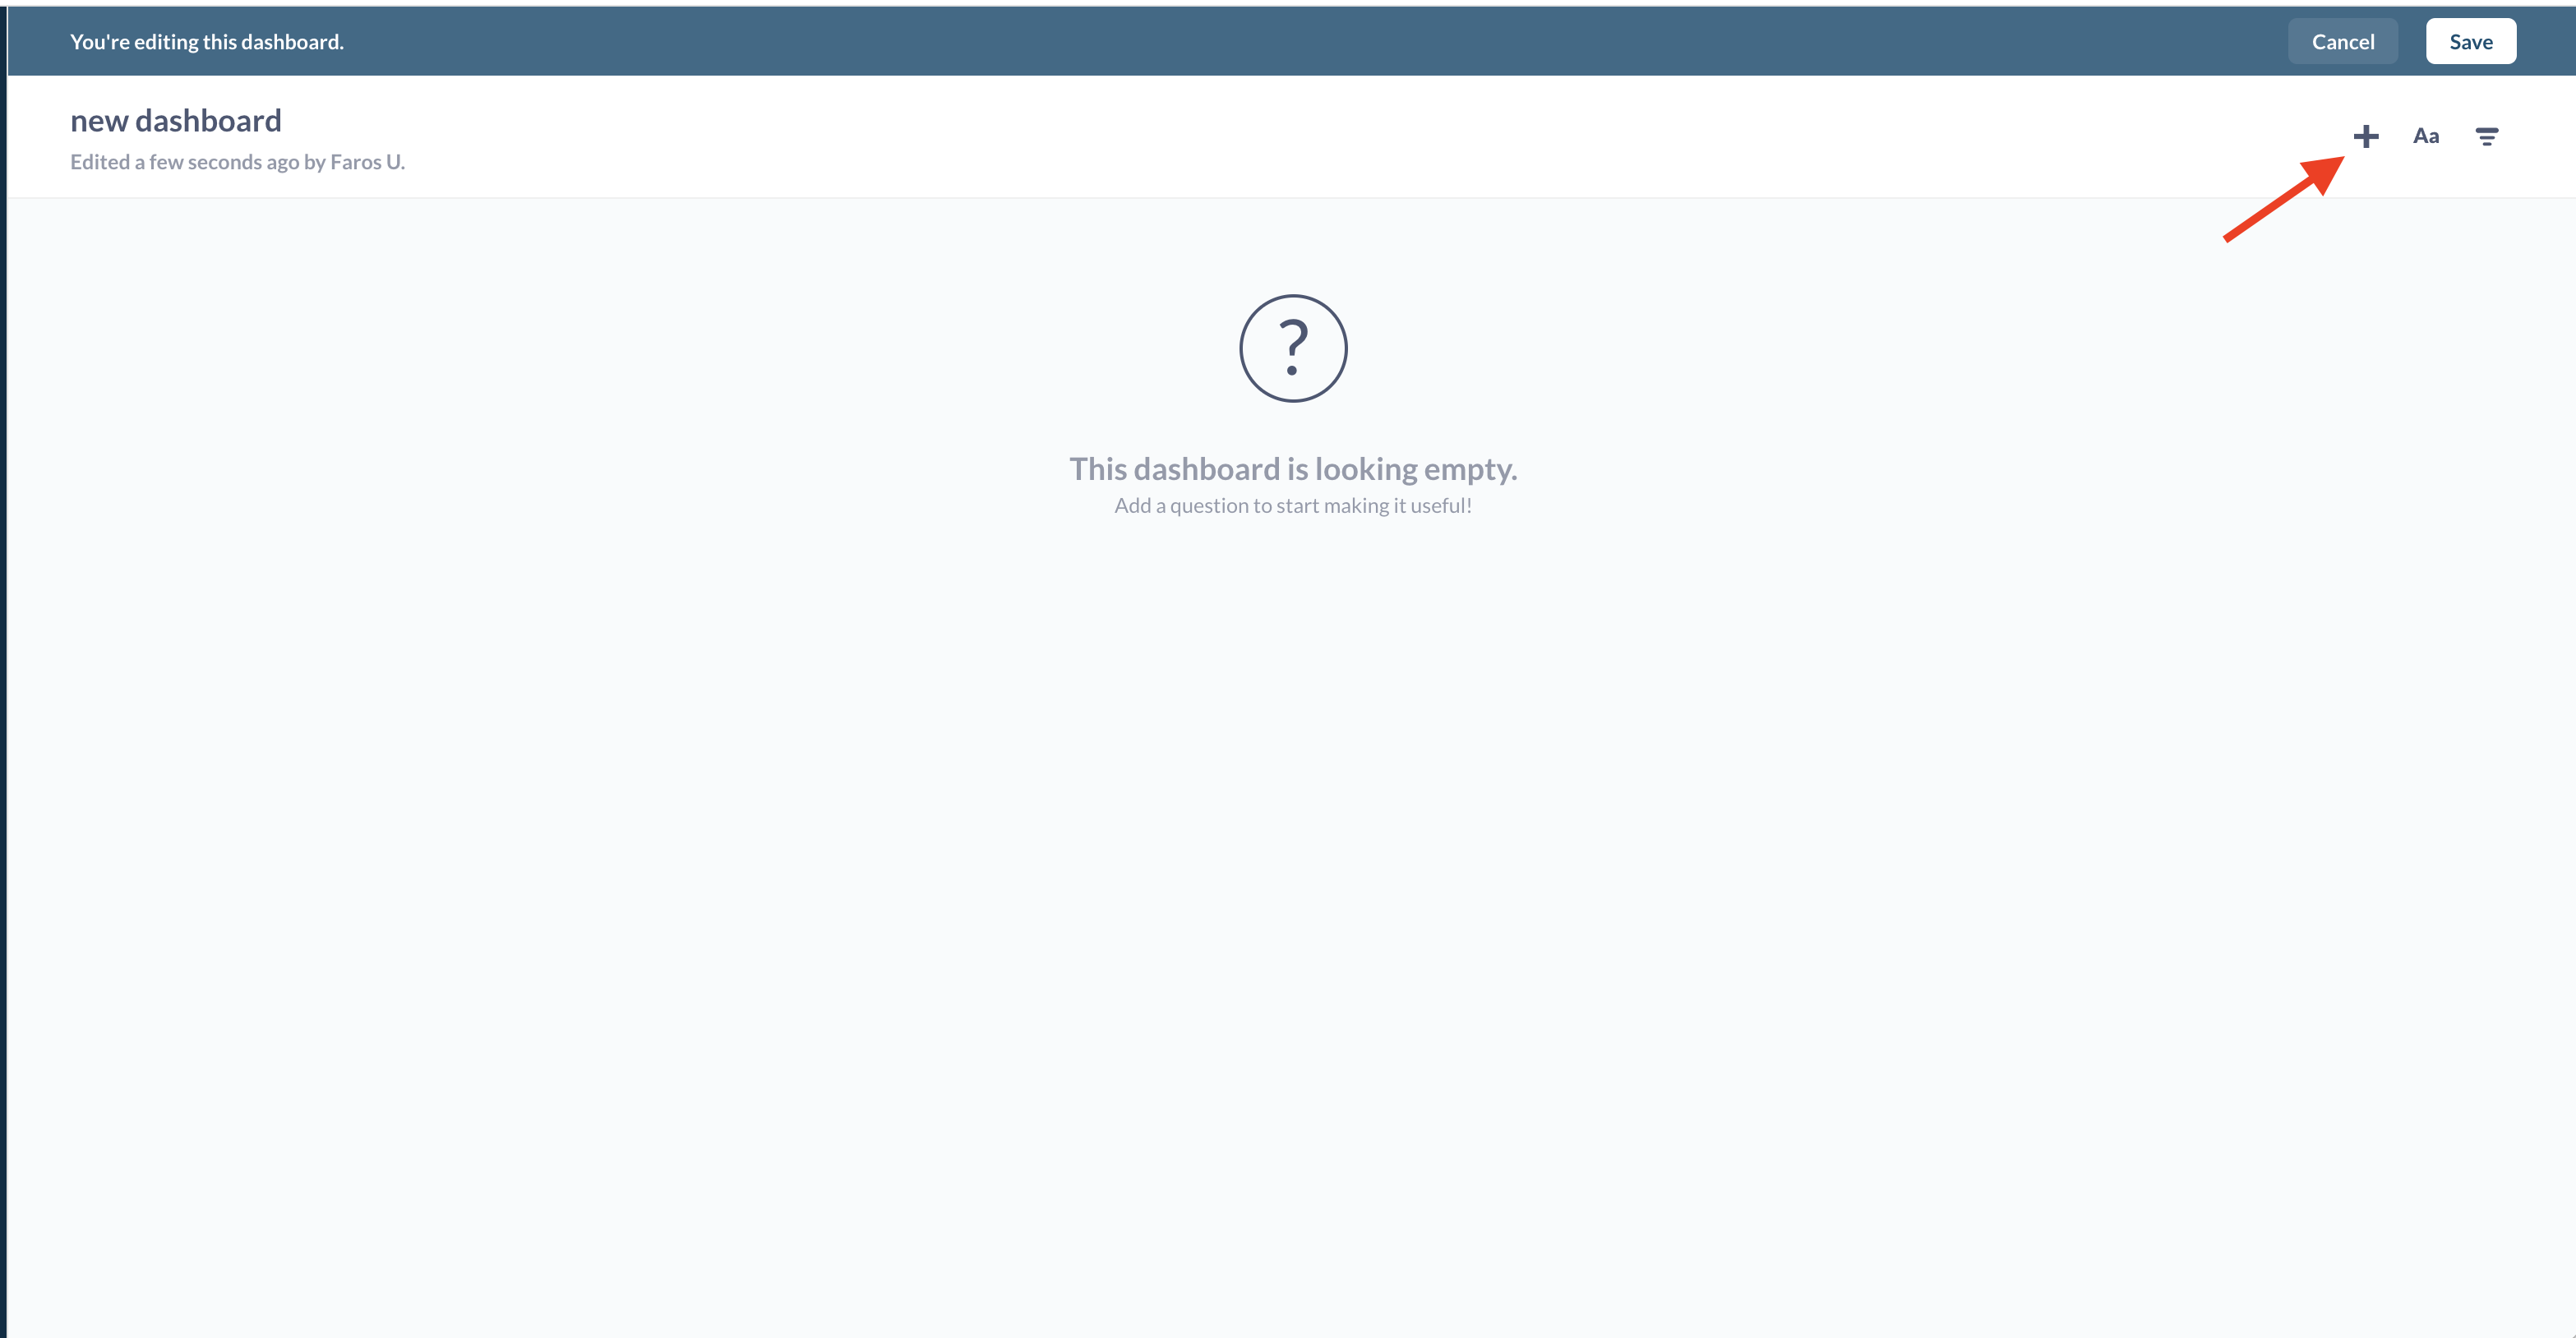
Interact with this new empty dashboard how you would with a duplicated dashboard. Click the pencil icon in the right to enter edit mode, then add a card by clicking the plus icon. You can add any Faros pre-built or custom card.
Tips & Tricks
See this page for additional tips and tricks for further customizing your charts or dashboards.
Updated 5 months ago