
Building Queries: Tips & Tricks
Intro
This doc provides additional information on building queries, such as:
- How to eliminate duplicate rows
- The difference between Faros Tag and Faros Tags
- Built-in Flows
- Aggregated Tables
- Team Metrics
You can find additional tips & tricks related to configuring your dashboards & charts here.
Duplicate Rows
Faros AI's schema avoids duplicate rows wherever possible, but there are a few areas where they may arise.
While pre-built charts & dashboards have default filters to avoid duplicates, when looking at individual charts without pre-defined filters, it can be important to ensure duplicate rows do not exist.
To avoid double-counting, you can do the following:
- For all cases (including aggregations like average or sum), use a filter (see sections below for details)
- For counts, use the 'distinct values of...' value in your queries
Since duplicates could occur for multiple reasons, we recommend reading each section below for details.
Task Table
In order to track all relevant tasks for a user, Faros AI keeps track each time a task is reassigned to a new person, which creates duplicate rows for each assignee. The Last Assignee field tells you if someone is the most recent assignee, and can be used to eliminate duplicates.
As you can see in the screenshot below, duplicate rows appear when a task has been re-assigned to multiple users. When Last Assignee (the rightmost row in the screenshot below) is 1, it means that the row identifies the user most recently assigned to the task.
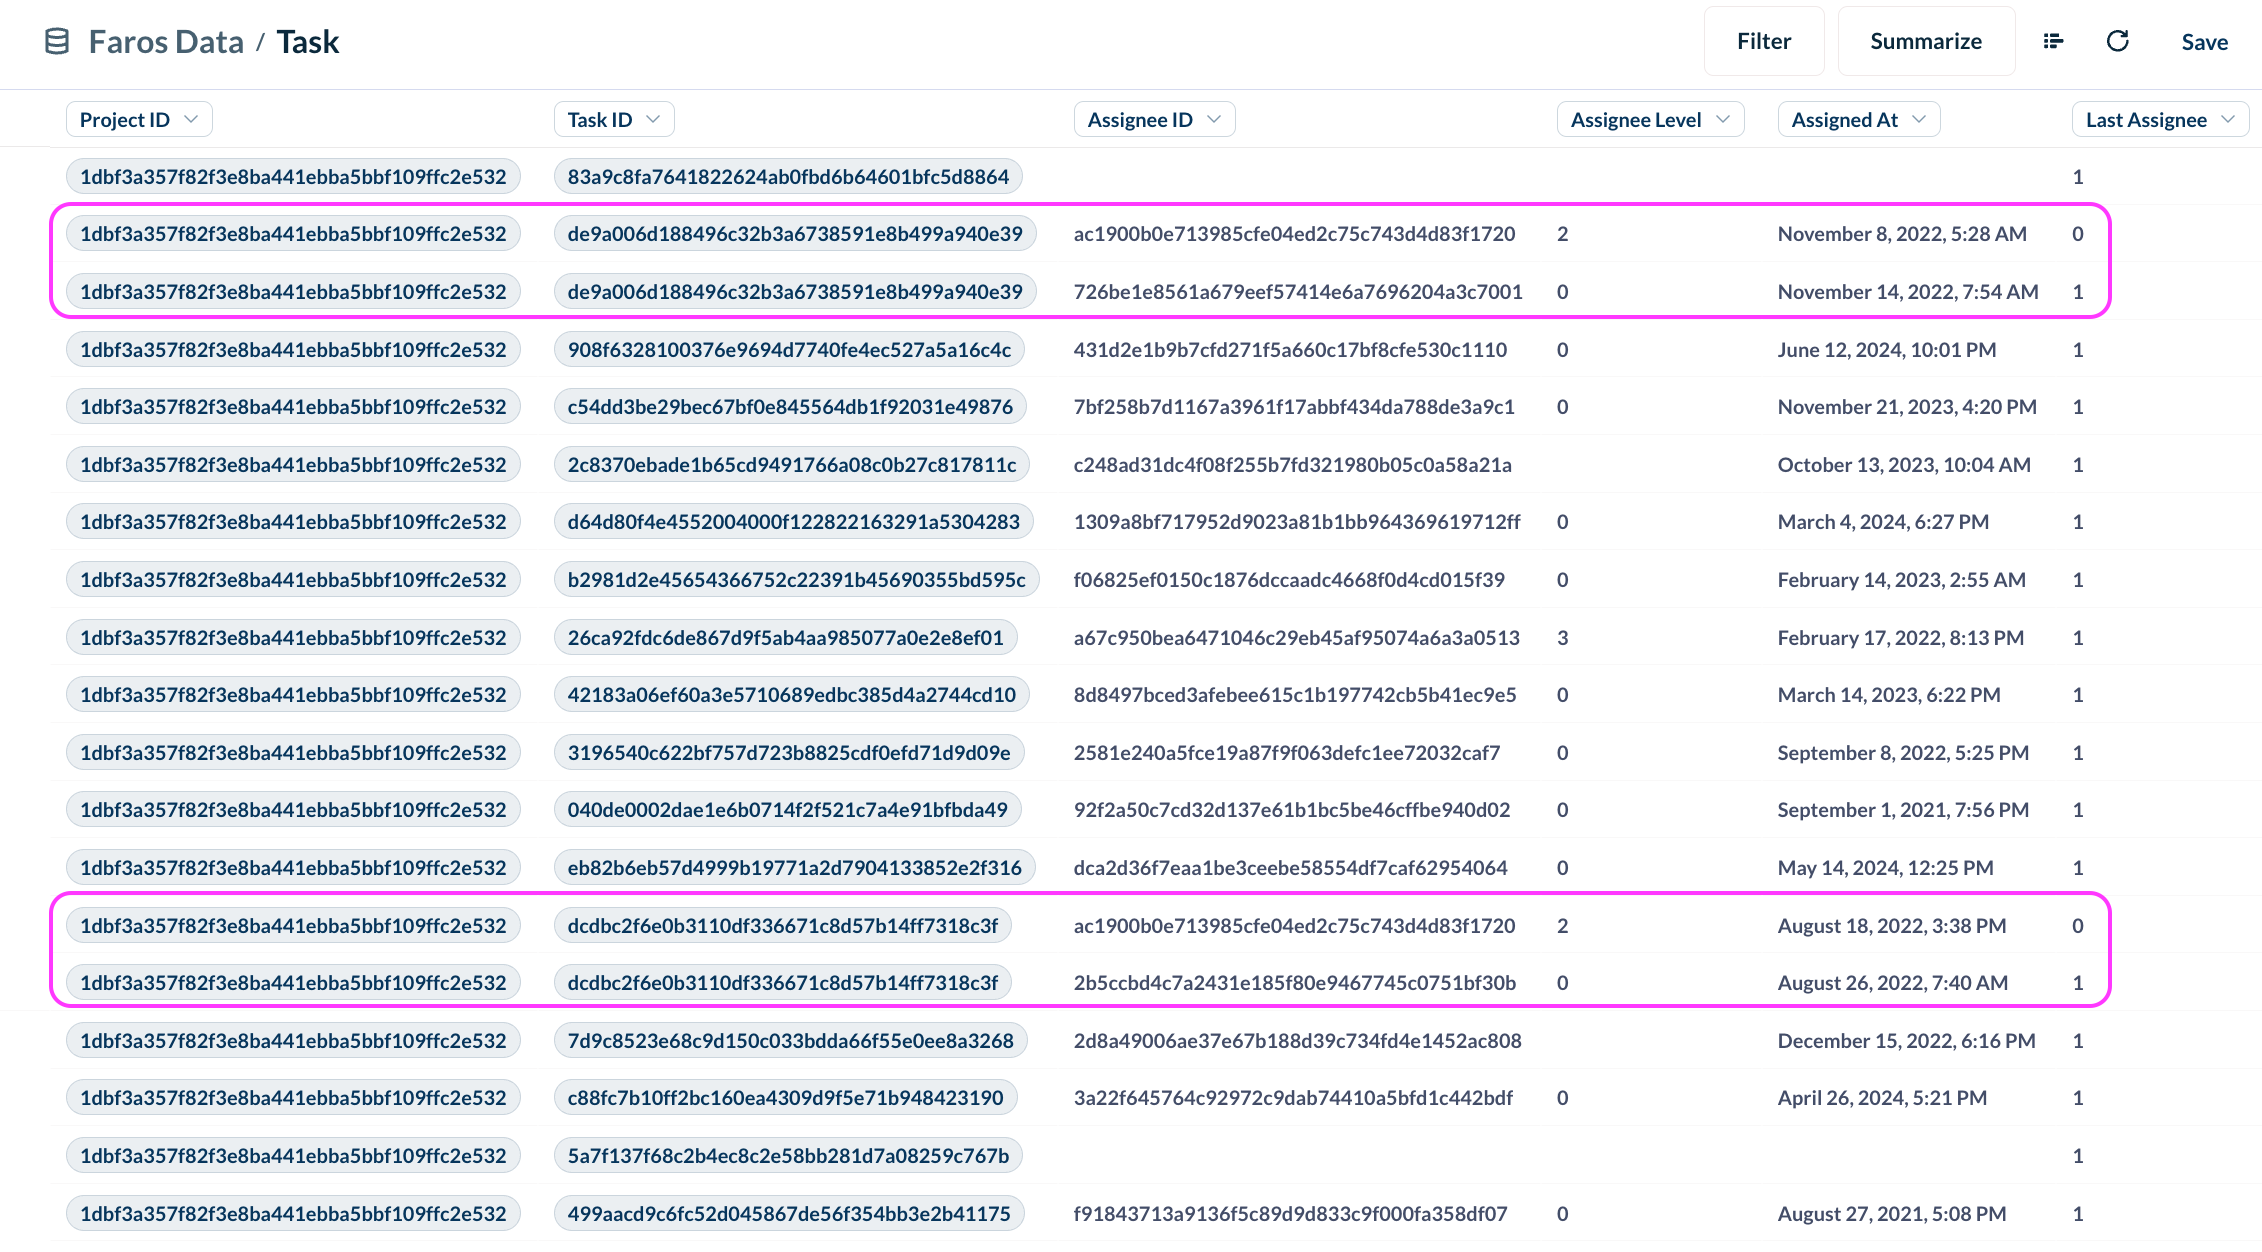
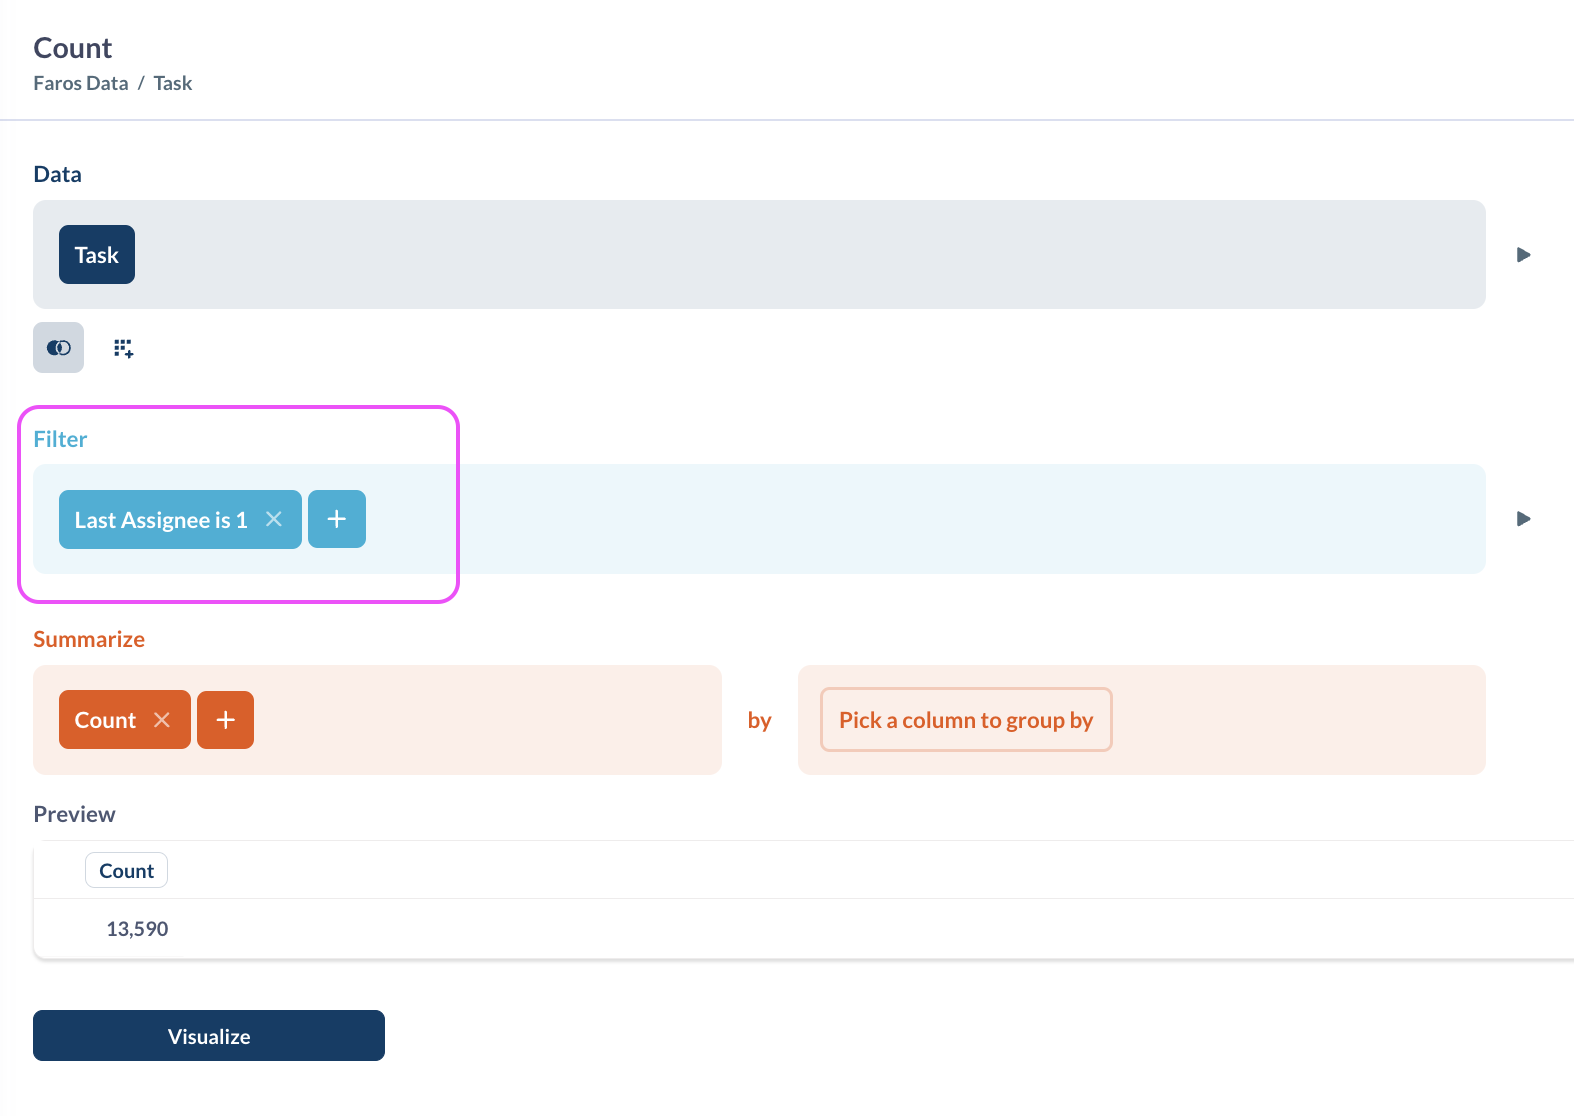
You can use the filter Last Assignee is 1 to eliminate duplicate task rows.
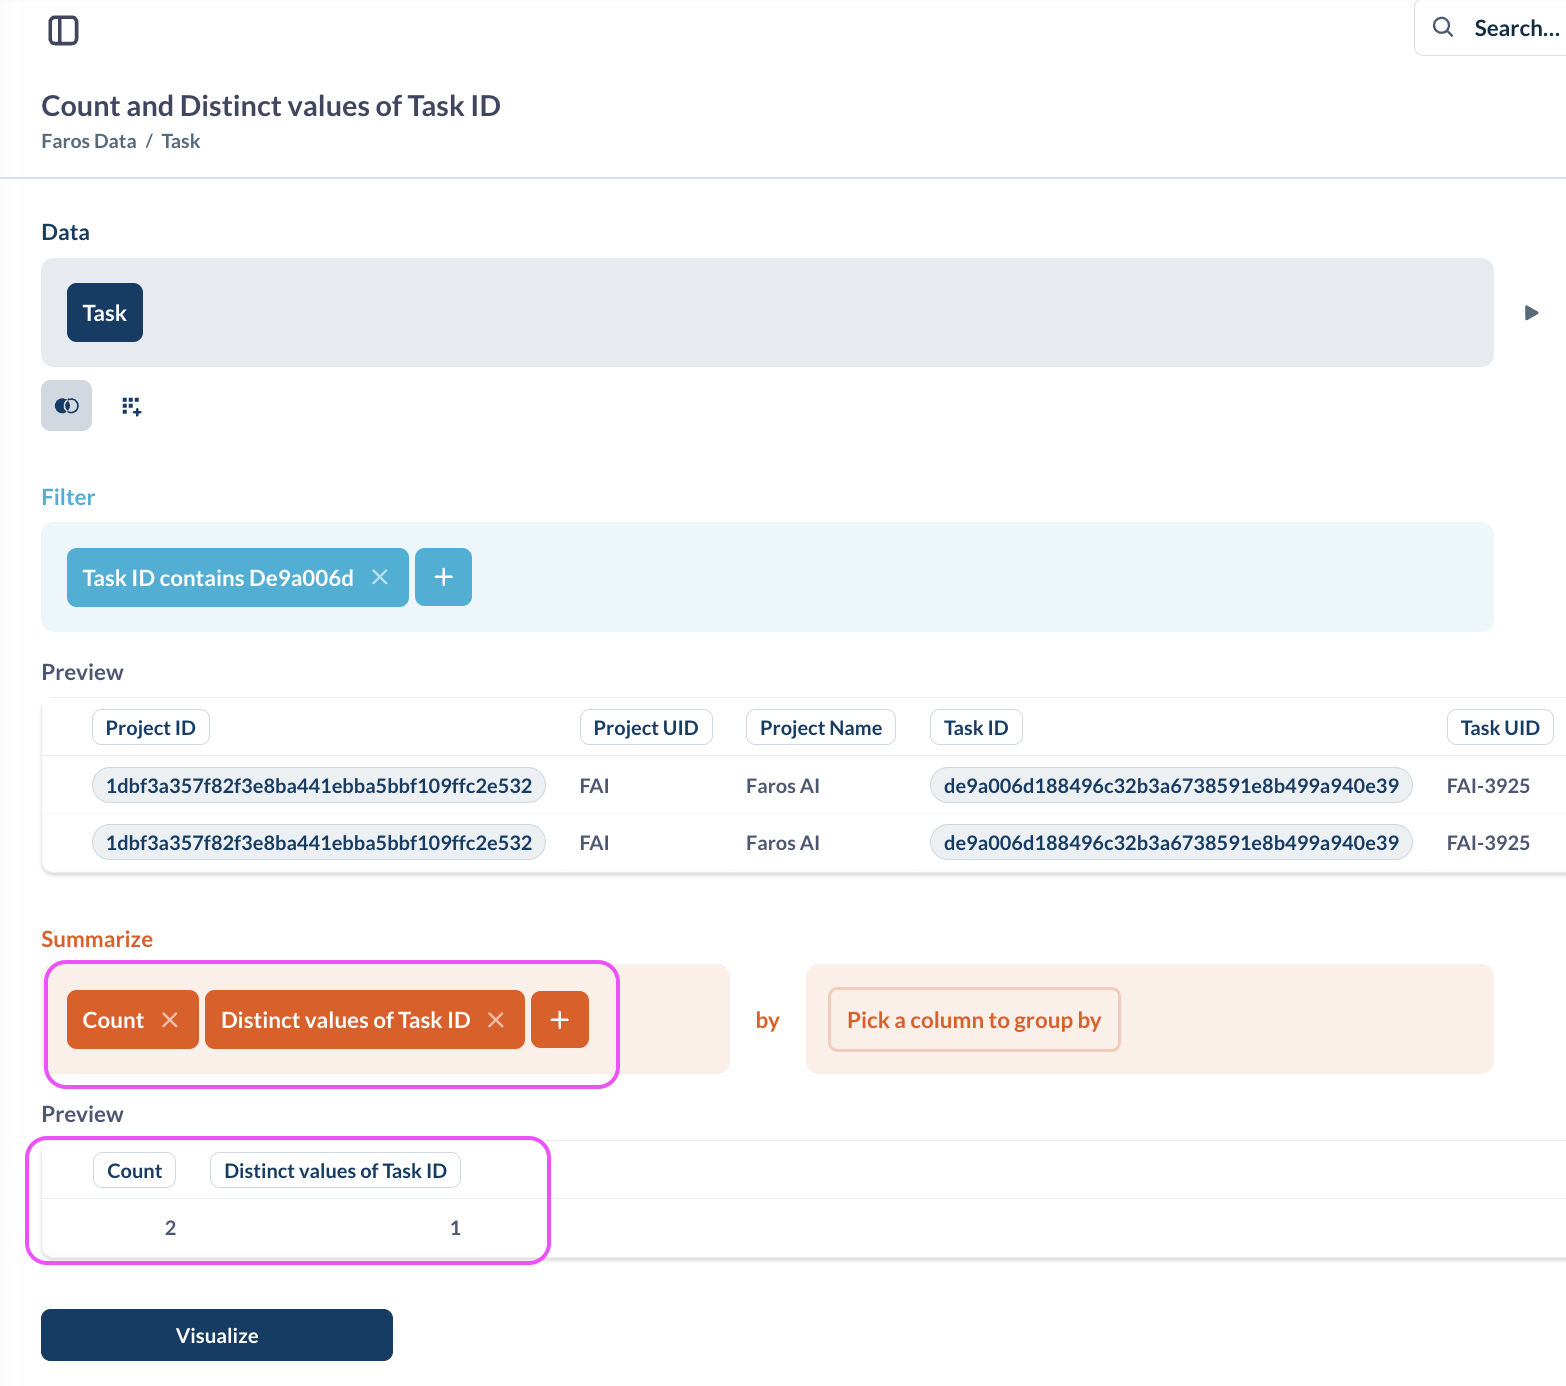
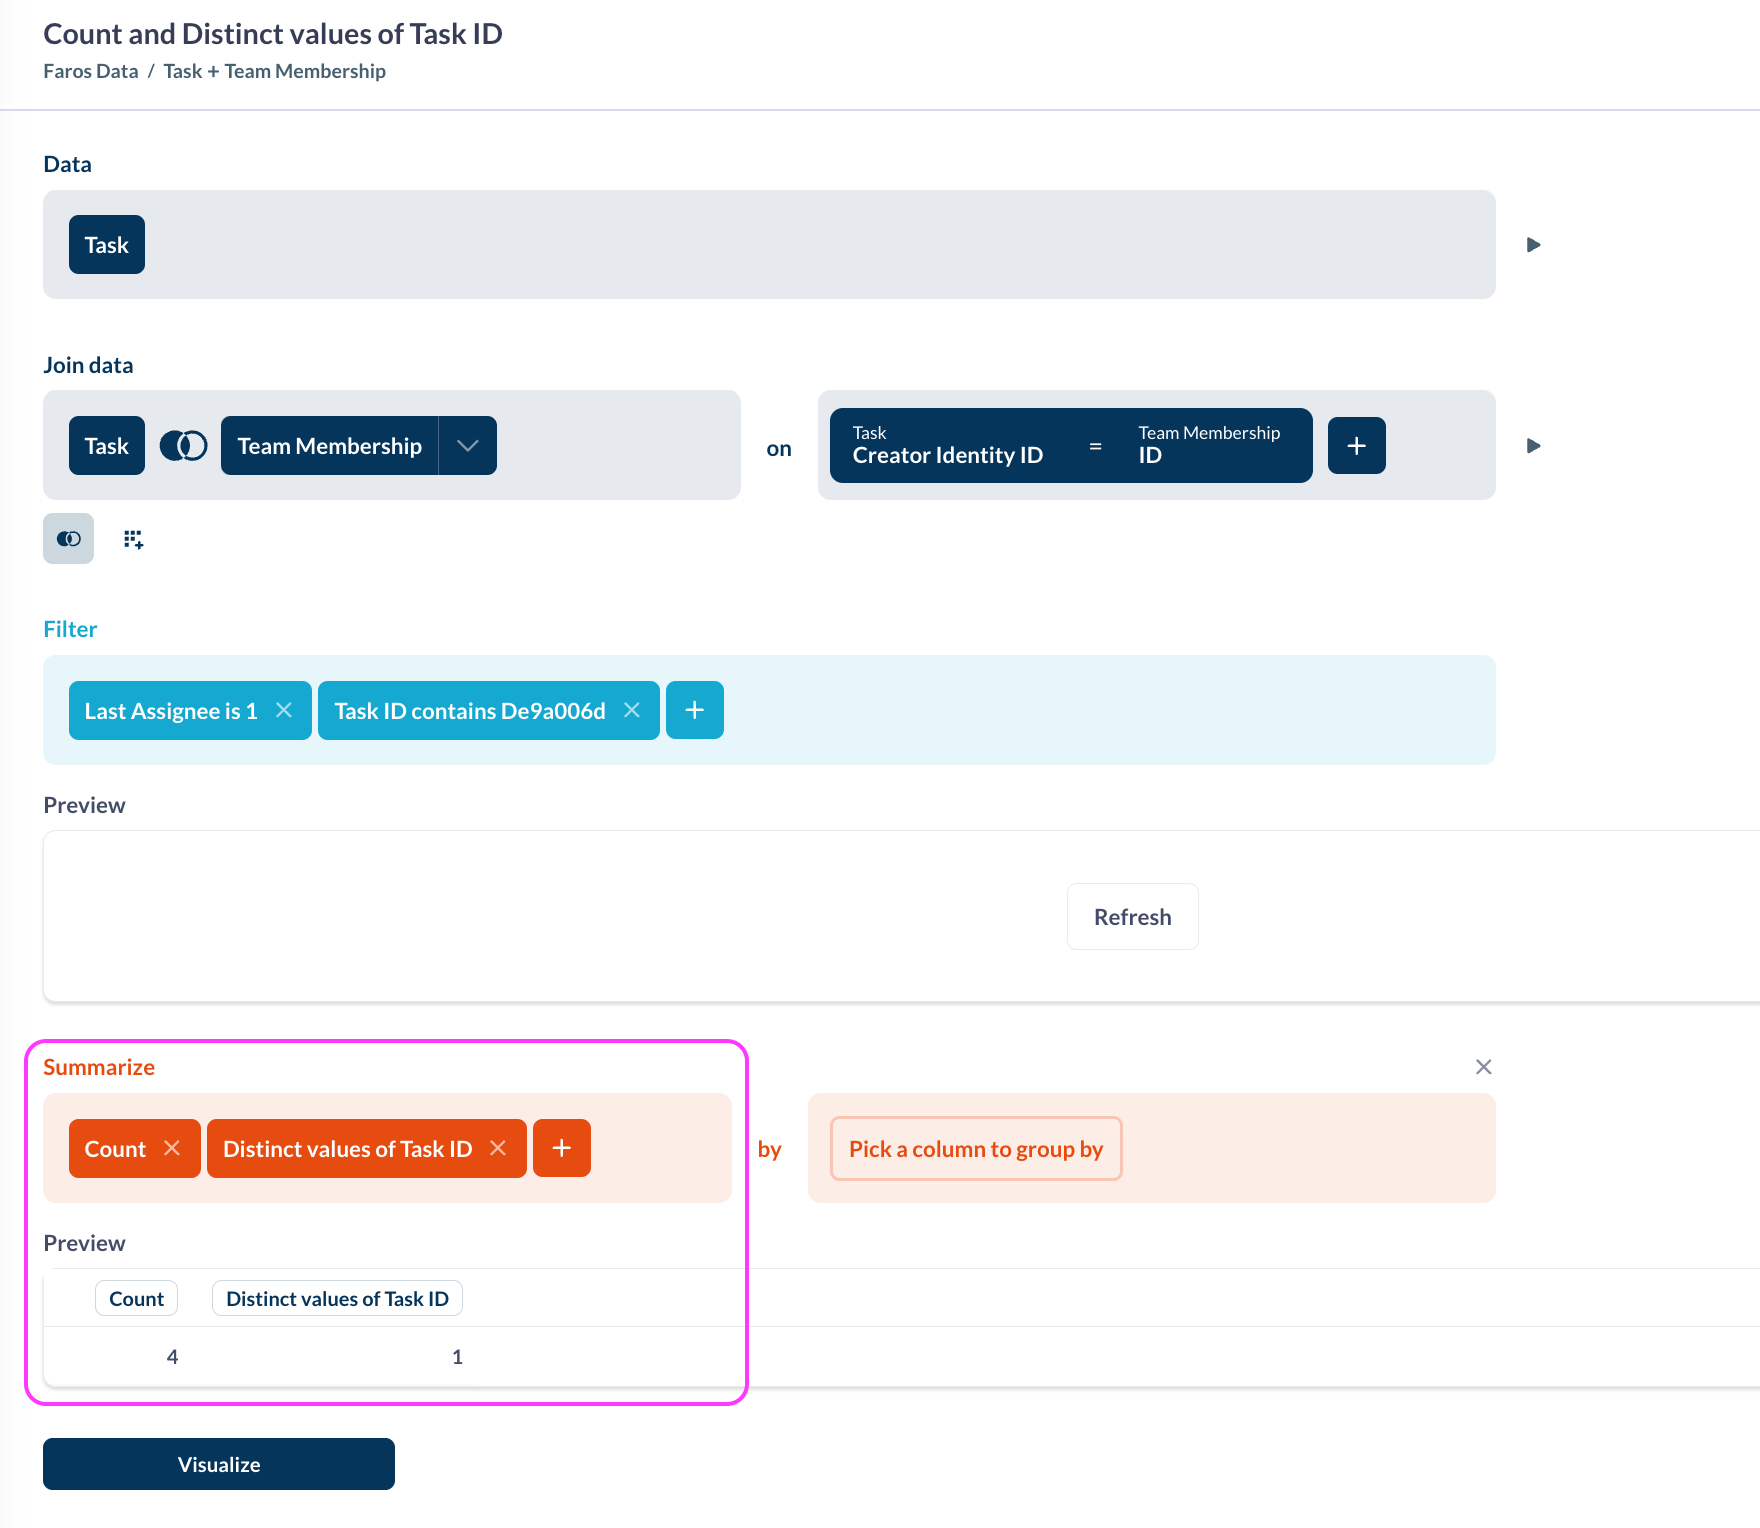
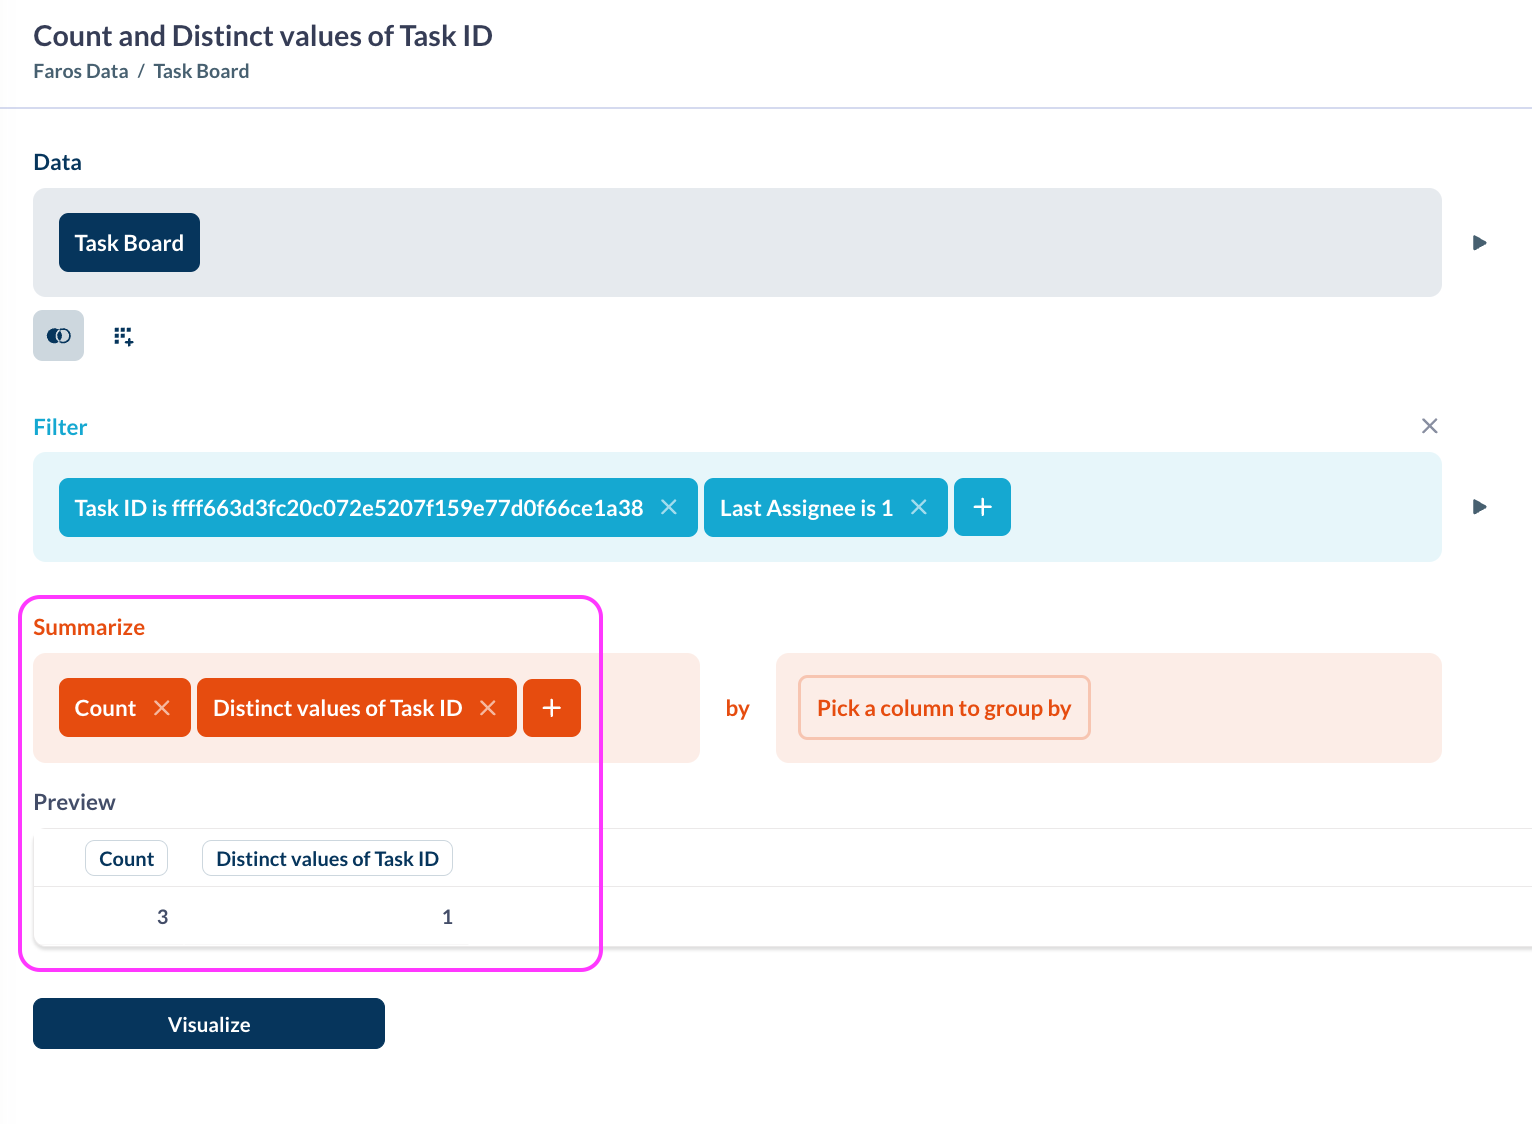
Another way to eliminate duplicates when generating a count, is to use the Distinct Values of field, rather than the Count field. As you can see in the screenshot below, when we search for a specific task ID, the Count is 2 (due to that task having been reassigned once), but the Distinct Value is 1.
Team Structure
Faros AI allows you to import your org chart so that you can slice data by teams at various levels within your organization.
However, duplicates may occur when joining a table (for example, task) with the team membership table. This is because each task will appear once for each level of the org chart that it is assigned to.
To remedy this, you can use a team filter or ensure you are using the Distinct Count field.
Note that most of the pre-built dashboards in Faros AI are already configured with a dashboard-level team filter. It's ok to leave duplicates by team, for example, if you're planning on filtering later at the dashboard level.
Let's look at an example.
You can see your org chart using the chart view in Admin Settings > Organization Setup > Team
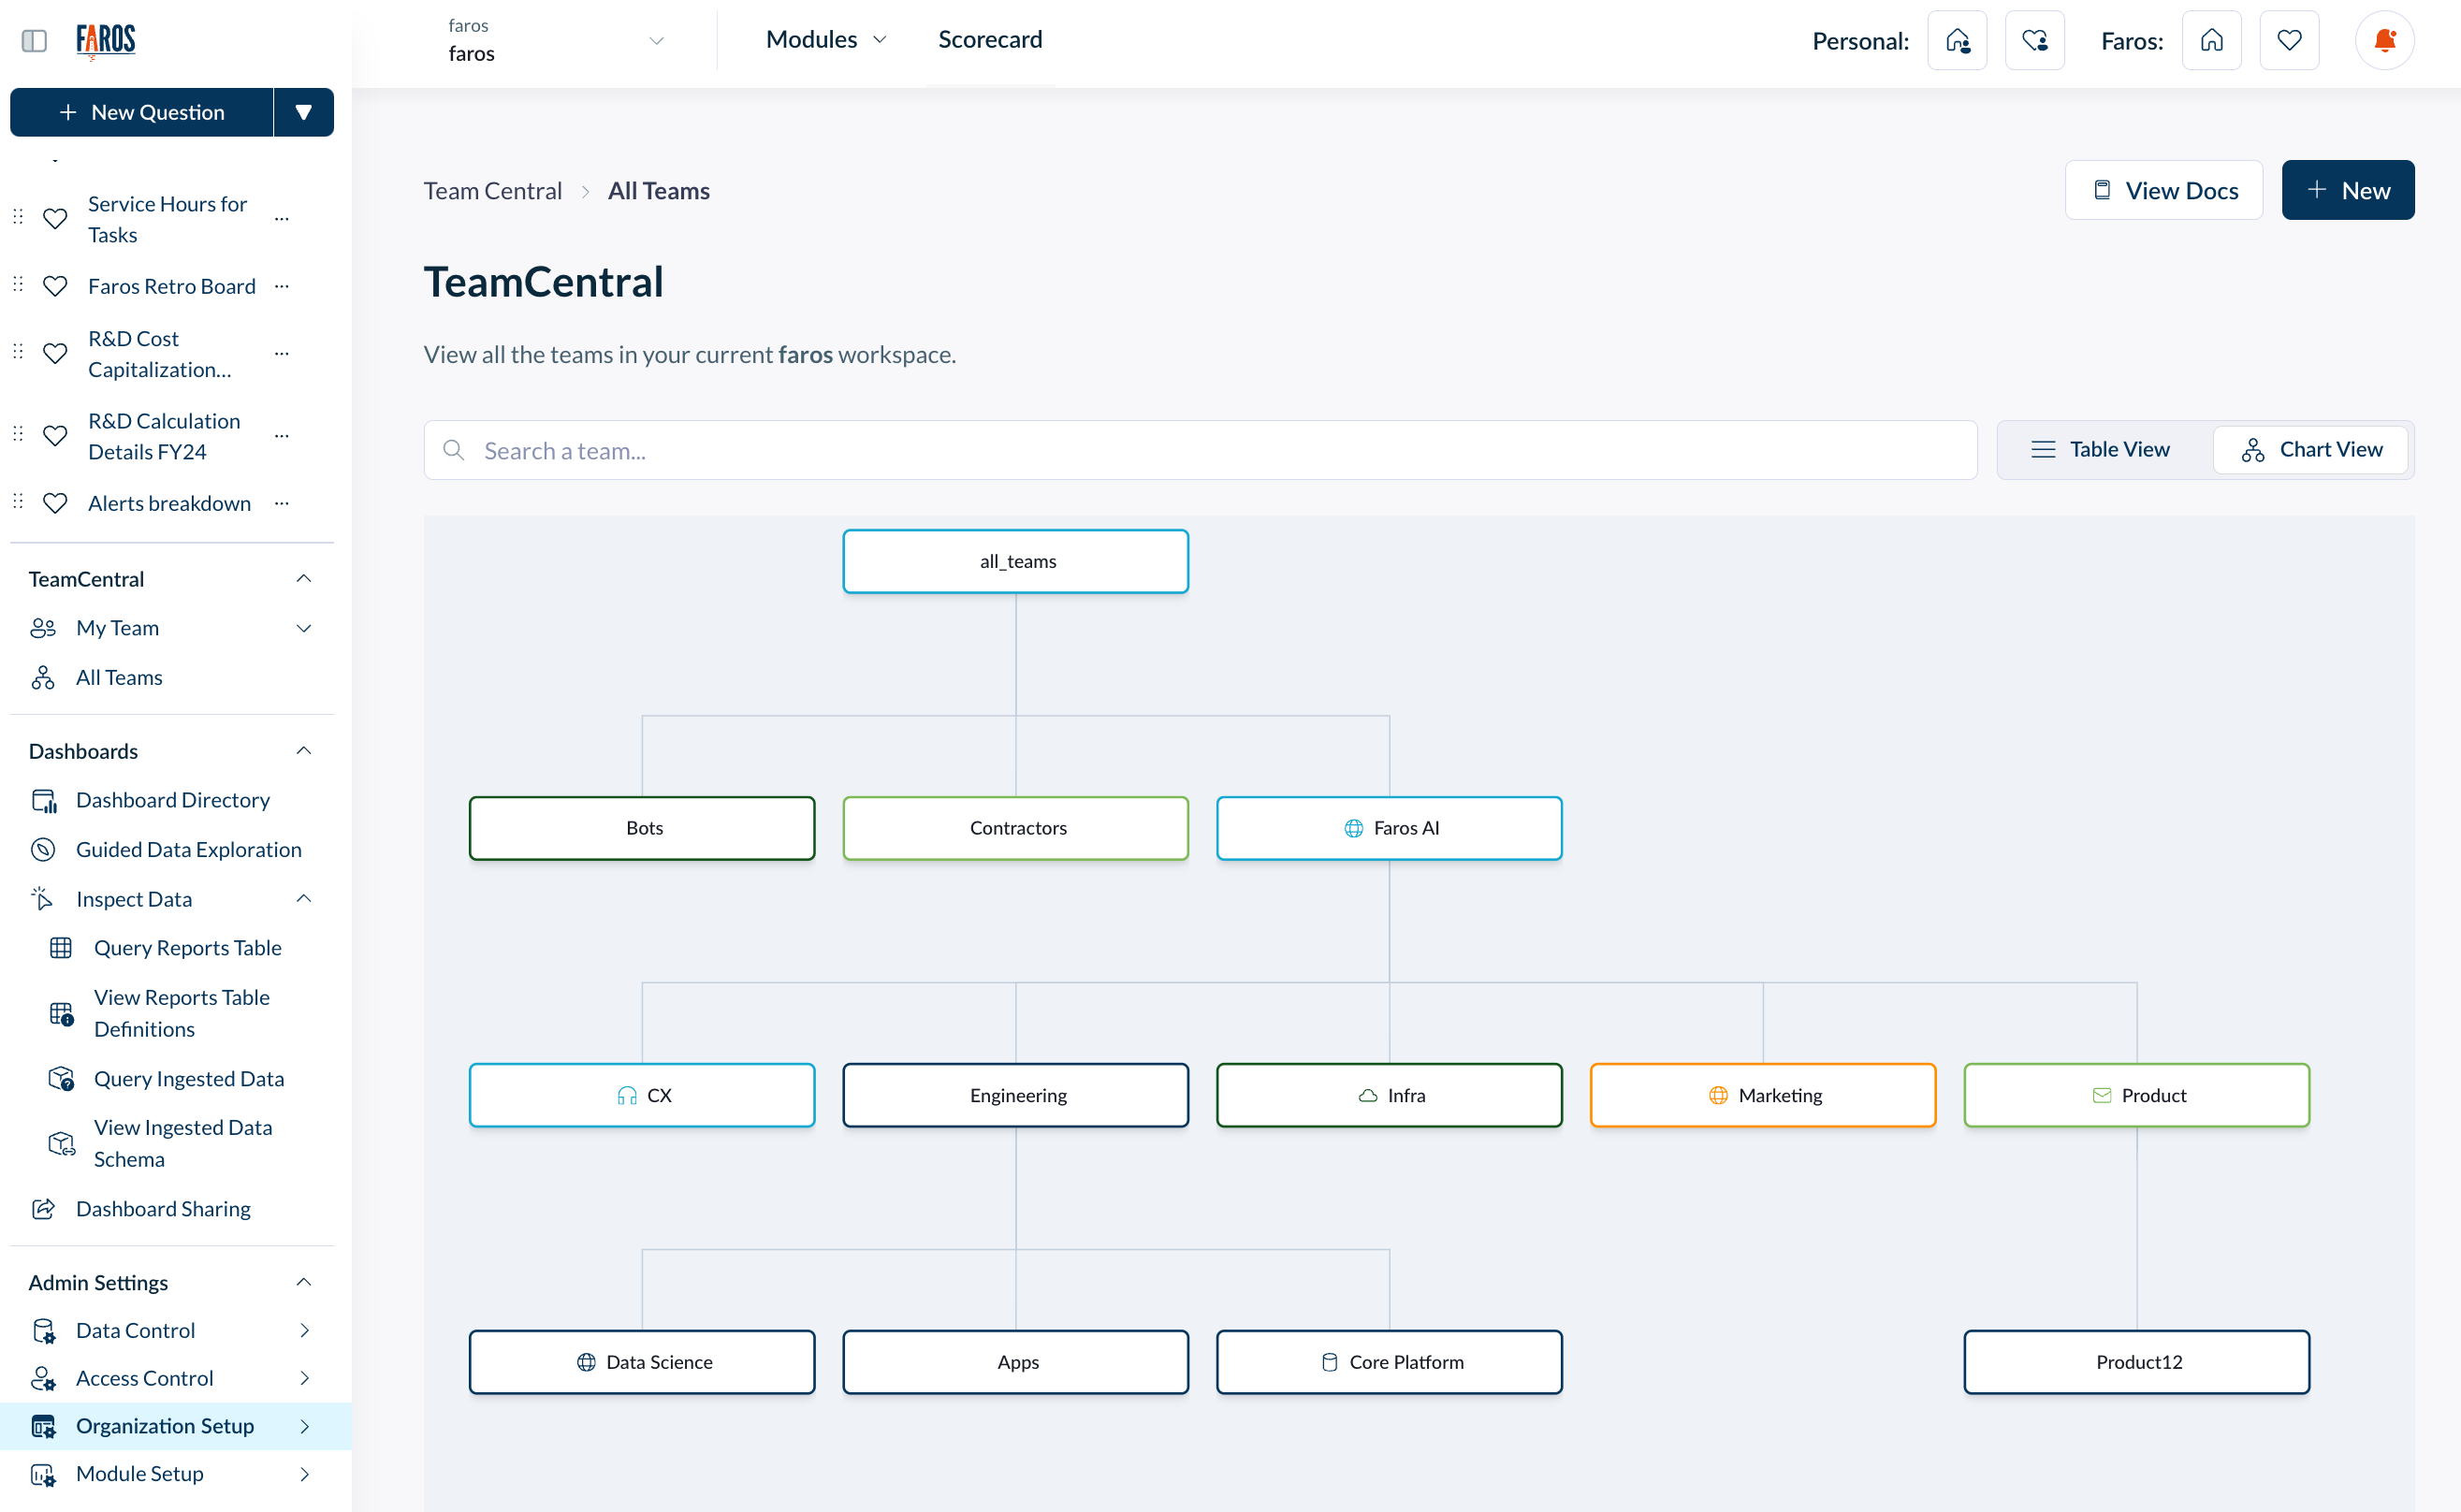
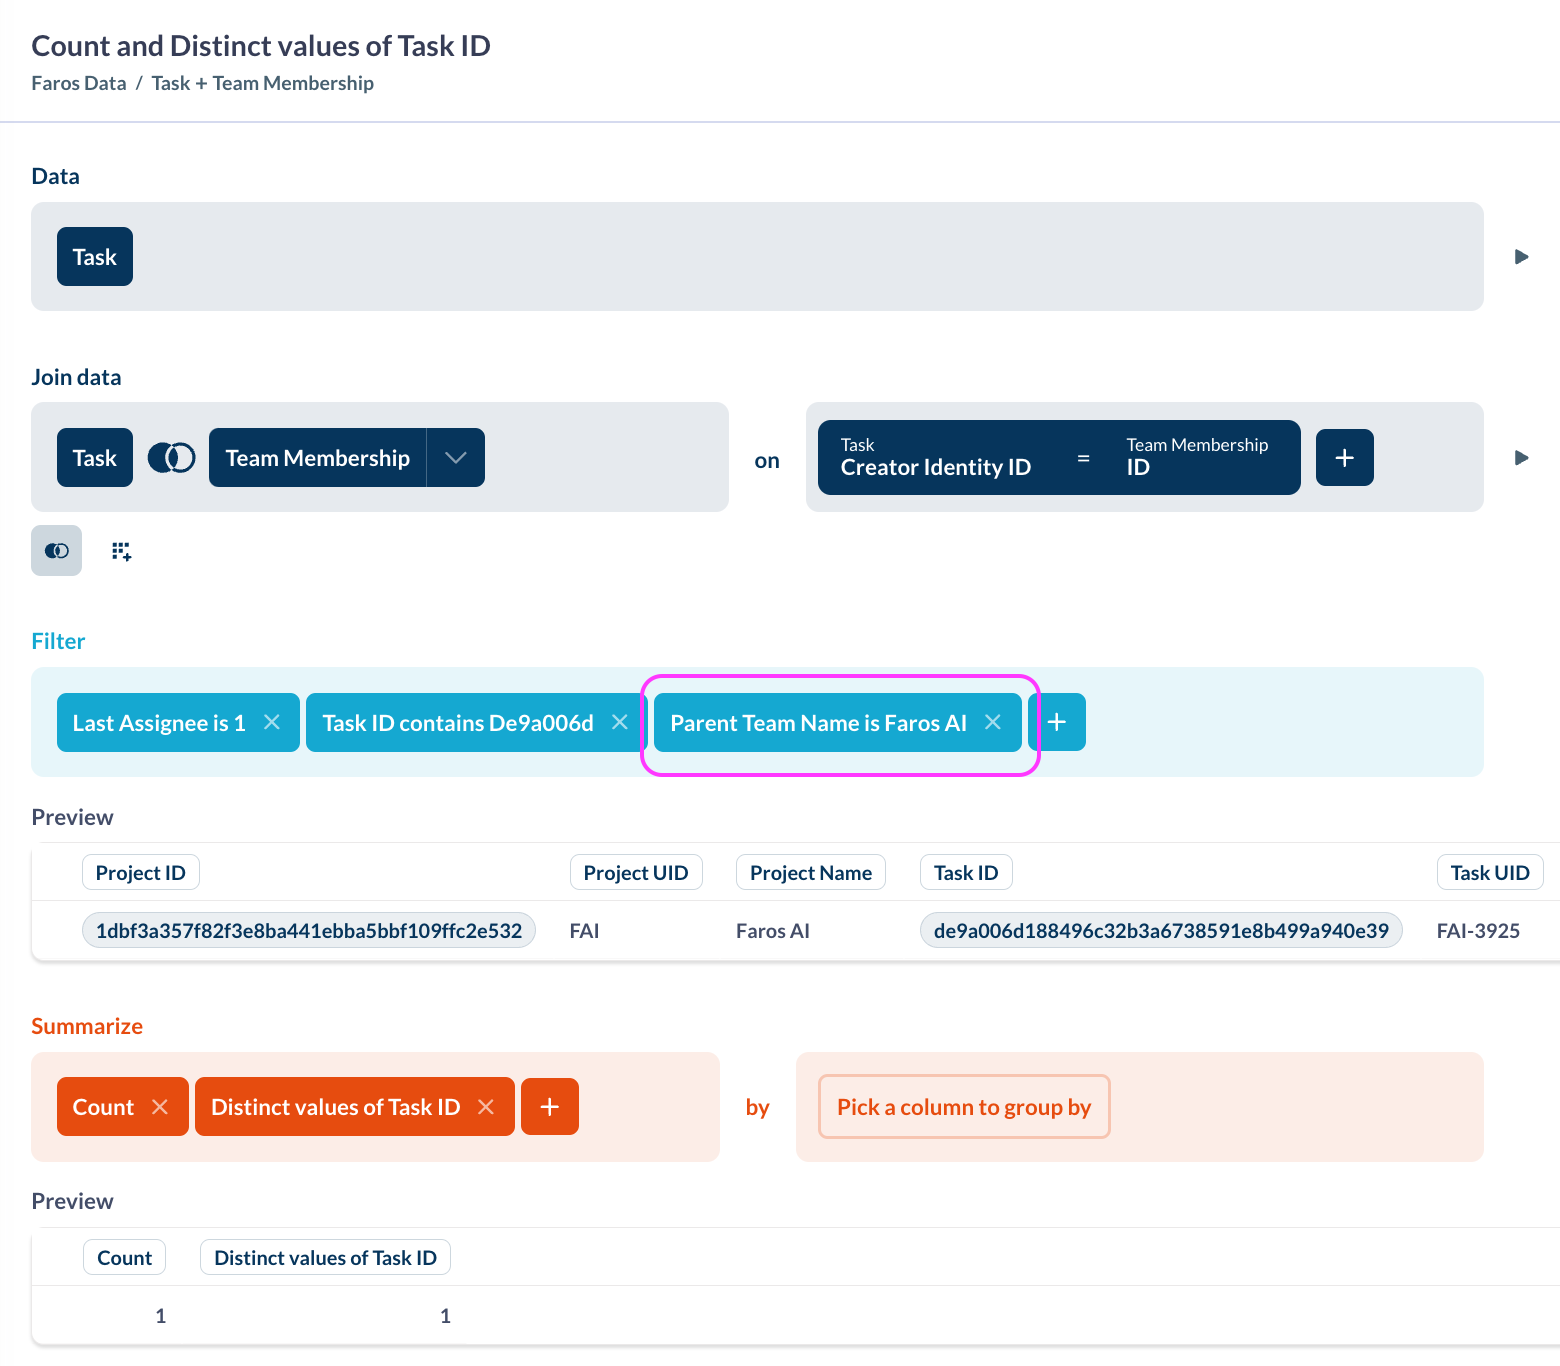
When I join the task table with the team membership table, you'll see that multiple rows are generated for the same task, each showing a team at a different level in the org chart.
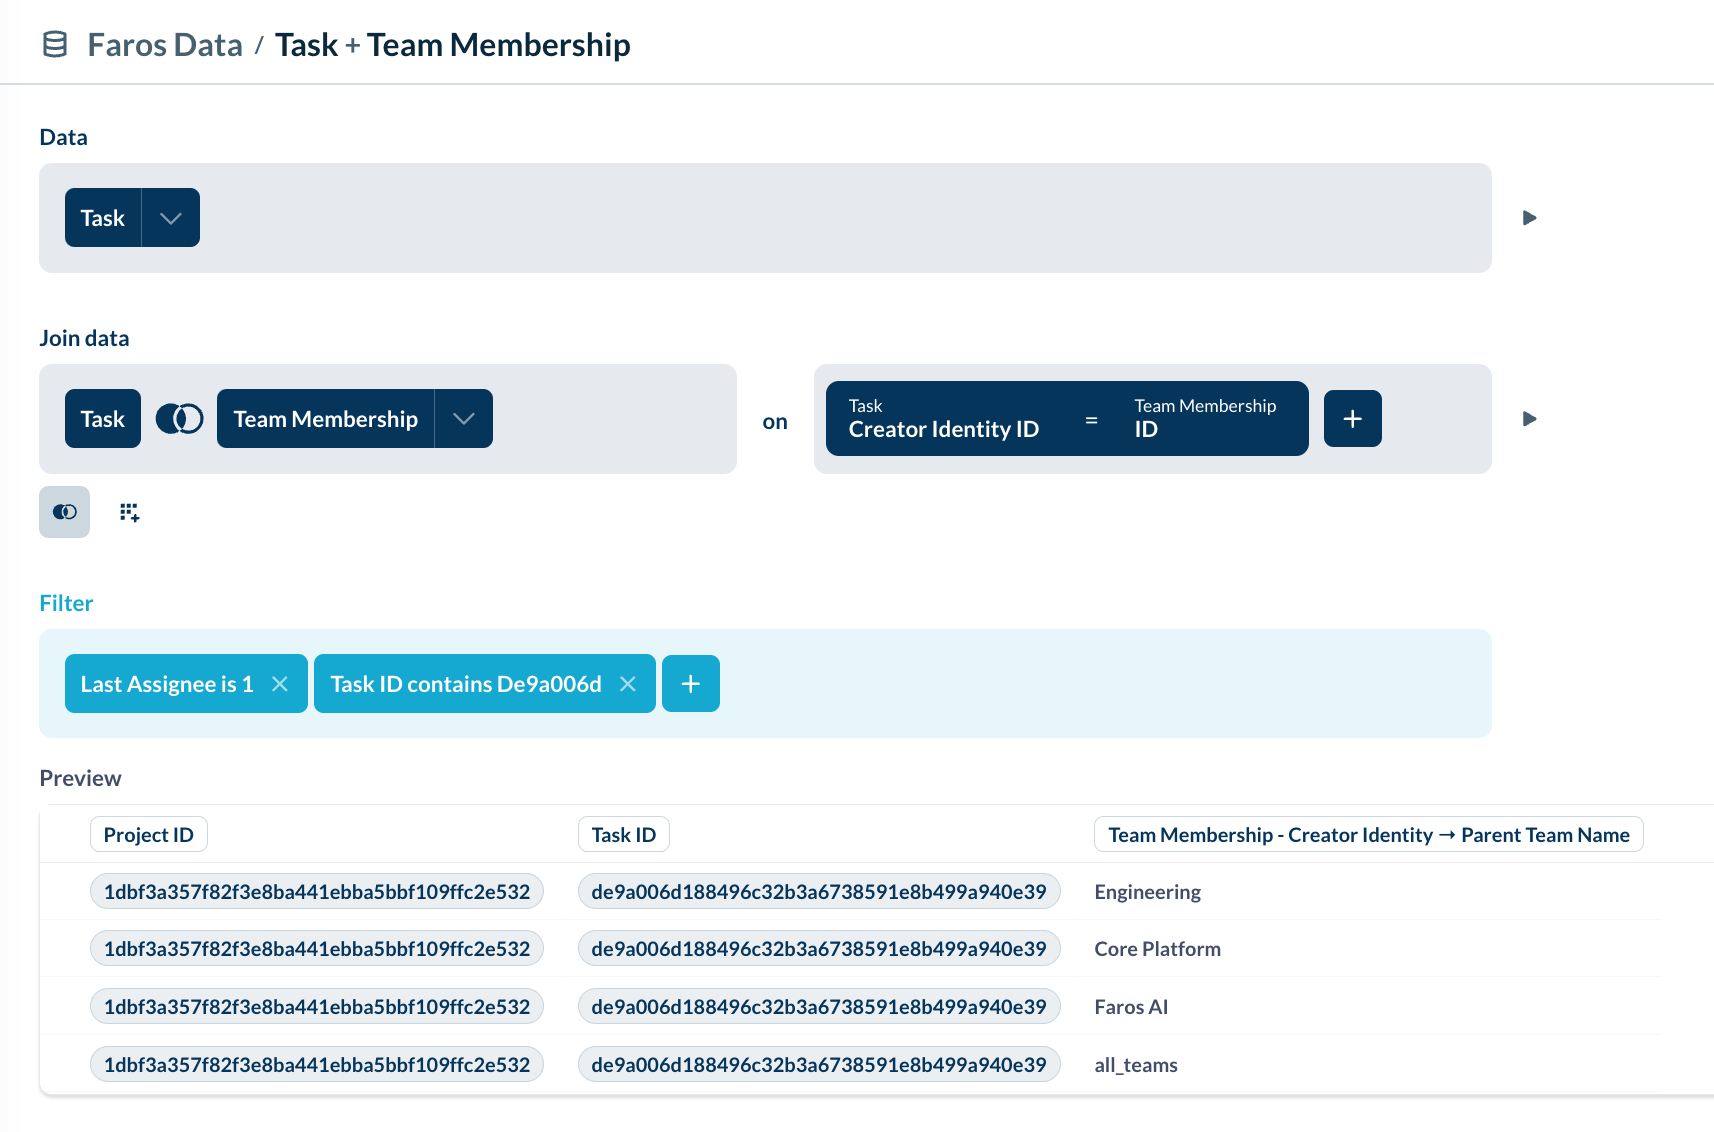
To eliminate the duplicates, I can use a team filter or the distinct values of field.
Task Board
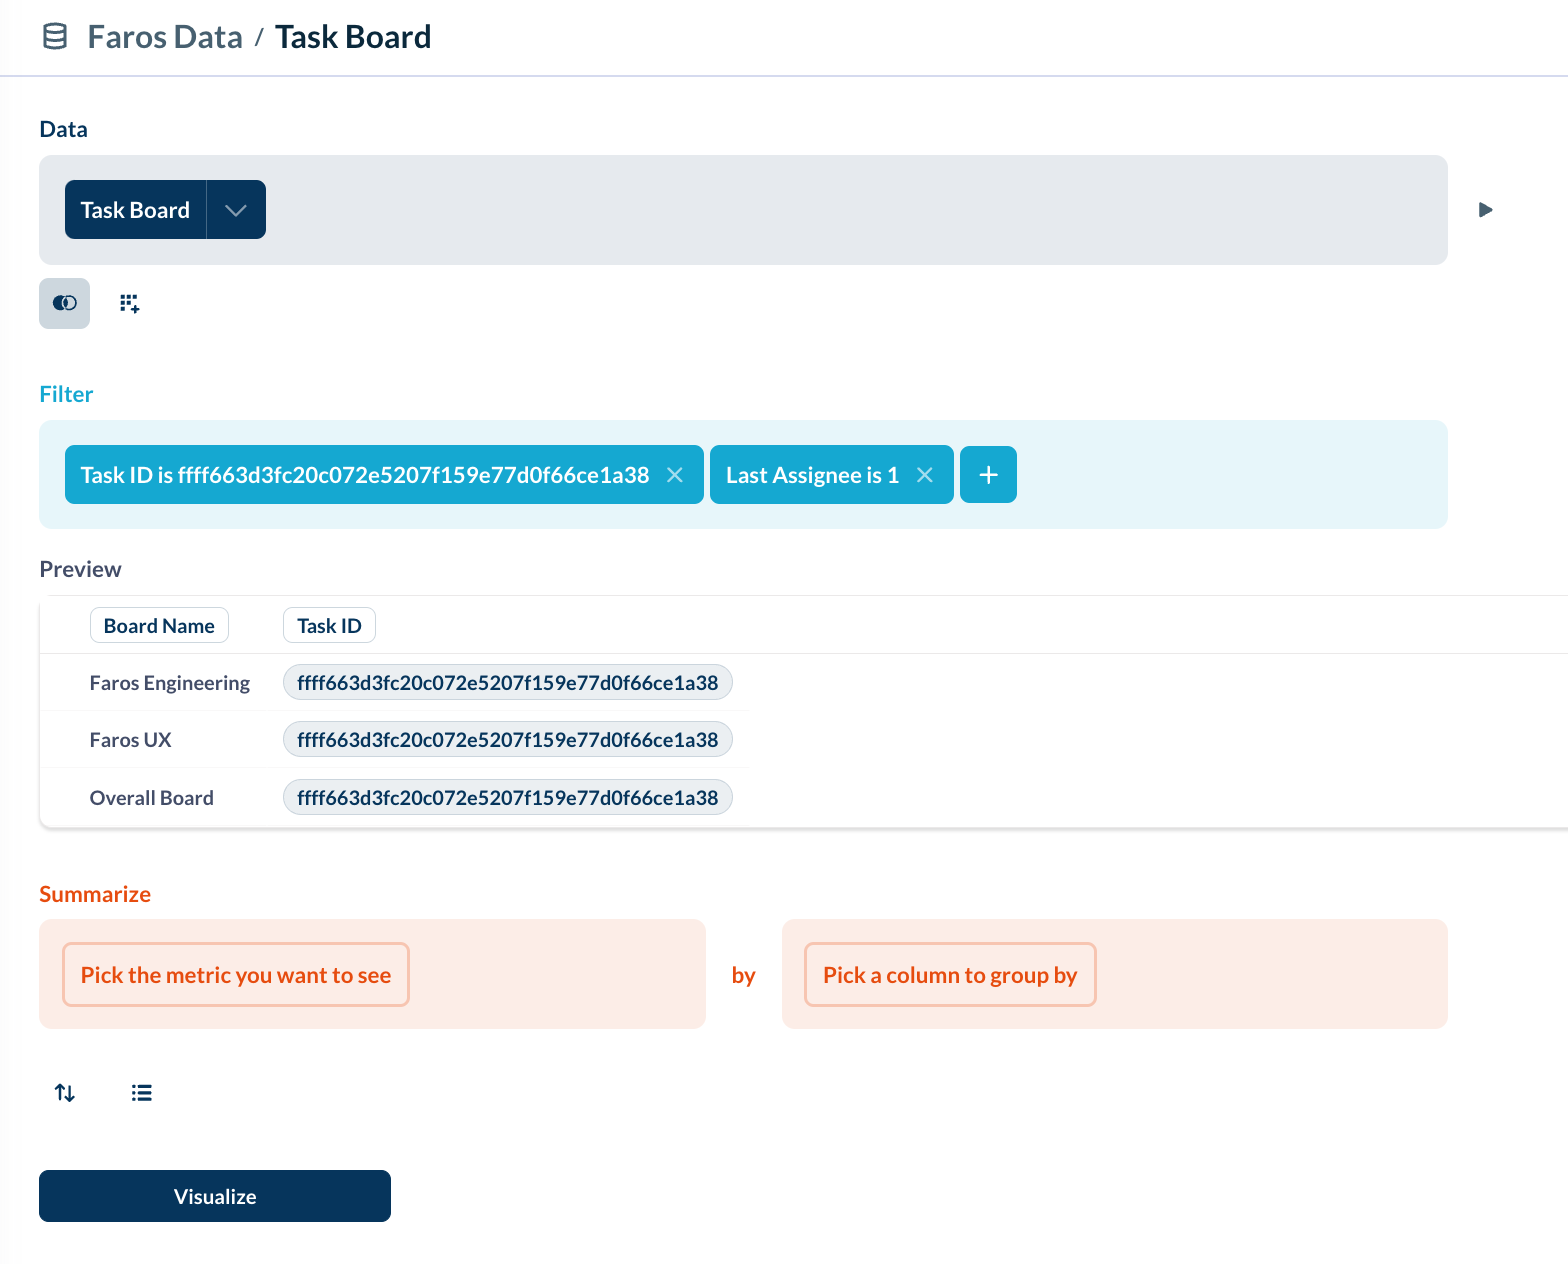
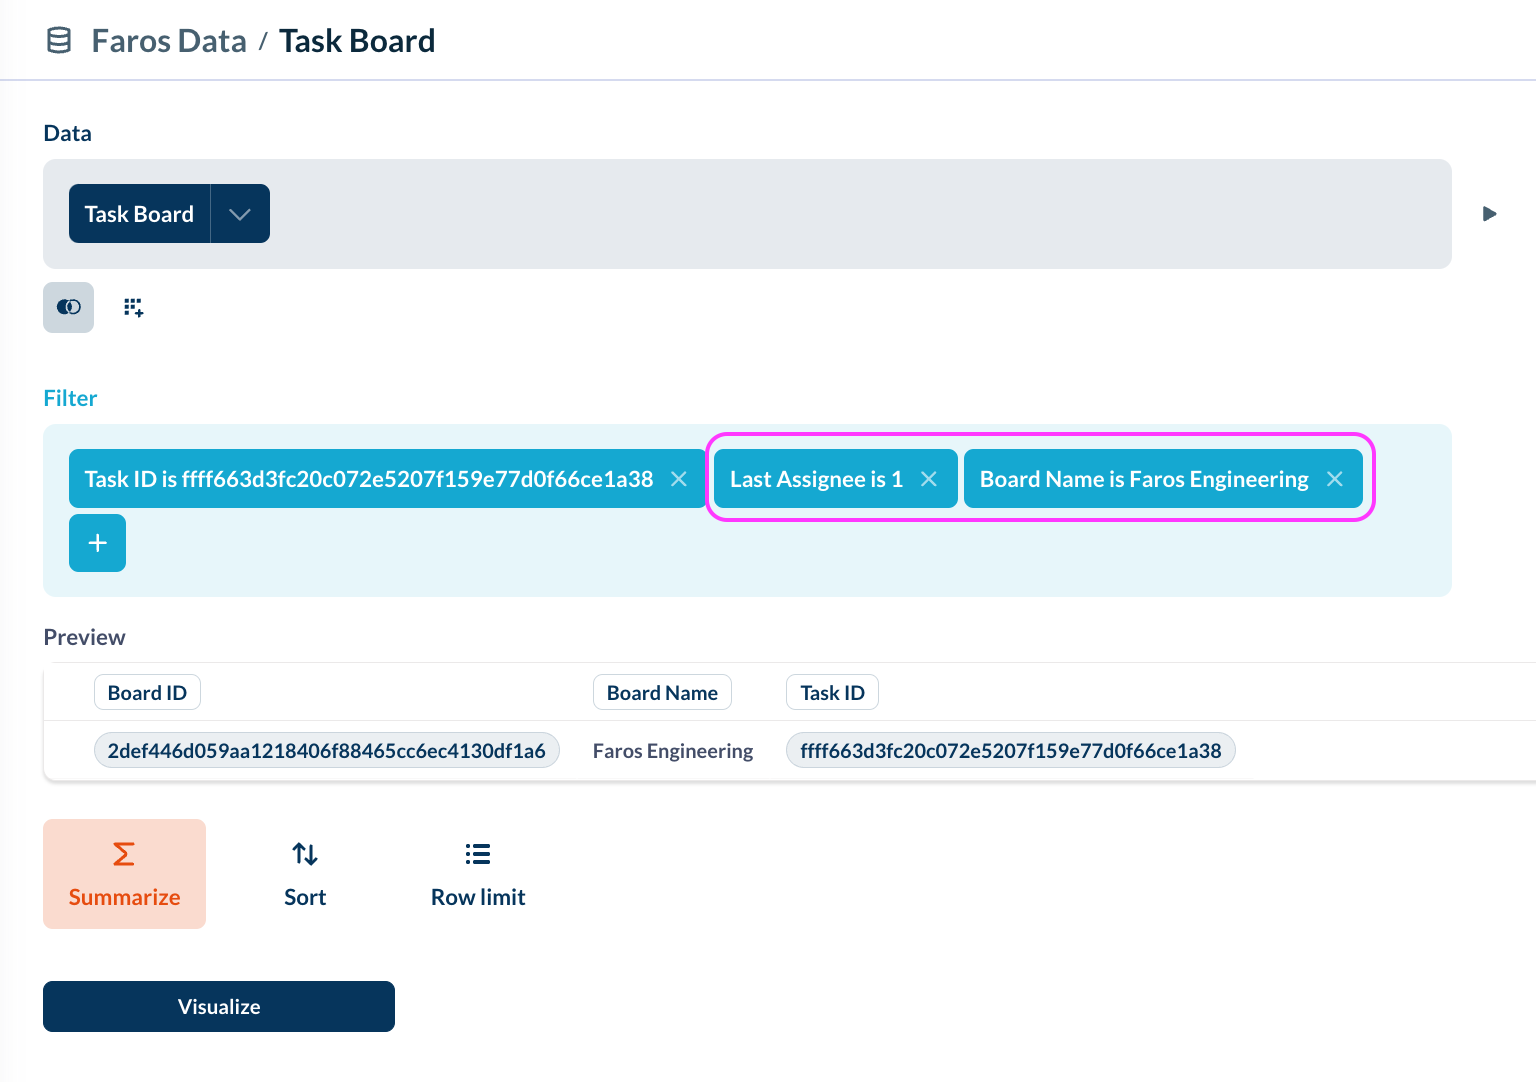
The Task Board table is similar to the Task table, but it also includes the board(s) that each task is assigned to. Since a task can be on multiple boards, you may have duplicate rows here for boards or assignee (as outlined above).
In the image below, you can see that there are three rows for the same task, even when the Last Assignee = 1 filter is set. This is because a row is created for each board the task appears on.
To remedy this issue, you can use a board filter or the distinct value.
Entity Additional Field
If there are multiple custom fields on a task, you may see duplicate rows.
You can resolve this using a few different methods.
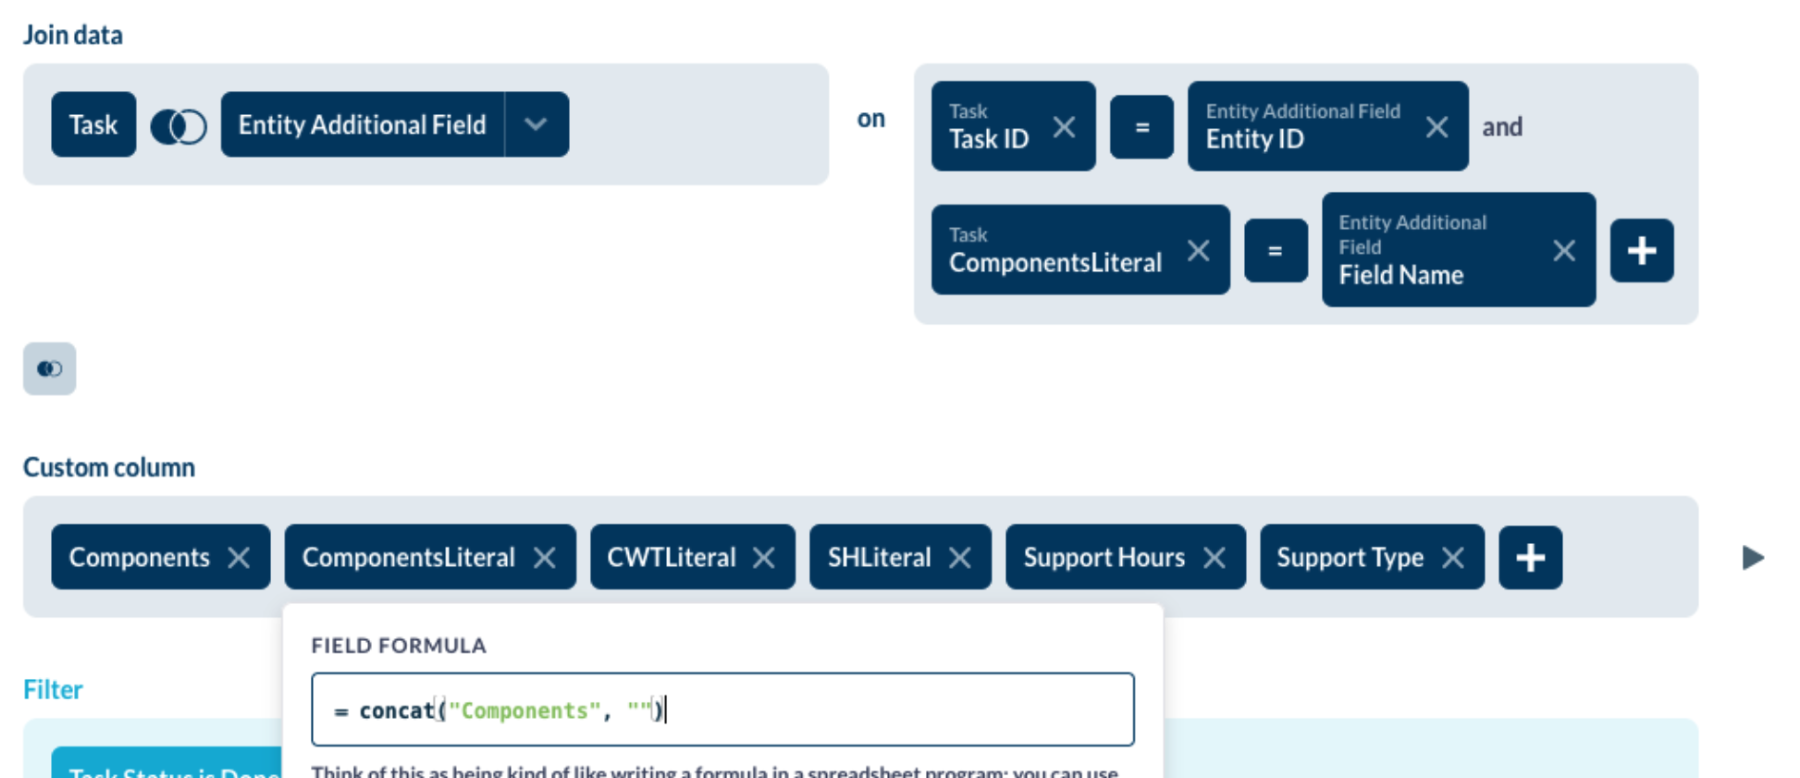
Method 1: Outer Join with a literal column that is part of the join condition
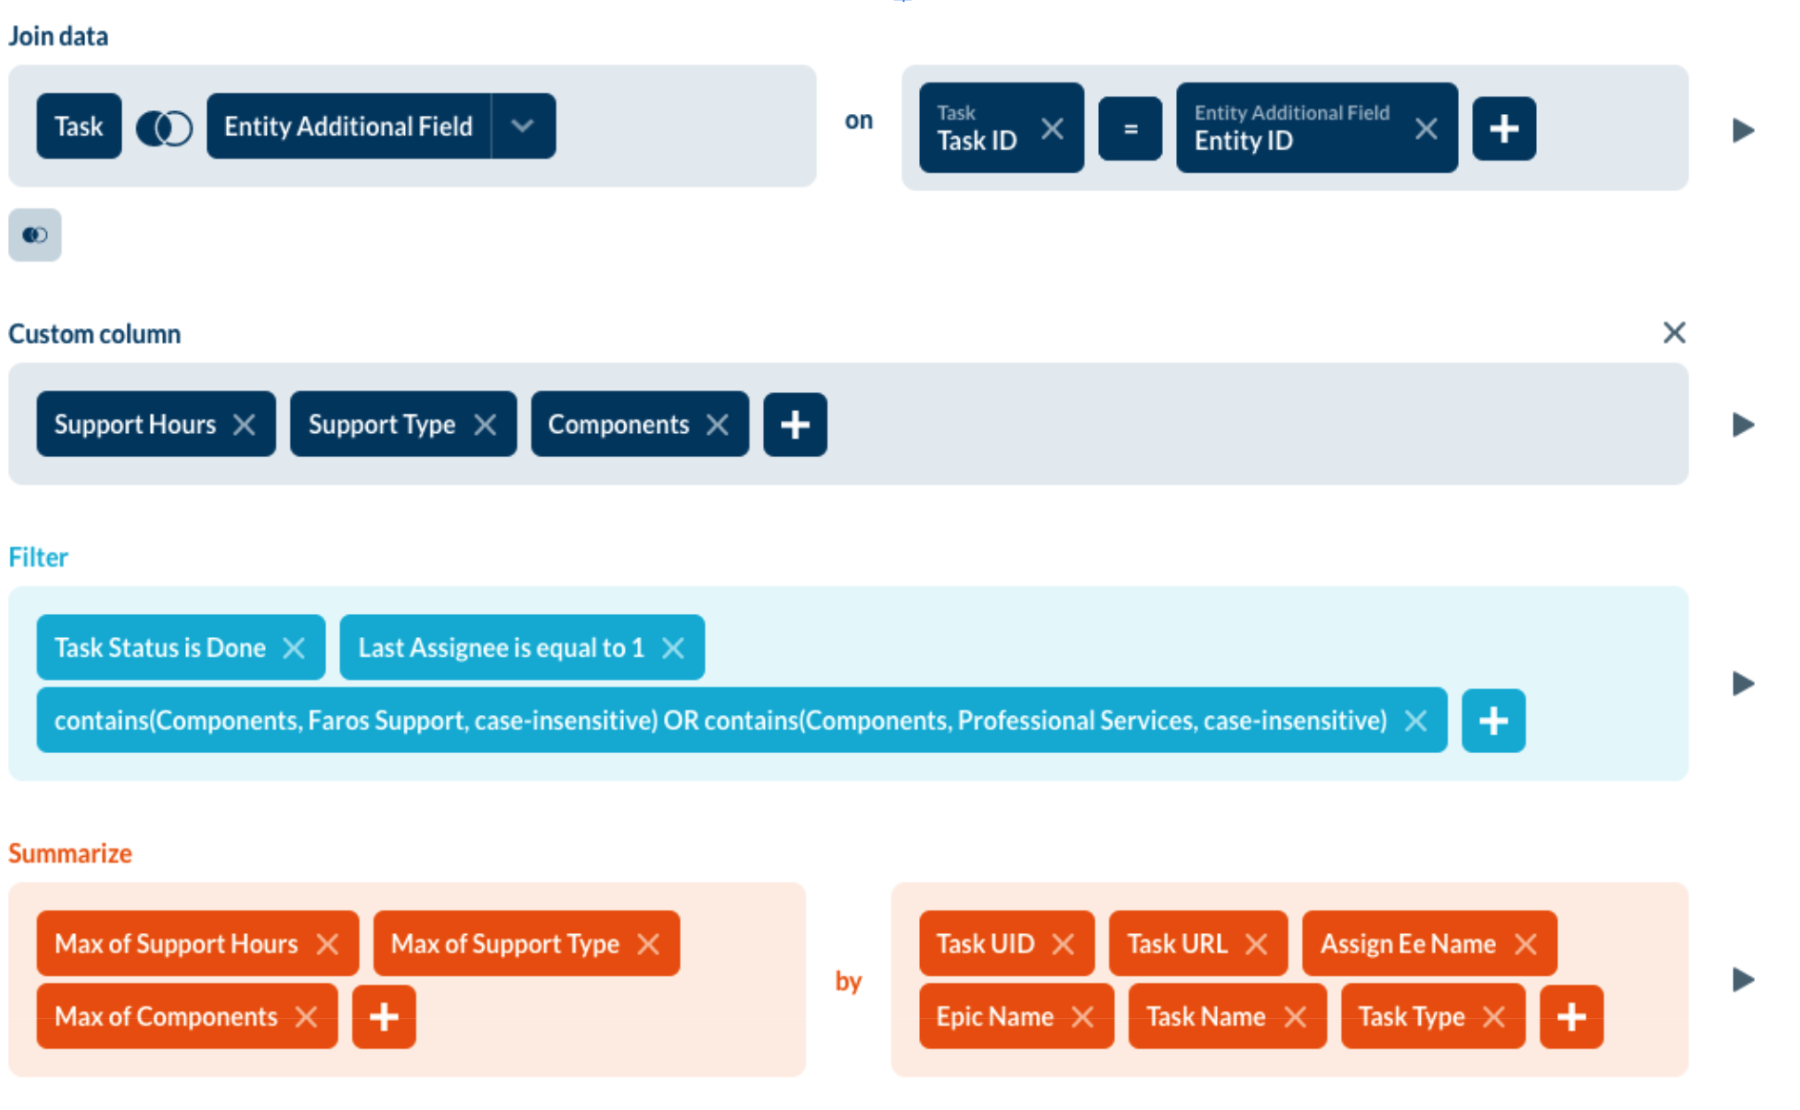
Method 2: Single Join extracting each value into a custom field, aggregated with 'max' of field to coalesce
Method 3: Filtering
A third option is to filter by the fields that you are interested in, but in some cases this may not be ideal, as it will exclude rows for any tasks that are missing the tag.
Tags
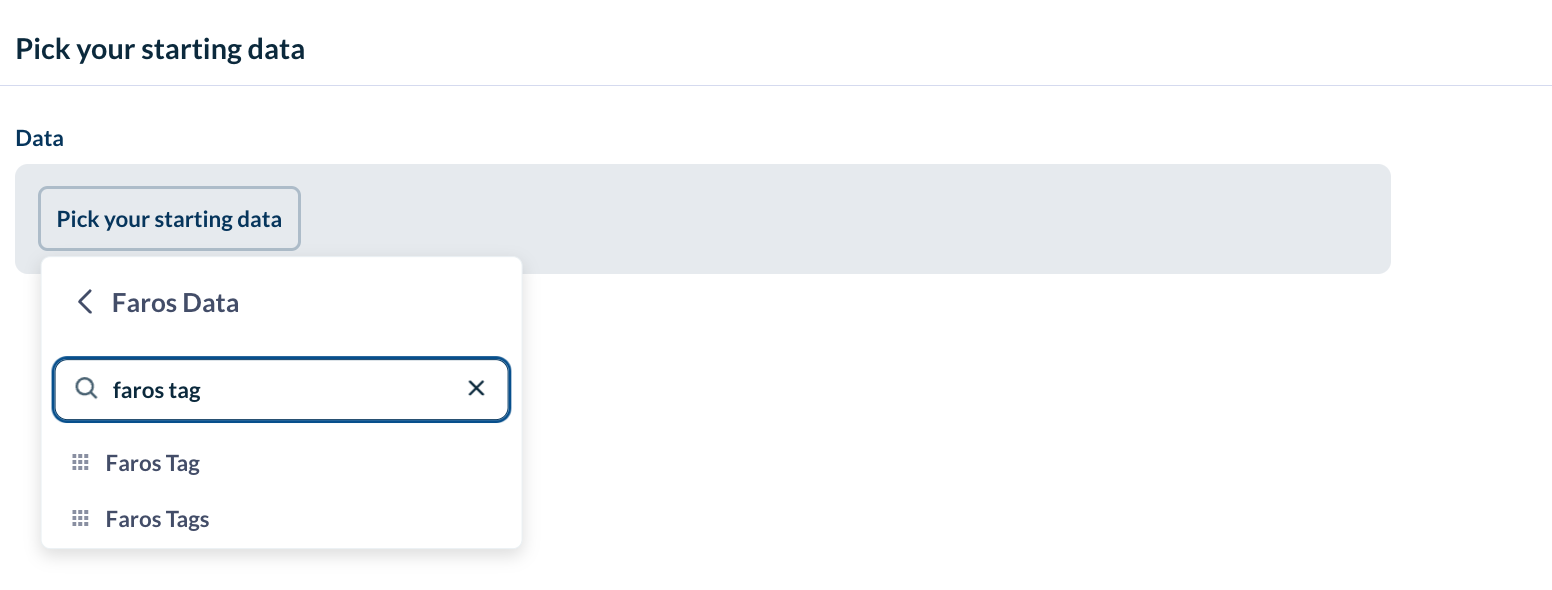
Faros AI offers two similar, but distinct tables: Faros Tag and Faros Tags
You can learn more about tags here.
Faros Tag
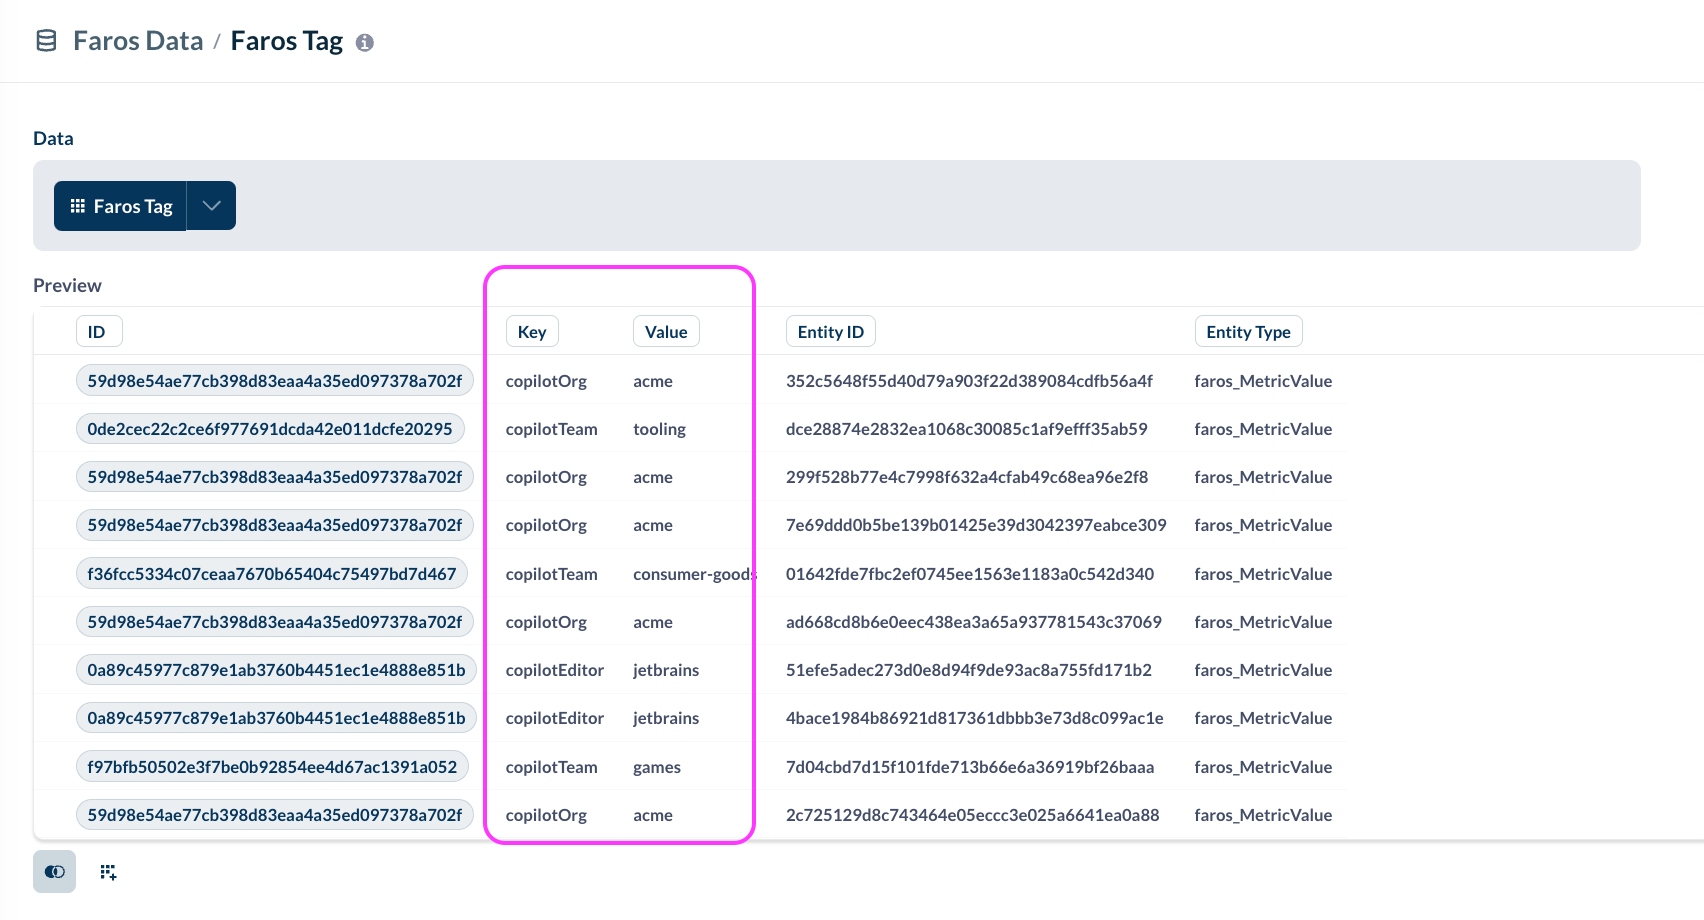
The Faros Tag table allows you to add extra data to your tags or pull requests.
In this table, one row is generated per tag. Each row includes a key (the field name) and a value (the value for that field).
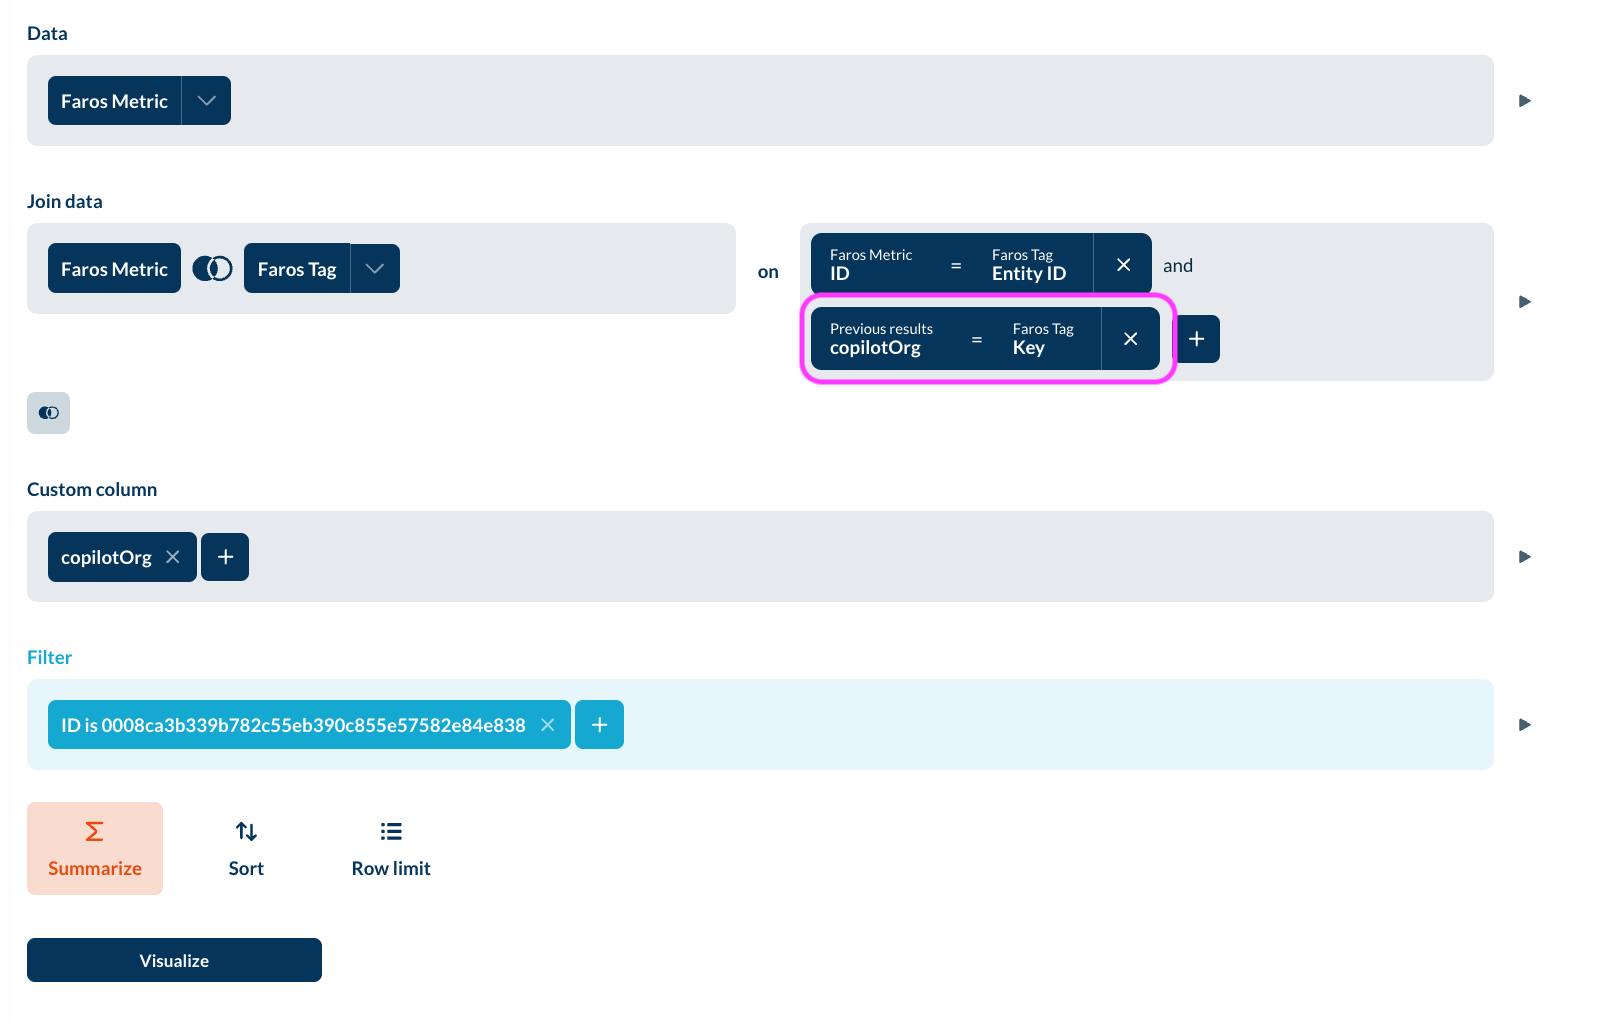
Similar to the Entity Additional Field, there is a risk here of duplicate rows if your filters are not set up correctly.
To remedy this, you can use the same methods outlined for Entity Additional Fields.
Below, we've shown how to specify the tag key as part of the join.
Faros Tags
Faros Tags are similar to Faros Tag, but here all tags appear together in one field (the Tags field). This means there is not a risk of duplicate rows, but it may be more difficult to manipulate the data, as all tags are consolidated into one field.

This function can be used in a custom field to extract values from the tags:
regexextract(\[Tags], "\{copilotEditor:(.+?)}")Paths
You can learn more about paths here.
Flows
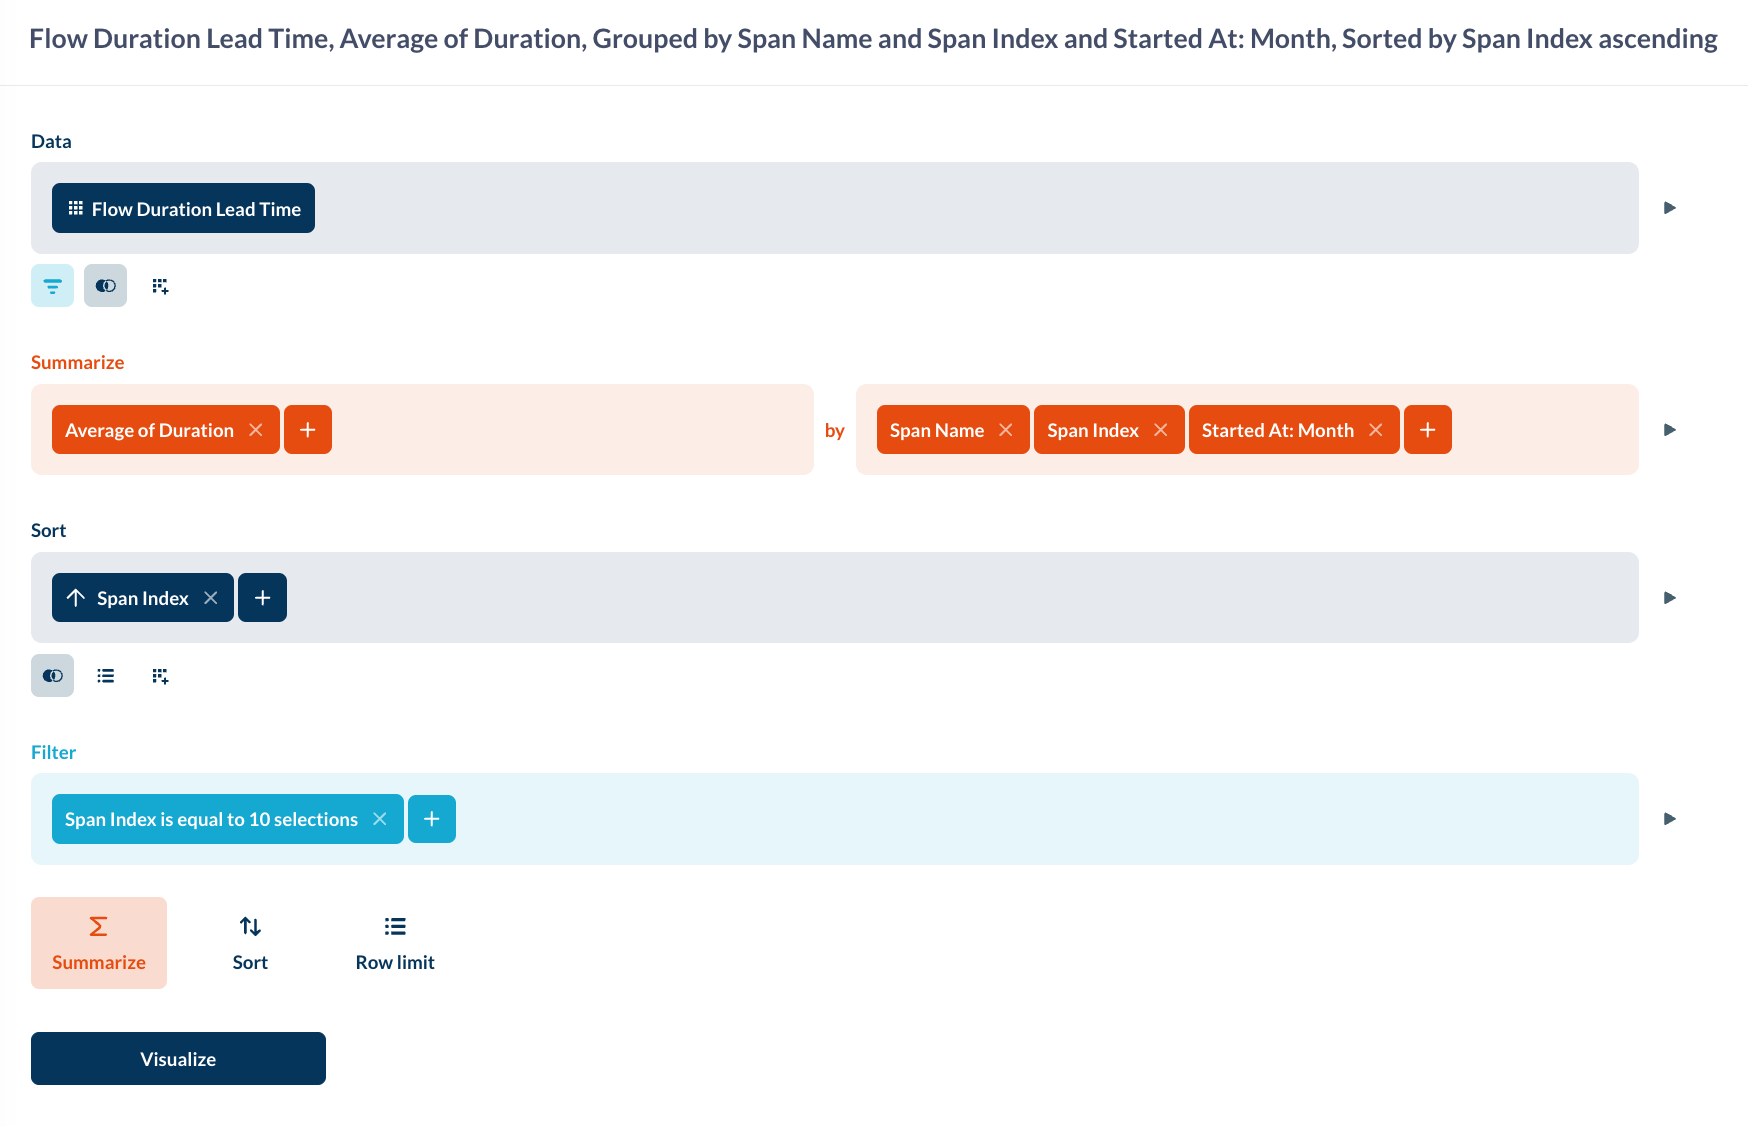
Faros includes built in flows to allow you to visualize more complex concepts, such as Flow Duration Lead Time. You can learn more about custom flows here.
Flow Duration Lead Time
Flow Duration Lead Time tracks one change throughout the full process spanning multiple environments -- from pull request to merge, built, deployed, etc.
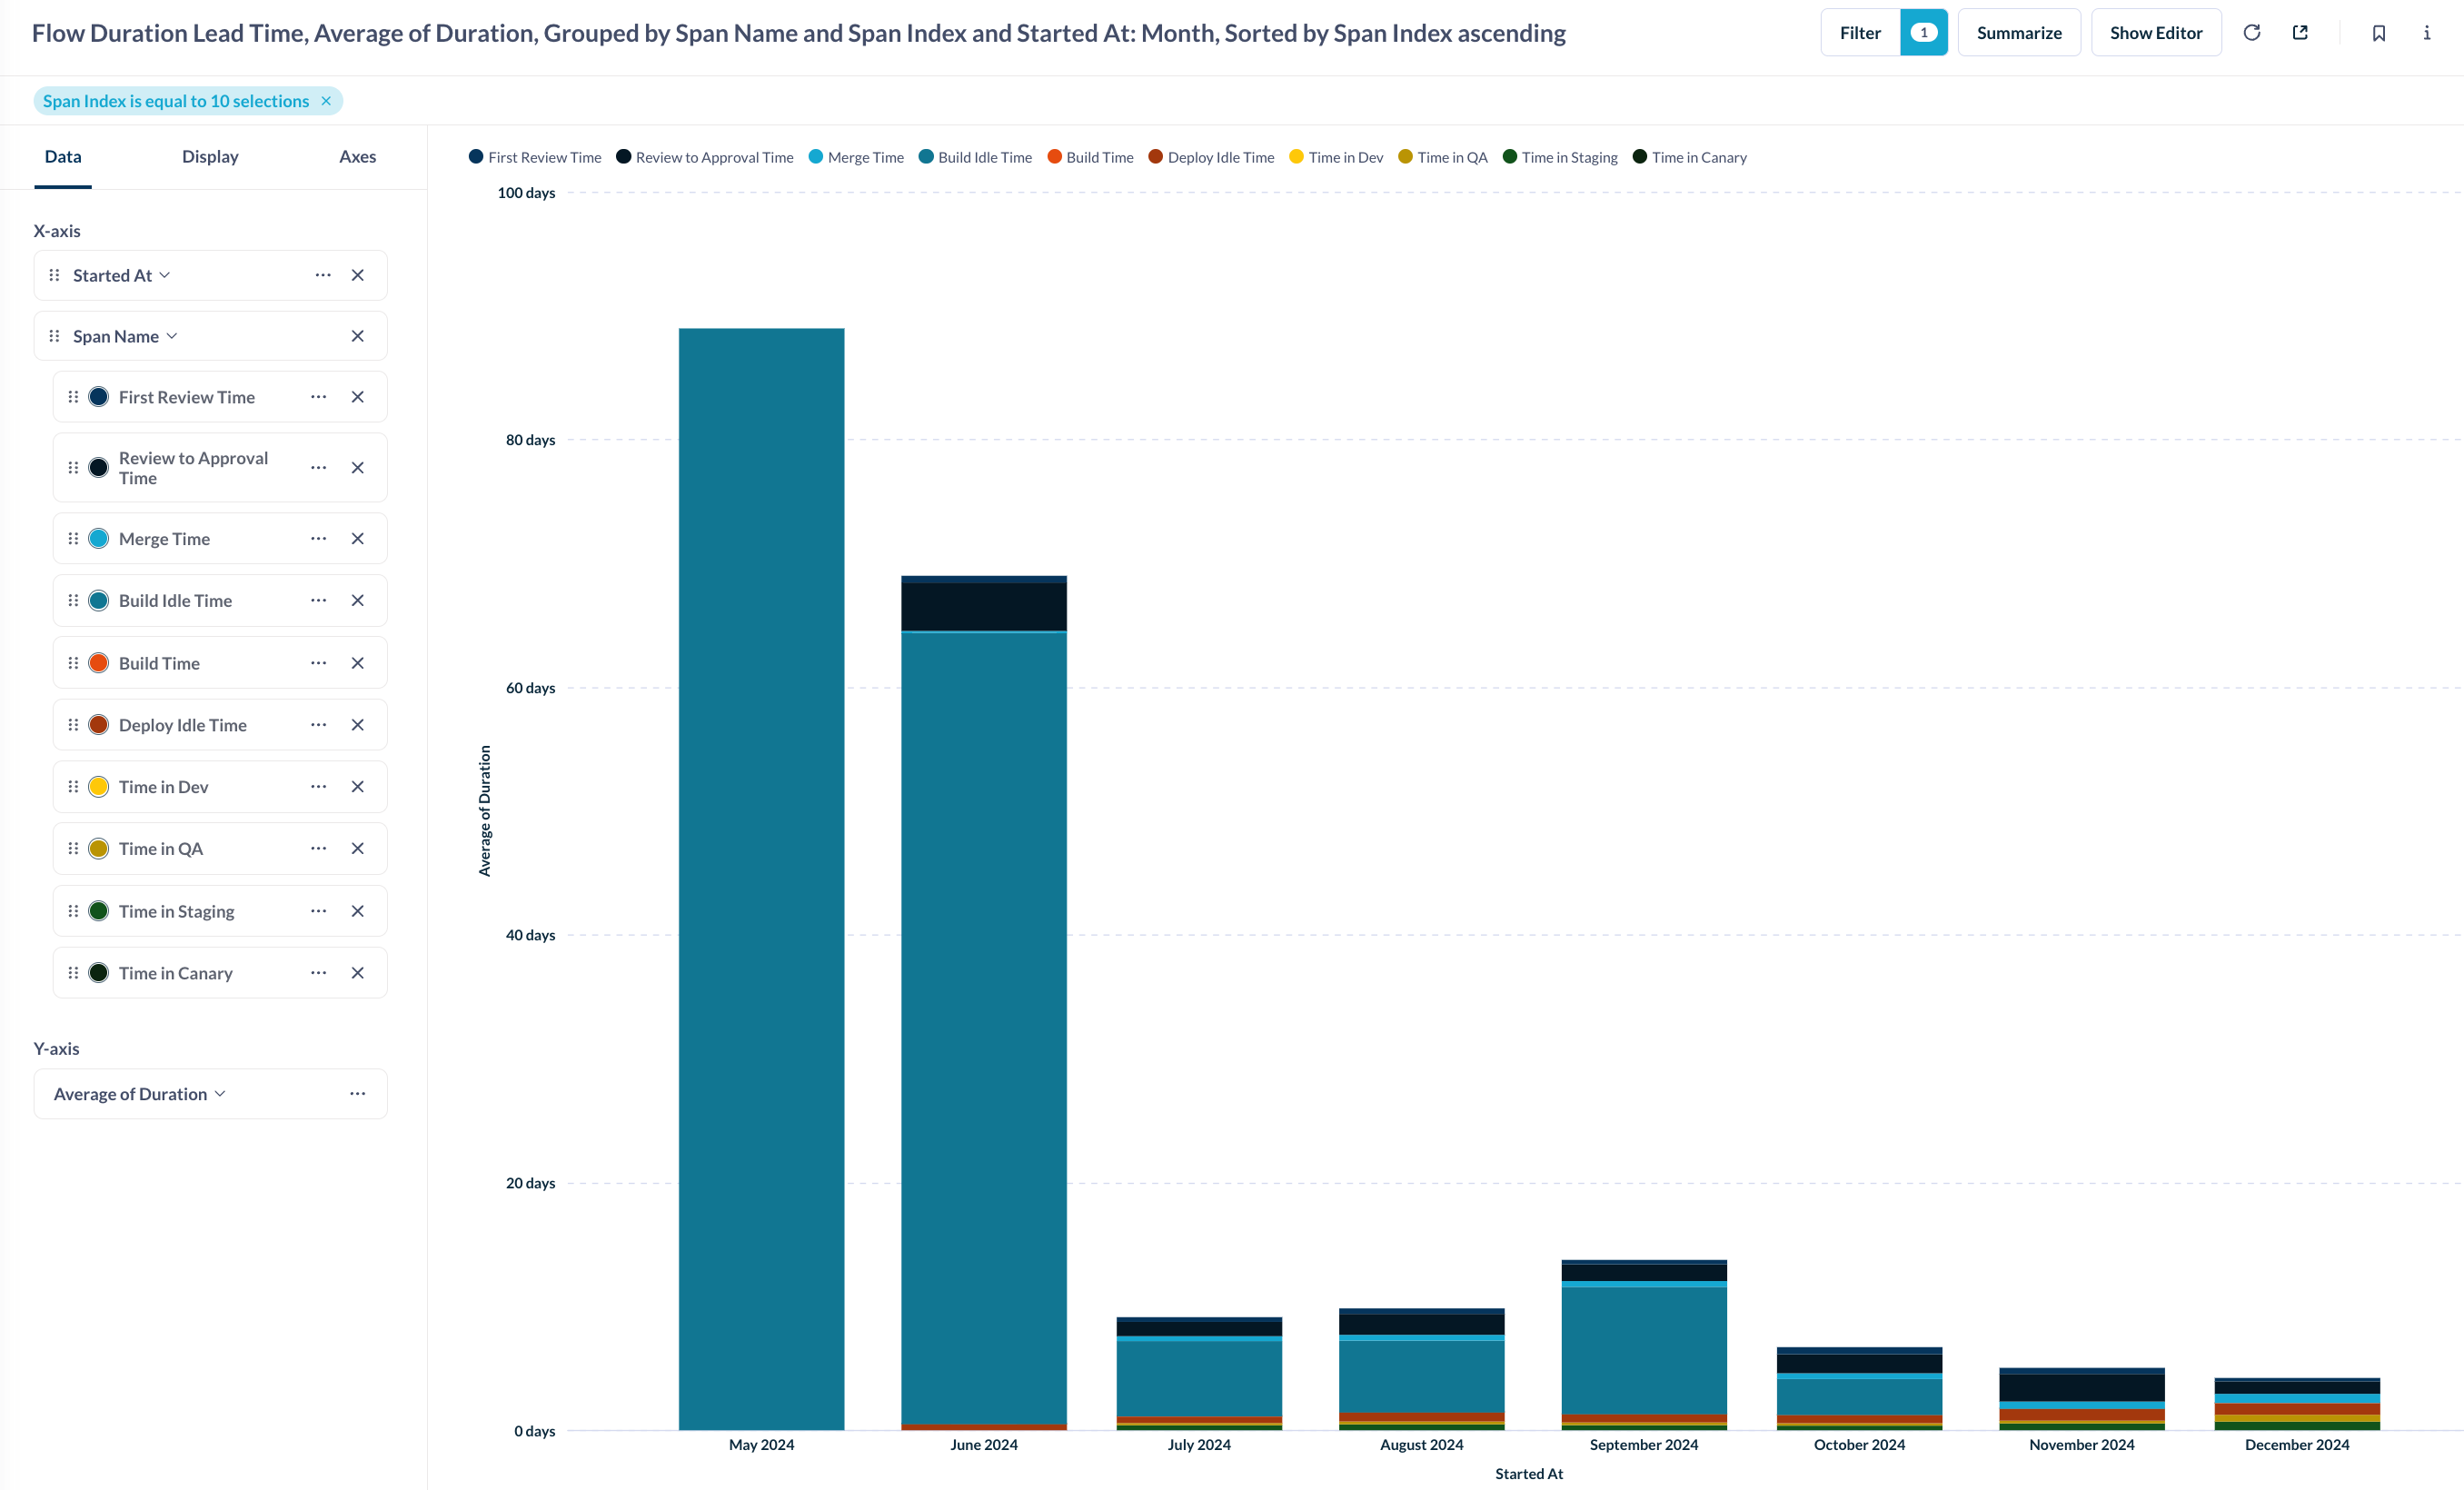
This table can be used for to create summary views, for example visualizing the average duration spent in each stage over time. This will allow you to see where bottlenecks occur over time.
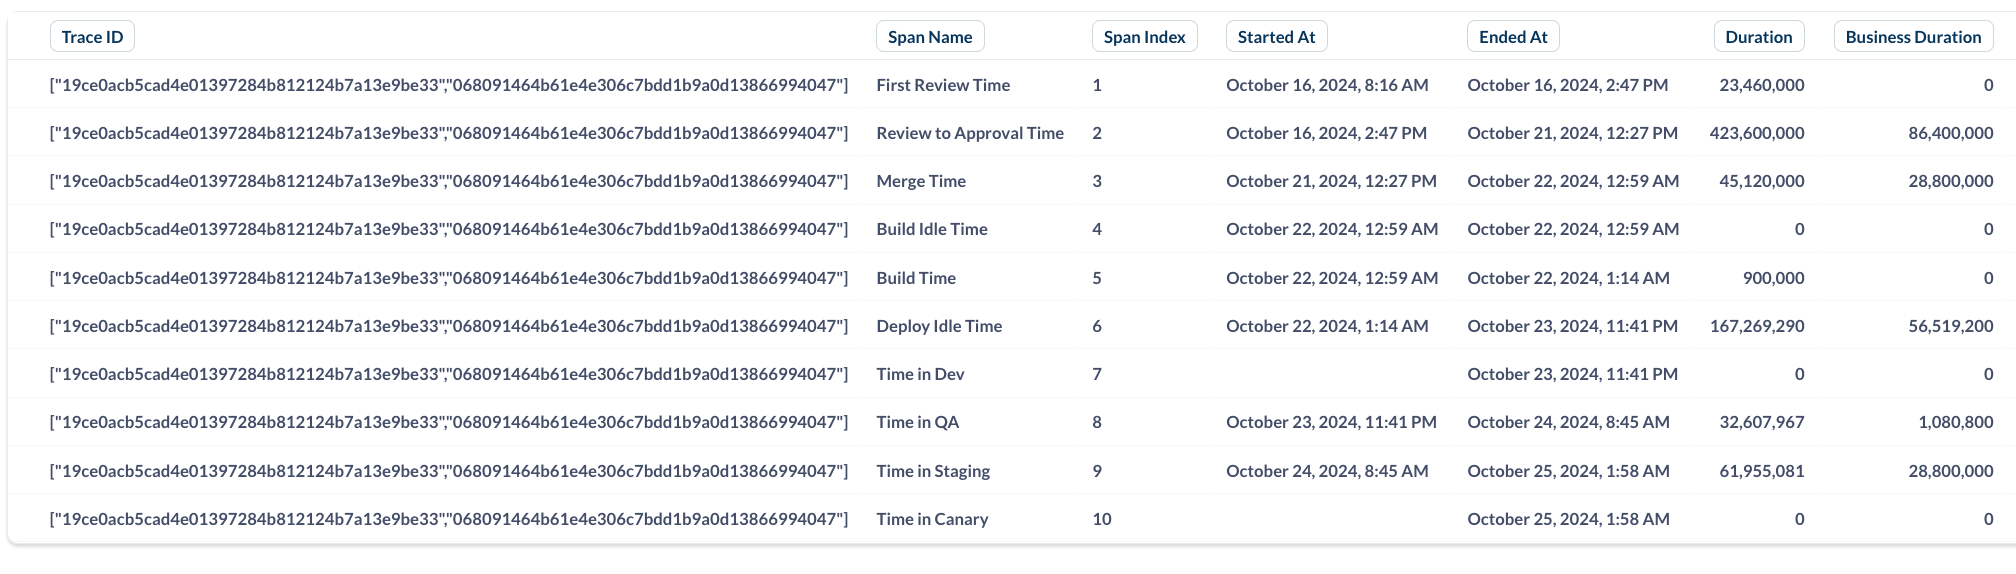
You'll see the following fields in the Flow Duration Lead Time table:
| Field | Definition |
|---|---|
| Trace ID | This identifies the artifact you are tracking. It is made up of the pull request ID and build ID. |
| Span Name | The state that the artifact is in |
| Span Index* | The sequential order of statuses that the artifact went through* |
| Duration | How long the artifact spent in that state, tracked in milliseconds (includes nights and weekends) |
| Business Duration | The duration that happens during business hours only (Maximum of 8 hrs per day, Mon - Fri) |
*Note that the span name with the final span index value will be 'Overall Time.' In most instances, you will want to exclude this value from your filters so as to not double-count time.
You can use this data to track things like average time spent in each stage over time to better understand bottleneck trends over time.
Note: To learn how to update charts to track in units such as days rather than milliseconds, see our documentation here.
Aggregated Tables
Faros includes some aggregated tables, such as:
| Table Name | Description |
|---|---|
| Task Weekly Stage Count | How many tasks are in each stage, broken down by week |
| Task Status Transition | When each task changes status |
| Change Failure Weekly | Counts incidents and deployments each week (aggregating 2 tables: Incidents, and Deployments) |
Team Metrics
These are the metrics that can appear in the scorecard. If you're making custom metrics, sometimes they will appear in that table. You can update this by going to Scorecard > Include Metrics
You can learn more here.
Updated 4 months ago