
DevOps Management Module
The DevOps module helps you measure the performance of a software development team based on two key aspects: velocity and quality.
It is based on the DORA metrics, from the DevOps Research and Assessment (DORA) team at Google, which have been adopted by many organizations as a standard way to measure DevOps maturity.
What are the DORA metrics?
The DORA metrics are a valuable tool for software development teams to measure their performance and identify areas for improvement. By tracking these metrics over time, teams can see how they are progressing and make changes to their processes to improve their overall performance.
The four DORA metrics are:
- Deployment frequency (DF): Measures how often an organization successfully deploys new code to production. A high DF indicates that an organization is able to release software more frequently, which can lead to faster time to market and improved customer satisfaction.
- Lead time for changes (LT): Measures the time it takes for a change to go from code being committed to code being deployed to production. A low LT indicates that an organization is able to deliver changes quickly and efficiently, which can help to reduce risk and improve productivity.
- Change failure rate (CFR): Measures the percentage of changes that cause a severe degradation or outage in Production. A low CFR indicates that an organization is able to deploy changes with a high degree of confidence, which can help to improve reliability and uptime.
- Mean time to recovery (MTTR): This metric measures the time it takes to recover from a production incident. A low MTTR indicates that an organization is able to quickly resolve problems and get services back up and running, which can help to minimize downtime and impact to users.
To begin measuring DORA metrics, connect your CI/CD and source control systems to Faros.
Accessing the DevOps Module
The DevOps Module is accessible under the DevOps Management folder within Faros Reports. It is a premium add-on in the Faros platform. Under Menu > Dashboards, select View All and Faros Reports.
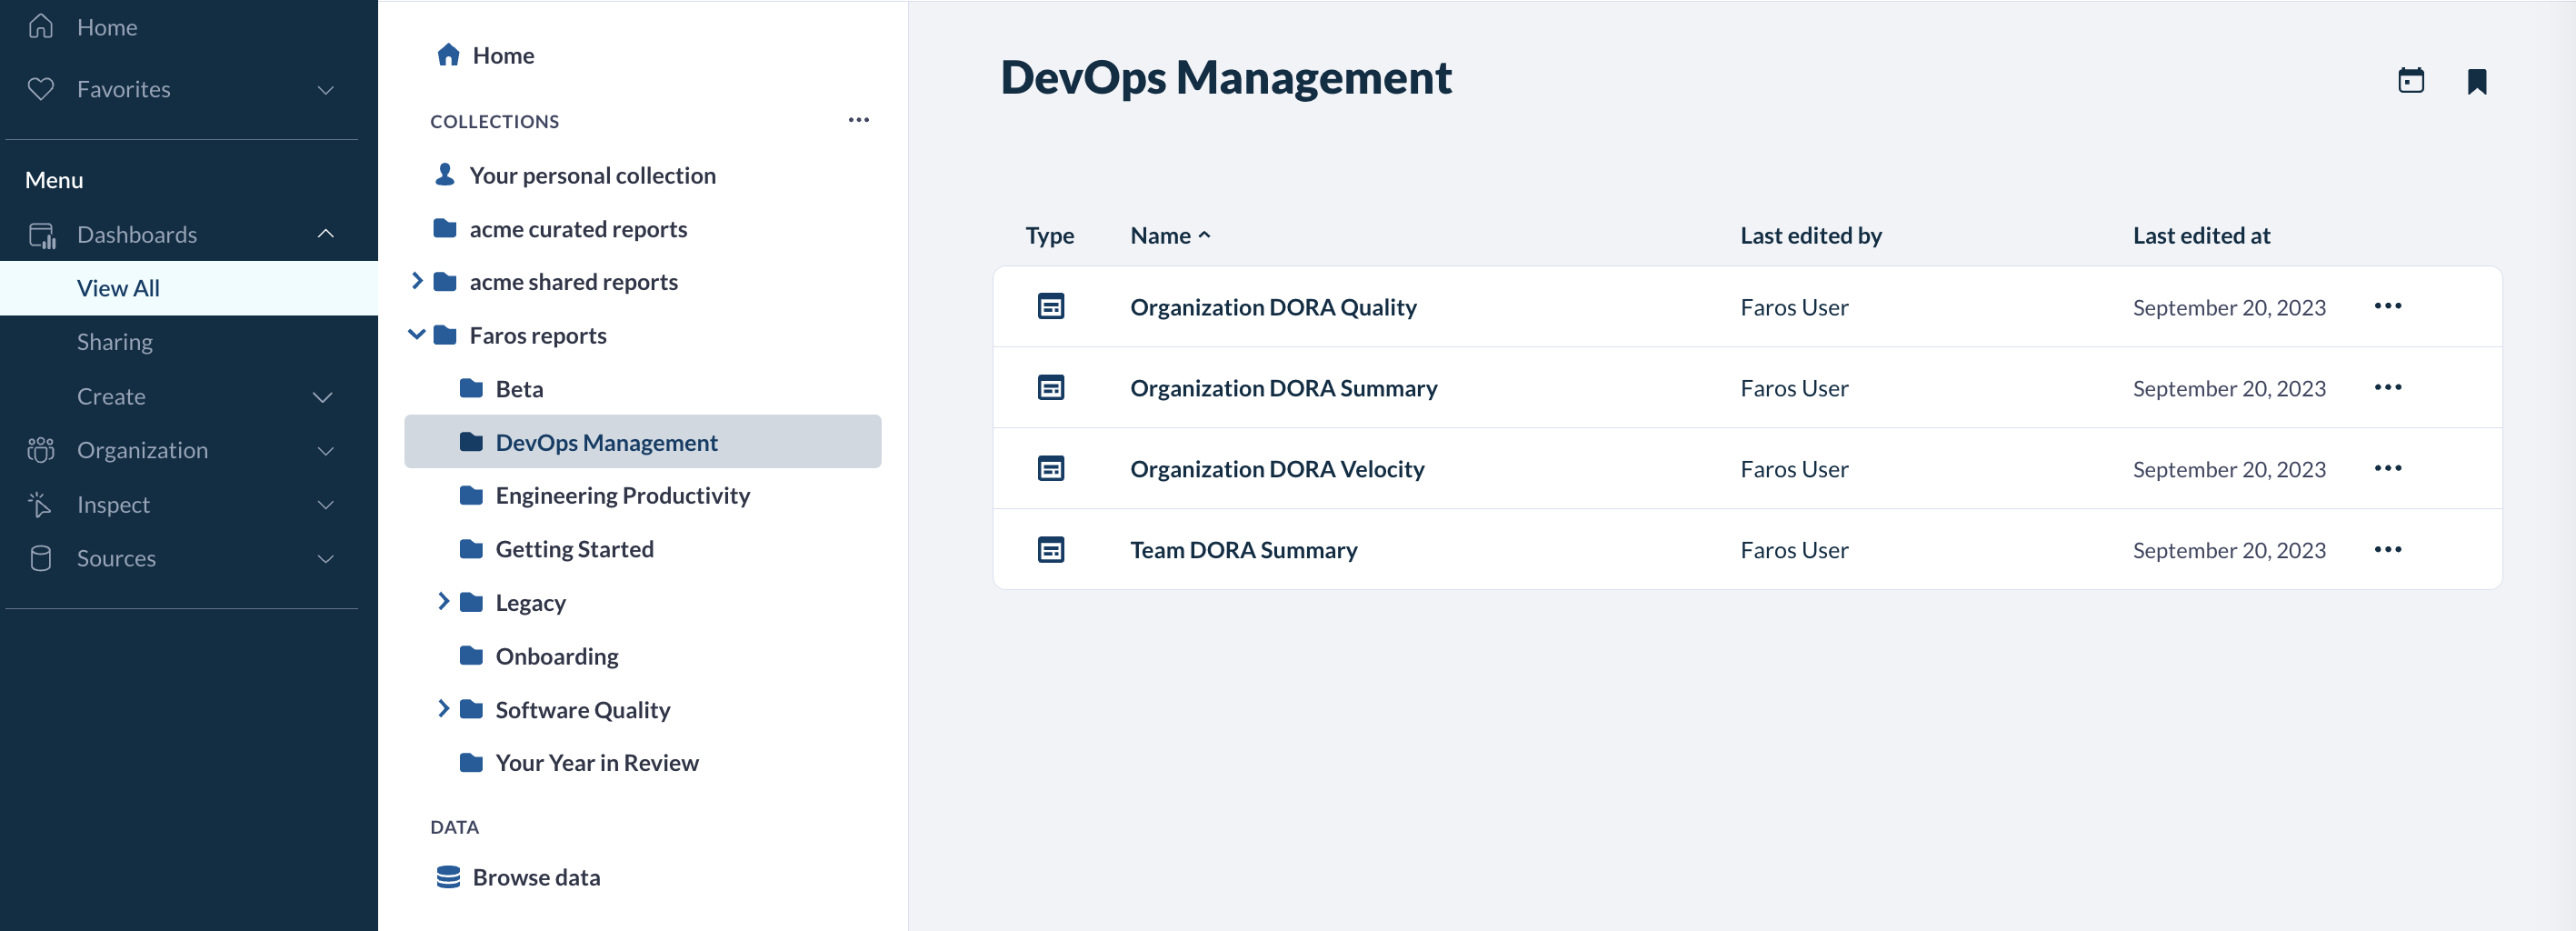
DevOps Dashboards
The DevOps module is composed of four dashboards. Three of them are at the organizational level: Organization DORA Summary, Organization DORA Velocity and Organization DORA Quality. One is at the team level: the Team DORA summary. We will go into detail about each below.
Organization DORA Summary Dashboard
The Organization DORA Summary dashboard provides an organizational view where senior leaders who manage teams of teams can gain comprehensive insights into key velocity and quality metrics.

The dashboard is structured into two primary sections, the first one focusing on velocity metrics and the second one focusing on quality metrics.
All metrics can be filtered by team and a specific time period.
- The desired team can be set using the Teams filter, and defaults to all teams. It is also possible to click on any of the team traces to drill down to a specific team
- The desired time period is set by the Date filter at the top of the page, and defaults to the previous 90 days.
The velocity section summarizes how well an organization is performing with respect to the velocity component of the DORA framework and provides the following metrics:
Metric | Description |
Average weekly deployments per application | This DORA velocity metric corresponds to the average number of production deployments per week per application. Elite performing teams are deploying on demand and low performing teams between once per month and once every six months. |
Total deployments contributed by Sub_Org over time | The total count of week-by-week production deployments that include changes authored by members of each sub-org. |
# Applications Contributed to vs # Employees | The number of applications contributed to by employees vs. the number of employees, grouped by sub-org. Helps compare deployments and size of teams. |
Mean Lead Time for Change | This DORA velocity metric corresponds to the average time it takes for changes authored by team members to go from PR creation to deployment in production. Elite performers reported lead times of less than one day again. The low performers between one month and six months. |
Mean Lead Time by Sub-Org over Time | The breakdown of mean lead time by sub-org and over time. Helps identify trends in sub-orgs. |
Mean Lead Time Breakdown by Sub-Org | The average time that changes authored by members of sub-orgs spend in different stages of the SDLC, from PR creation to deployment in production. It is a great place to investigate which stages are taking a long time and delaying the release process.Note: This chart includes steps from flows that have not yet completed, so results may differ slightly from other completed-flow metrics. |
The quality section summarizes how well an organization is performing with respect to the quality and stability components of the DORA framework and provides the following metrics:
Metric | Description |
Change Failure Rate (Sev1/Sev2) | This DORA quality metric shows the number of Sev1/Sev2 incidents as a percentage of production deployments for applications owned by the Sub-Org. Elite performers reported 0-5%. The low performers reported over 64%. |
Change Failure Rate (Sev1/Sev2) by Sub-Org over Time | The number of Sev1/Sev2 incidents as a percentage of production deployments for applications owned by the sub-org. |
Incidents by Sub-Org and Severity | The number of Sev1/Sev2/Sev3/Sev4/Sev5 incidents by sub-orgs. This bar chart helps visualize which teams have to handle the most incidents. |
Mean Time to Resolve (Sev1/Sev2) | This DORA quality metric shows the mean time to resolve Sev1/Sev2 incidents for applications owned by the team. High performers reported less than one day. The low performers reported between one week and one month. |
Mean Time To Resolve (Sev1/Sev2) by Sub-Org over Time
| The mean time to resolve Sev1/Sev2 incidents broken down by sub-org and over time. |
Mean Time to Resolve (Sev1/Sev2) Breakdown by Sub-Org | The response time breakdown by sub-org and stage, such as mean time to acknowledge and mean time to fix. Note: This chart includes steps from flows that have not yet completed, so results may differ slightly from other completed-flow metrics |
Organization DORA Velocity Dashboard
The Organization DORA Velocity dashboard provides supporting metrics on the velocity element of code delivery across the organization.

The dashboard is structured as three primary sections:
- Velocity by Deployment Stage
- Velocity by Sub-Org
- Recent Deployments as data points
The Velocity by Deployment Stage section provides the following metrics:
Metric | Description |
Lead Time by Stage (P95) over Time | The P95 lead time of changes authored by team members, broken out by stage, week-by-week, and helps identify stages that are delaying the overall time to deployment. P95 means the 95th percentile, i.e. 95 percent of the data within the period is lower than this value and 5 percent of the data is higher than this value. Note: This chart includes steps from flows that have not yet completed, so results may differ slightly from other completed-flow metrics. |
Lead Time Distribution by Stage | Binned frequency distribution of time spent in each stage, for changes to go from PR creation to deployment in production. This bar chart can help identify outliers.Note: This chart includes steps from flows that have not yet completed, so results may differ slightly from other completed-flow metrics. |
The Velocity by Sub-Org section provides the following metrics:
Metric | Description |
Lead Time (P95 & Avg) by Sub-Org | Shows both the P95 and average lead time of changes authored by members of the sub-org, week-by-week. This chart helps identify trends over time and compare the 95th percentile and average. |
Lead Time Distribution by Sub-Org | Binned frequency distribution of lead times for changes authored by team members, across sub-orgs. This bar chart shows distribution and can provide a more granular understanding than the average. |
Weekly Deployments Contributed to by Sub-Org over Time | The number of week-by-week production deployments that include changes authored by members of sub-orgs per application owned. |
Distribution of Weekly Deployments by Sub-Org | Binned frequency distribution of the number of weekly deployments that contained a change authored by a member of a sub-org. This bar chart can help compare between teams. |
The recent deployments section lists recent deployments and their average lead time.
Organization DORA Quality Dashboard
The Organization DORA Quality dashboard provides supporting metrics on the quality aspect of code delivery across the organization.

The dashboard is structured into two primary sections:
- Quality and stability metrics across sub-orgs
- Quality and stability metrics between orgs
The Quality and Stability across Sub-Orgs section focuses on incidents and response times, and includes the following metrics:
Metric | Description |
Time to Resolve Incidents by Stage (P95) | The P95 time it takes to resolve incidents broken out by stage, week-by-week. Helps identify stages that significantly increase the time to resolve incidents.Note: This chart includes steps from flows that have not yet completed, so results may differ slightly from other completed-flow metrics. |
Distribution of Time to Resolve Incidents by Stage | Binned frequency distribution of the time incidents spend in a given stage. Examining the distribution in this bar chart can provide additional information, e.g. outliers.Note: This chart includes steps from flows that have not yet completed, so results may differ slightly from other completed-flow metrics. |
Total Incidents vs Time to Resolve (P95) by Severity Level | The total number of incidents vs. the P95 time to resolve incidents, by severity level. This bar chart can help visualize whether higher severity incidents are addressed more quickly. |
Distribution of Time to Resolve Incidents by Severity | Binned frequency distribution of time to resolve incidents by severity level. |
Time to Resolve Incidents by Stage & Severity (P95) | The P95 time to resolve an incident by severity broken out by stage. This bar chart can help visualize whether high priority incidents are quicker to acknowledge or fix. Note: This chart includes steps from flows that have not yet completed, so results may differ slightly from other completed-flow metrics. |
The Quality and Stability by Sub-Org section is focusing on trends broken down by orgs and provides the following metrics:
Metric | Description |
Time to Resolve Incidents (P95 & Avg) by Sub-Org | Shows both the P95 and average time to resolve incidents by sub-org, week-by-week. It can be helpful to compare between orgs. |
Distribution of Time to Resolve Incidents by Sub-Org | The binned frequency distribution of time to resolve incidents by sub-orgs. Examining the distribution in this bar chart can provide additional information such as identifying outliers. |
Change Failure Rate (Sev1/Sev2) by Sub-Org over Time | The number of Sev1/Sev2 incidents as a percentage of production deployments for applications owned by the sub-org. |
Distribution of Time between Failures by Sub-Org | The binned frequency distribution of time between failures by sub-org. This bar chart can help identify orgs where failures are more frequent. |
The Recent Resolved Incidents section lists recent incidents and metrics on time in each stage of the resolution process.
Team DORA Summary Dashboard
The Team DORA Summary dashboard provides a team-level view with respect to each DORA metric, along with trends across teams and supporting details.

Just like the Organization DORA Summary dashboard, this dashboard is structured into two primary sections, the first one focusing on velocity metrics and the second one focusing on quality metrics.
The Velocity Metrics section summarizes how well a team is performing with respect to the velocity component of the DORA framework and provides the following metrics:
Metric | Description |
Average Weekly Deployments Per Application | This DORA velocity metric corresponds to the average number of production deployments per week per application. Elite performing teams are deploying on demand and low performing teams between once per month and once every six months. |
Weekly Deployments by Application over Time | Week-by-week production deployments that involve changes made by team members, broken down by application. It helps see trends and compare between applications. |
Deployed Commits by Application over Time | The number of production commits authored by team members, broken down by application over time. |
Mean Lead Time for Changes | This DORA velocity metric corresponds to the average time it takes for changes authored by team members to go from PR creation to deployment in production. Elite performers reported lead times of less than one day again. The low performers between one month and six months. |
Mean Lead Time by Application over Time | The mean lead time for changes authored by team members, broken down by applications over time. Helps see trends and compare between applications. |
Mean Lead Time Breakdown by Application | The average time that changes authored by team members spend in different stages of the software development life cycle, from PR creation to deployment in production, broken down by application. It is helpful to investigate which stages are delaying the deployment process and whether that varies between teams.Note: This chart includes steps from flows that have not yet completed, so results may differ slightly from other completed-flow metrics. |
The Quality and Stability section summarizes how well a team is performing with respect to the quality and stability aspects of the DORA framework and provides the following metrics:
Metric | Description |
Change Failure Rate (Sev1/Sev2) | This DORA quality metric shows the number of Sev1/Sev2 incidents as a percentage of production deployments for applications owned by the team. Elite performers reported 0-5%. The low performers reported over 64%. |
Change Failure Rate (Sev1/Sev2) by Application over Time | The number of Sev1/Sev2 incidents as a percentage of production deployments for applications owned by the team. |
Number of Incidents by Application by Severity | The number of incidents by severity, for applications owned by the team. This bar chart helps identify problematic applications that have lots of incidents. |
Mean Time to Resolve (Sev1/Sev2) | This DORA quality metric shows the mean time to resolve Sev1/Sev2 incidents for applications owned by the team. High performers reported less than one day. The low performers reported between one week and one month. |
Mean Time to Resolve (Sev1/Sev2) by Application over Time | The mean time to resolve Sev1/Sev2 incidents broken down by applications owned by the team. Helps identify applications for which incidents take longer to resolve, impacting uptime. |
MTTR by Application by Severity | The mean time to resolve incidents for applications owned by the team, broken down by application and severity. |
Setting up the DevOps Module
The DevOps Module is centered around 4 key metrics:
- Deployment Frequency
- Lead Time for Changes
- Change Failure Rate
- Mean Time to Recovery
To compute each of these metrics, several data sources should be connected to the Faros platform, as detailed in the following sections.
Note: For most of the sources below, you will find handy validation dashboards in the Getting Started folder under Faros Reports. These dashboards are provided to all Faros customers and let you inspect the data coming from different sources such as version control systems or task management systems.
Platform Prerequisites
The following should be set up on Faros in order to get the full functionality of the DevOps module:
- Version control, VCS: The data will be used to access deployment data to calculate deployment frequency and lead time for changes. Team membership of the PR author is also used for team attribution.
- Organization and Team Members: This will allow Faros to know the teams in your organization, the reporting structure, and the size of each team.
Deployment Frequency
Schema location: cicd_Deployment
Sources: Events
Validation Dashboard: Deployment Table
Deployment frequency measures how often an organization successfully deploys new code to production and requires deployments to be reported to Faros.
Lead Time for Changes
Schema location: vcs_PullRequest, cicd_Build, cicd_Deployment
Sources: VCS, Events
Validation Dashboards: VCS Source Metrics, Deployment table, Flow Duration Lead Time table
Lead Time for Changes is calculated leveraging the faros-lead-time flow which can be found under Settings > Flows. It requires VCS data to compute times from PR created to PR merged to Build and Deployment events for the rest.
Change Failure Rate
Schema location: ims_Incident, cicd_Deployment
Sources: Incident Management, IMS, Events
Validation Dashboard: IMS Source Metrics, Deployment Table
Change Failure Rate is calculated as the number of incidents per deployment. Incident counts are derived from incidents reported to the Faros platform. The “Application Ownership” association will determine what team the incidents belong to. Deployments should also be reported to Faros. This metric is only computed on high-severity incidents (Sev1 or Sev2) and for deployments to the Production environment.
Mean Time to Recovery
Schema location: ims_Incident
Sources: Incident Management, IMS
Validation Dashboard: IMS Source Metrics
Mean Time to Recovery is calculated leveraging the faros-time-to-resolve flow which can be found under Settings > Flows. Incident counts, stages and times to resolve are derived from incidents reported to the Faros platform. The “Application Ownership” association will determine what team the incidents belong to.
Updated 5 months ago