
Quality Module
The Quality module provides a comprehensive overview of quality across the entire Software Development Lifecycle.
The module consolidates data from multiple sources, enabling insights into trends and correlations within:
- Code quality metrics, including vulnerabilities, bug detection, and code smells, from platforms like SonarQube or the Faros Events System.
- Testing and Deployment processes within the CI/CD pipeline.
- Bugs and Issue Tracking from Task Management Systems, for instance, Jira.
- Incident reporting, covering outages or service, application, or infrastructure degradations, from tools like PagerDuty.
Accessing the Quality Module
The Quality Module is accessible under the Software Quality folder within Faros Reports. It is a premium add-on in the Faros platform. Under Menu > Dashboards, select View All and Faros Reports.
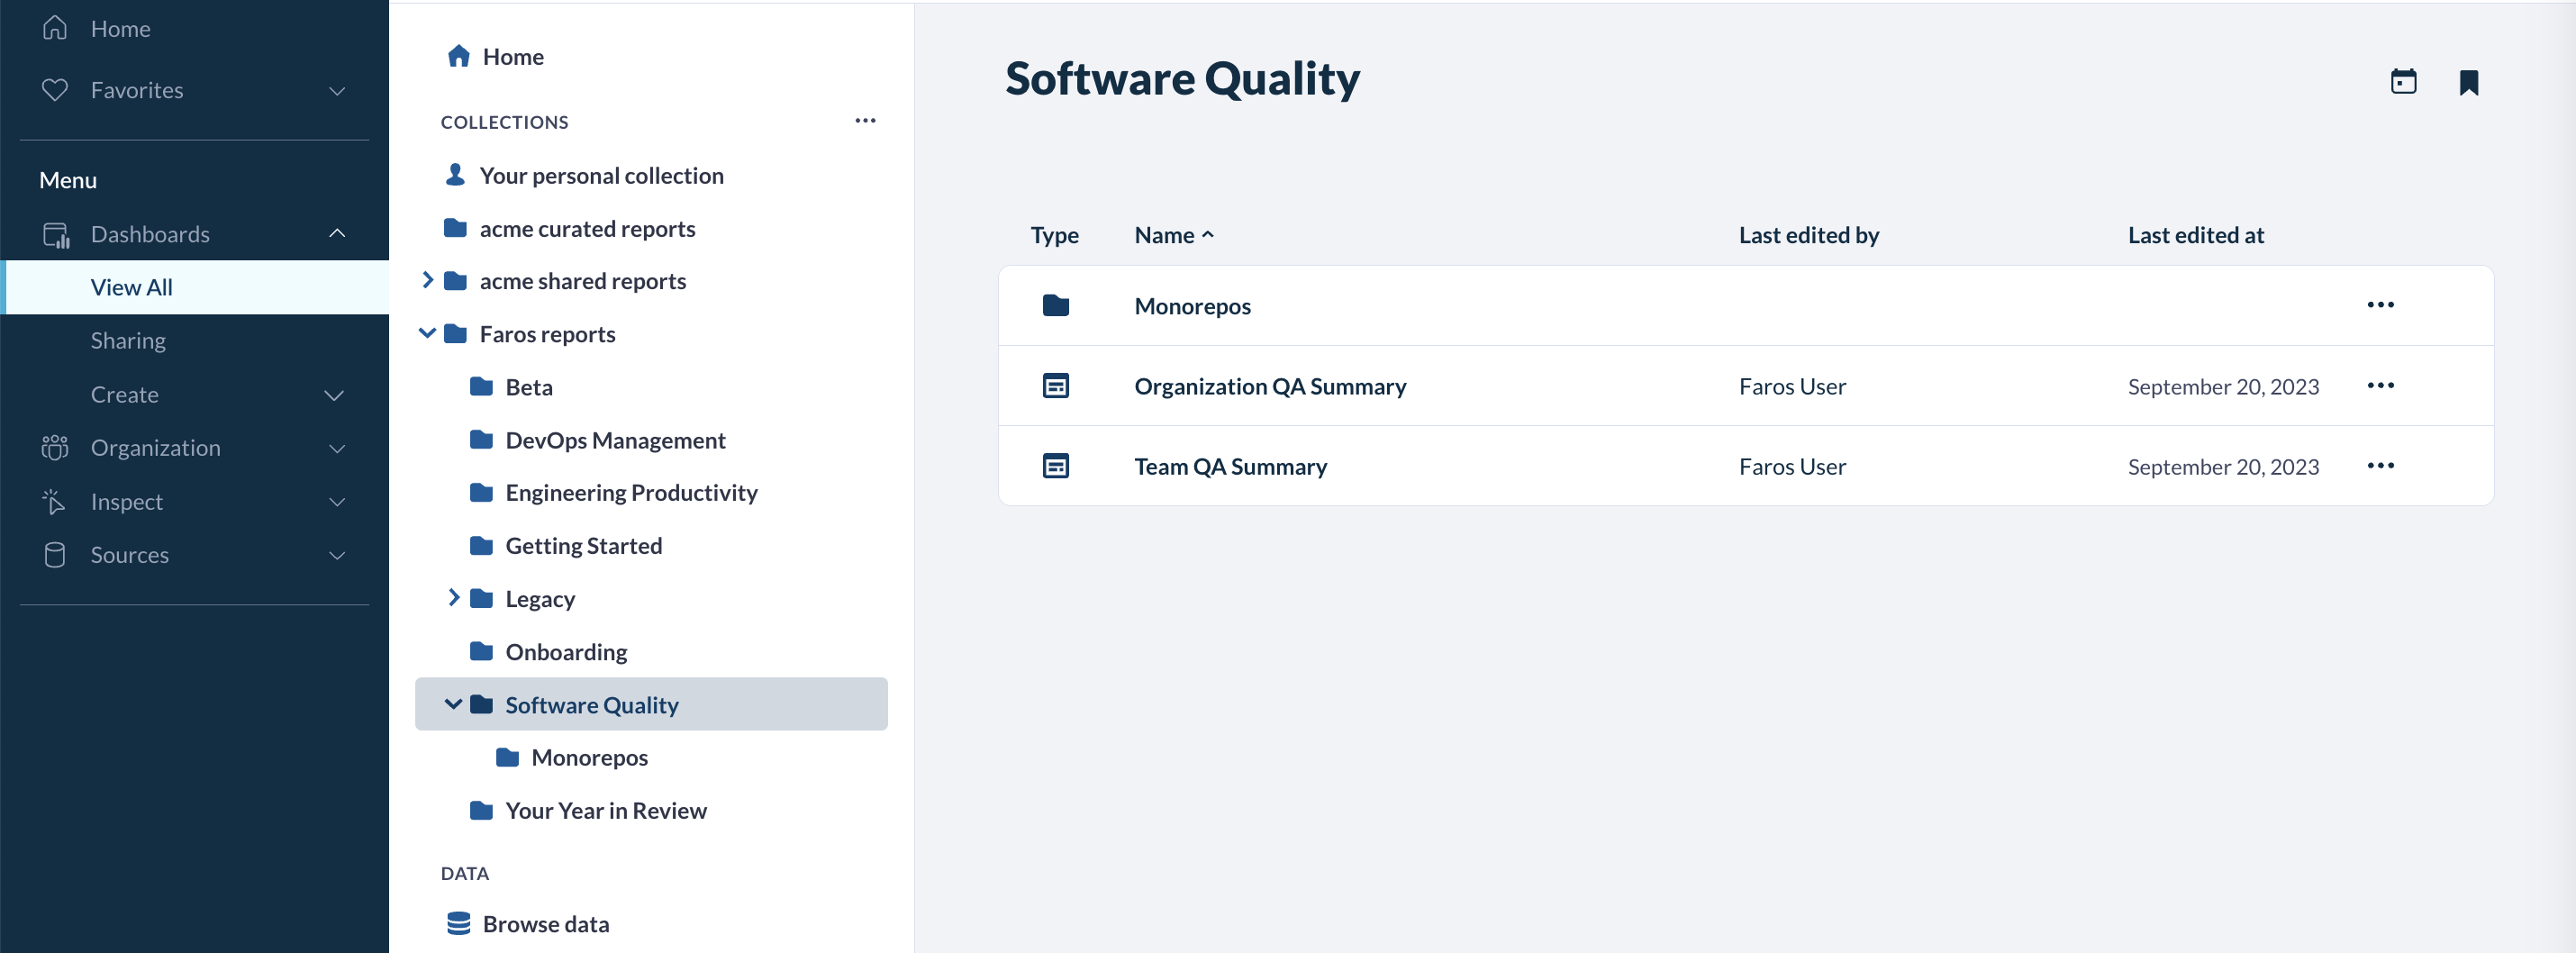
Quality Module Dashboards
The Quality Module is composed of two dashboards, an Organization-level QA summary and a Team-level QA summary. Read on for details about each.
Organization QA Summary Dashboard
The Organization QA Summary dashboard is designed for senior QA leaders with cross-organizational responsibilities and provides comprehensive insights into the quality metrics of all teams within the organization.

The dashboard is structured into three primary sections: Impact, Trends by Sub-Organization Over Time, and Relationships.
All metrics can be segmented by team, environment, and a specific time period.
- The desired time period is set by the Date Filter at the top of the page, and defaults to the previous six months.
- The desired team can be set using the Teams filter, and defaults to all teams. It is also possible to click on any of the team traces to drill down to a specific team
- The environment is set using the Test Environment filter.
The Impact section summarizes how QA positively influences the business, while also pointing out areas where QA can be improved:
Metric | Description |
Failures Caught with Testing | This testing effectiveness metric counts the number of issues identified during testing before deployment to production. |
Potential Time Saved | This impact metric is derived from the count of incidents avoided through testing multiplied by the average time to resolve high-severity past incidents for each application. |
Monthly Total Test Execution Duration | This performance metric helps monitor how much is invested in testing, compared with the previous month’s execution duration, to help contrast against outcomes. |
Incidents | This impact metric shows the number of incidents that occurred but weren’t detected during testing. |
Total Time to Resolve Incidents | This impact metric shows the cumulative time duration taken to address those incidents, from when an incident is created until it is marked as resolved. |
The subsequent section emphasizes five distinct metrics, with each metric displayed across three columns. These columns respectively showcase the monthly trend, a line chart illustrating values based on the time range specified by the time filter, and a categorical bar chart delineating values across different teams.
The five metrics are as follows:
Metric | Description |
Code Coverage | Assesses the quality of the test suite by showing how much of Repository- level source code is tested |
Test Pass Rate | Assesses software quality by showing the ratio of passed test cases to total number of test cases. |
Bugs per Developer | The ratio of bugs assigned to a team to the number of team members helps identify teams that are particularly impacted by quality issues. |
Number of Incidents | The number of incidents by Sub-Org and severity level. A high number of incidents is a good indicator of upstream quality issues in source code. |
Change Failure Rate | The percentage of changes that fail in production for high severity incidents (sev1/sev2). A high CFR indicates that a Sub-Org has issues deploying changes to fix major issues, which can impact reliability and uptime. |
The Relationships section at the bottom lets you visualize how different quality measures correlate with deployment success across your team’s application. Each application is represented by a colored bubble:
Metric | Description |
Change Failure Rate vs. Code Coverage by Application | Shows whether higher code coverage is correlated to higher deployment success. |
Change Failure Rate vs. Test Pass Rate by Application | Shows whether a higher test pass rate is correlated to higher deployment success. |
Team QA Summary Dashboard
The Team QA Summary dashboard provides detailed, granular data specific to an individual team. It’s a great place for Engineering Managers to assess various quality metrics for applications and repositories owned by their teams.

It is composed of three sections focusing on Code Quality, Testing, and Incidents. Similar to the Organization Summary View, all metrics can be analyzed by team, environment and for a desired time window, with optional filters by Repository and Application.
The Code Quality section provides additional metrics at the PR level (i.e., coverage is computed on the incremental changes in each PR instead of on the entire repository) and repository level:
Metric | Description |
Pull Request Code Quality | These quality metrics show average bugs, code smells, duplications, and vulnerabilities over time. Spikes in any of these metrics is an indicator of quality issues for a team. |
Pull Request Code Coverage Distribution | Shows the count of recent pull requests grouped according to the amount of code coverage provided on the new code, to show potential gaps in code coverage for new code. |
Average Repository Code Coverage | Helps monitor repository code coverage compared to standard quality benchmarks. Higher code coverage is a proxy for higher quality. |
Repository Code Coverage Over Time | Helps track improvements or degradation of code coverage per repository over time. Lower code coverage can correlate to lower deployment success |
Code Coverage by Repository | Shows code coverage per repository relative to goal. |
Repository Level Code Quality Table | Displays key quality metrics per repository based on most recent measures. |
The Testing section shows additional information on test execution, pass rate, and counts over time and by repository:
Metric | Description |
Test Execution Duration by Repository Over Time | This chart shows the amount of compute time being dedicated to testing for each repository. It shows investment in testing per repository |
Test Execution Duration Distribution | Breaks down test execution for the test suite of each repository. |
Average Test Pass Rate | The ratio of passed test cases to total number of test cases. Lower test pass rates can correlate to lower deployment success. |
Test Pass Rate by Repository Over Time | The ratio of passed test cases to total number of test cases over time and by repository. A drop in pass rate could be a leading indicator of deployment issues. Conversely a pass rate that is always close to 100% may indicate tests are not covering the right areas. |
Test Success/Failure Rate by Repository | The ratio of passed test cases to total number of test cases broken down by repository, highlighting problematic areas. |
Test Execution by Suite Type | The number of tests executed, broken down by test suite type. Shows relative investment in different types of tests. |
Test Execution Counts Over Time | The number of tests executed that passed and failed over time. Helps track improvements in test pass rate. |
Test Success/Failure Rate by Repository | Shows the number of tests executed that passed and failed, broken down by repository and highlighting areas with more quality issues. |
The Incidents section breaks incidents down by severity and over time. It is a useful summary of the effectiveness of QA in terms of averting problems and incidents in production, at the team level:
Metric | Description |
Incidents by Severity Over Time | The number of incidents over time, broken down by severity type, highlighting spikes in incidents and their severity. |
Failures Caught with Testing
| This testing effectiveness metric counts the number of issues identified during testing before deployment to production. |
Potential Time Saved | This impact metric is derived from the count of incidents avoided through testing multiplied by the average time to resolve high-severity past incidents for each application. |
Incidents | This impact metric shows the number of incidents that occurred but weren’t detected during testing. |
Time to Resolve Incidents | This impact metric shows the cumulative time duration taken to address those incidents, from when an incident is created until it is marked as resolved. |
Change Failure Rate (Sev1/Sev2) | Number of Sev1/Sev2 incidents as a percentage of production deployments for applications owned by the team. |
Change Failure Rate by Application Over Time | The number of Sev1/Sev2 incidents as a percentage of production deployments for applications owned by the team, over time and by application. |
Number of Incidents by Application by Severity | The number of incidents broken down by application and severity. |
Setting up the Quality Module
The Quality Module is centered around 5 key metrics:
- Code Coverage
- Test Pass Rate
- Open Bugs per Developer
- Incidents
- Change Failure Rate
To compute each of these metrics, several data sources should be connected to the Faros platform, as detailed in the following sections.
Note: For most of the sources below, you will find handy validation dashboards in the Getting Started folder under Faros Reports. These dashboards are provided to all Faros customers and let you inspect the data coming from different sources such as Incident Management Systems or Task Management Systems.
Platform Prerequisites
The following should be set up on Faros in order to get the full functionality of the Quality module:
-
Version control, VCS: The data will be used to link any QA issues to specific code changes.
-
Organization and Team Members: This will allow Faros to know the teams in your organization, the reporting structure, and the size of each team.
-
Team Attribution: To help determine which team each of the metrics is associated with
- Repositories and Repository Ownership: For code coverage and testing
- Board Ownership: For bugs
- Applications and Application Ownership: For incidents and change failure rate
Code Coverage
Schema location: qa_CodeQuality Coverage
Sources: SonarCloud or SonarQube
Validation Dashboard: QA Code Quality Source Metrics
There are two ways of reporting Code Coverage and both types are used in the Quality Module:
- It can be calculated at the Repository-level to give the overall code coverage state, and this is typically done after a PR is merged during the project build.
- It can be calculated at the Pull Request-level showing the coverage just for the incremental changes, and this is computed during the Pull Request review.
Each metric value should be associated with a particular commit in VCS and “Repository Ownership” will determine which team a commit belongs to.
Test Pass Rate
Schema location: qa_TestExecution Test Status (Success/Failure)
Sources: Xray or Events or Test Results Reporter
Validation Dashboard: QA Testing Source Metrics
A testing suite is typically run as part of the build process before deployment. The results of these tests should be reported to the Faros platform and include at a minimum:
- a timestamp
- the resulting test status (Success or Failure)
- the particular commit in VCS corresponding to the code being tested.
“Repository Ownership” will determine which team a commit belongs to.
Bugs per Developer
Schema location: tms_Task
Sources: Task Management, TMS
Validation Dashboard: TMS Source Metrics
Tasks of type “Bug” should be reported to the Faros platform. The “Board Ownership” association will determine what team the bugs belong to and the Org/Team setup will determine the number of developers on a team.
Incidents
Schema location: ims_Incident
Sources: Incident Management, IMS
Validation Dashboard: IMS Source Metrics
Incident counts are derived from incidents reported to the Faros platform. The “Application Ownership” association will determine what team the incidents belong to.
Change Failure Rate
Schema location: cicd_Deployment
Sources: Events
Validation Dashboard: Deployment Table
Change Failure Rate is calculated as the number of incidents per deployment. Setup for Incidents is already described above and Deployments should also be reported to Faros. This metric is only computed on high-severity incidents (Sev1 or Sev2) and for deployments to the Production environment.
Updated 4 months ago