
Reporting Custom Metrics
Faros computes different metrics as it connects to your various systems, but there might be occasions when you have computed a metric on your end and want to input it into Faros. Good news! Faros supports generic custom metrics, allowing you to easily add your own data to the system. This document will guide you on sending custom metrics to Faros using our API and how to view these metrics in dashboards alongside other Faros data.
Example - Lunch Expenses
For instance, let’s consider a scenario where you want to track how much your teams spend on lunch expenses. No data like that currently exists in Faros, so this is a perfect use case for a custom metric specific to your organization.
Interacting with the API
To send information to the Faros API about the custom metric you want to track, you’ll need to include metadata and data for the metric. This is represented as:
Metric Definition
This includes the name, description, form, and prefix for your custom metric. In our example, it could be “Lunch Expenses” with the description “Weekly lunch expenses for different teams,” as well as a "number" form and the dollar sign "$" prefix.
Metric Values
This is the actual value that you want to track. For the lunch expenses example, you would send the actual values, such as $500 for Team A and $450 for Team B.
Metrics can be attached to various objects depending on what they're representing. For example, you can connect a metric value to the team object via the TeamMetric table. In other instances, you could connect an application. Reach out to Faros to help determine your own specific API payload. For examples of payload commands, see the Payload Command Examples page.
Accessing Your Data
GraphQL Database
Once you send your custom metric data through the API, it can be found immediately in the graph database. You can check it with the following graphQL query:
query {
  faros_MetricDefinition {
    name
    description
    values {
      value
      computedAt
      team {
        team {
          name
        }
      }
    }
  }
}
Metrics Tables
After a report sync has run, you can access this data through the Faros Metric table, seen in the image below:
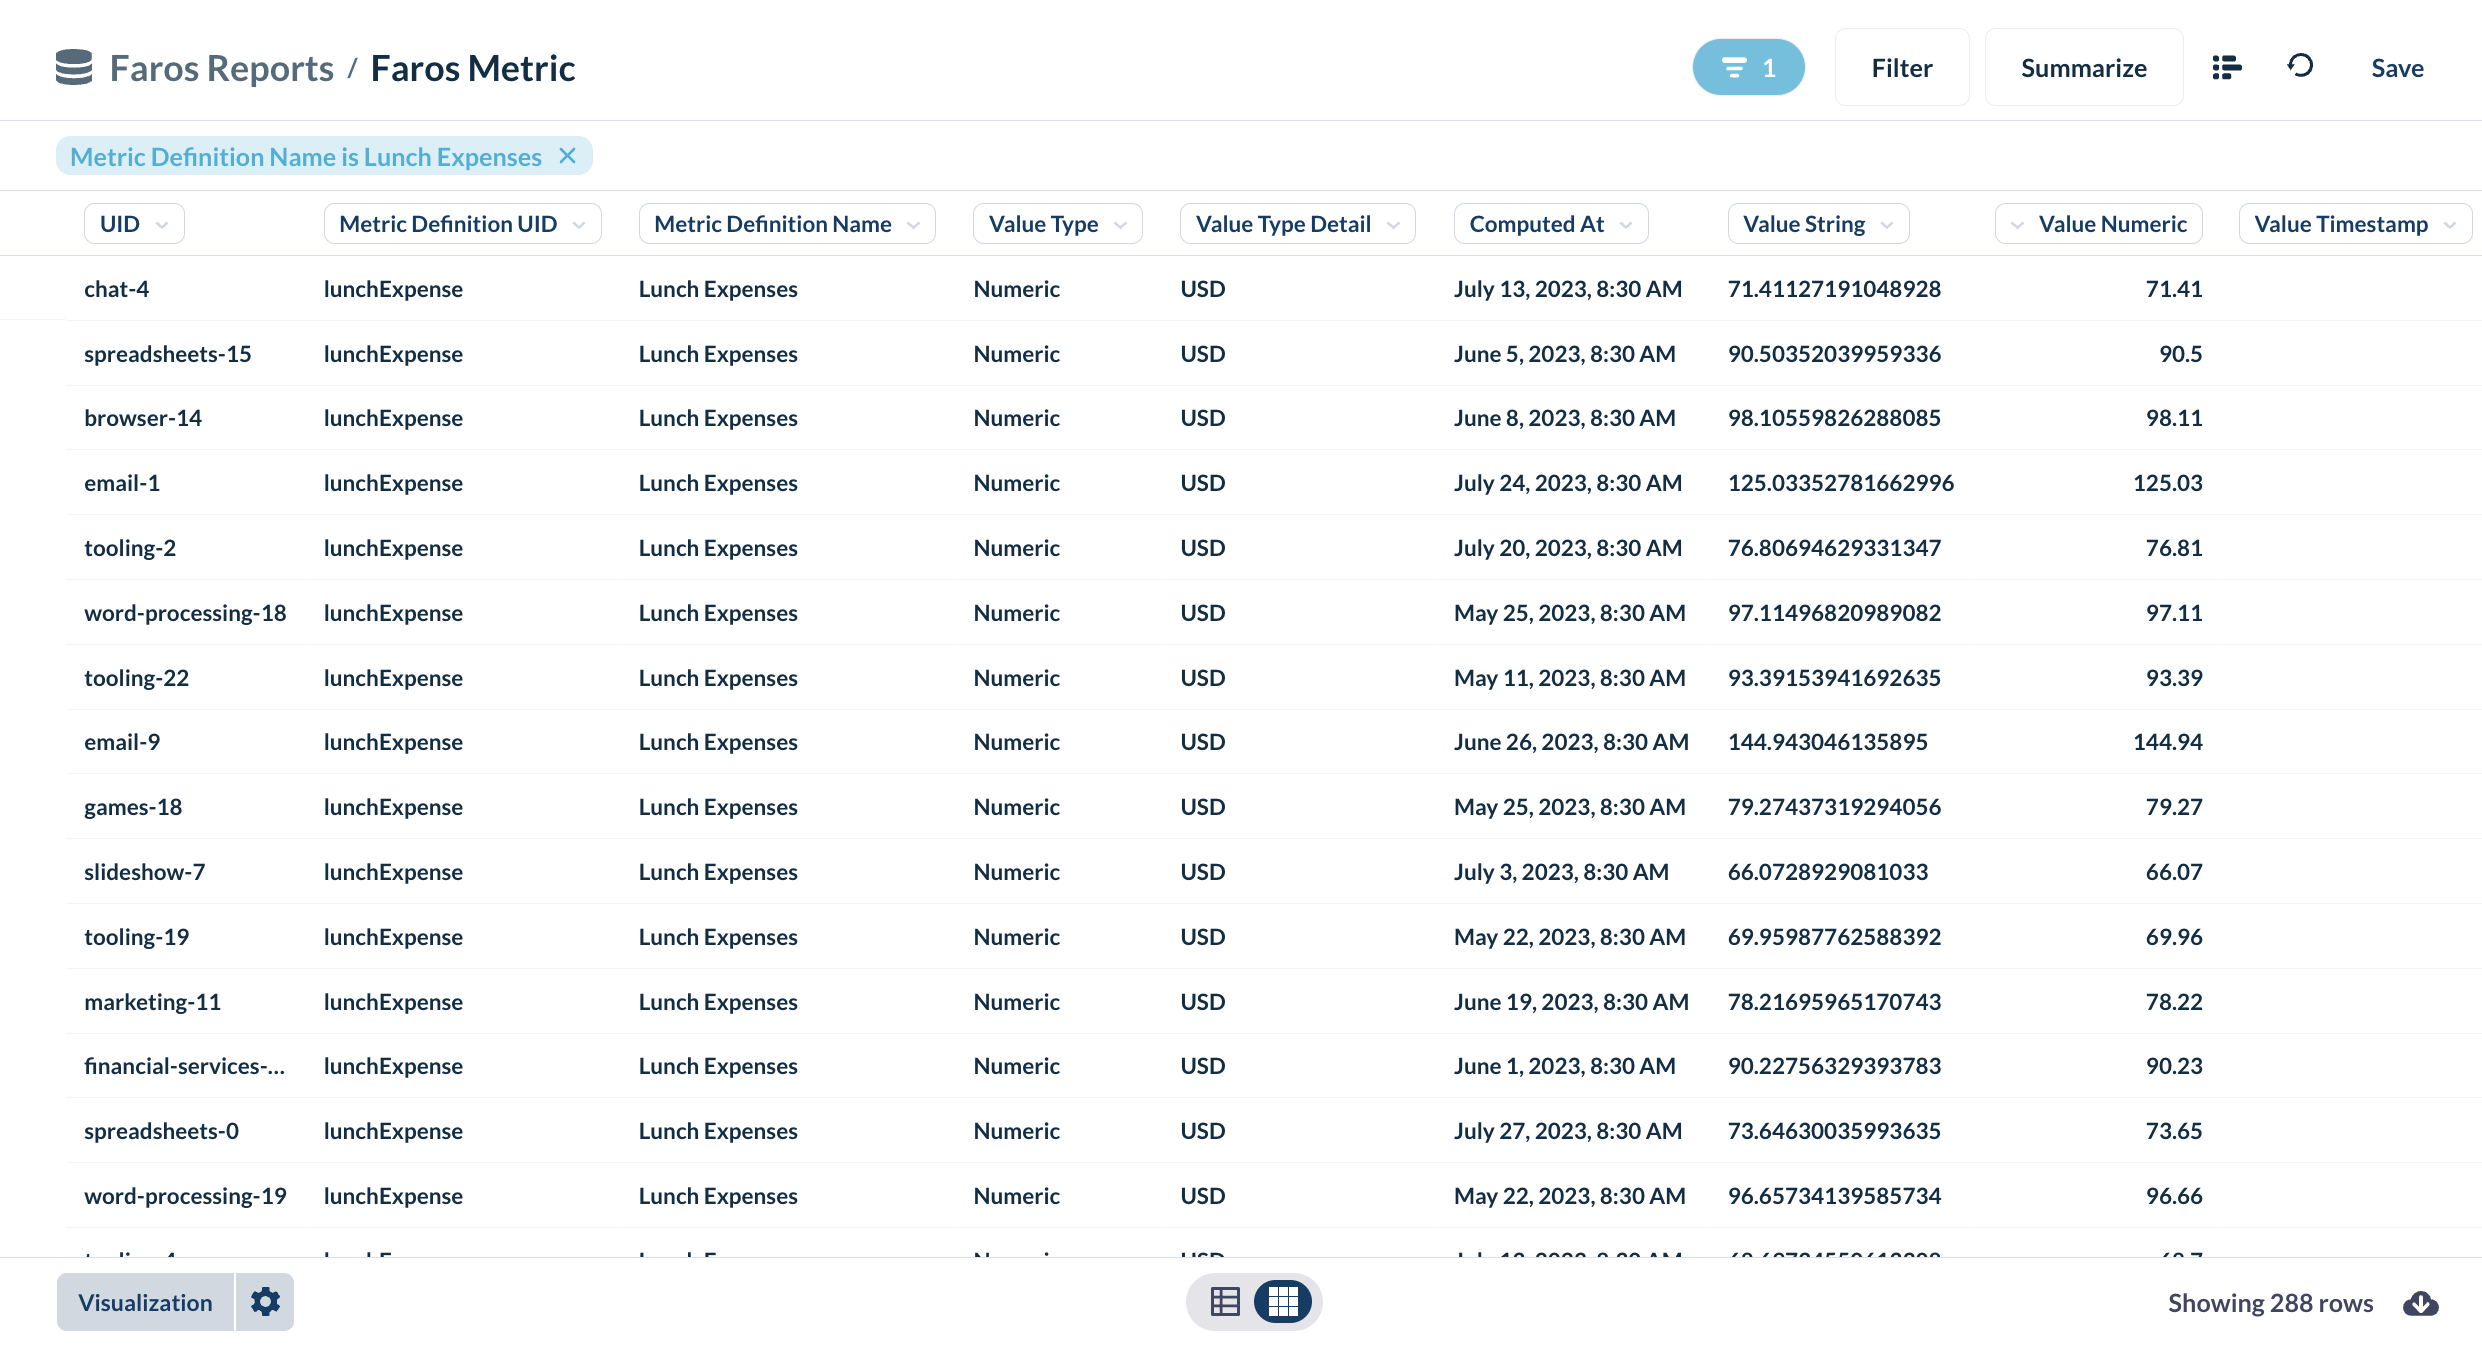
Faros Metric Table
Building Dashboards
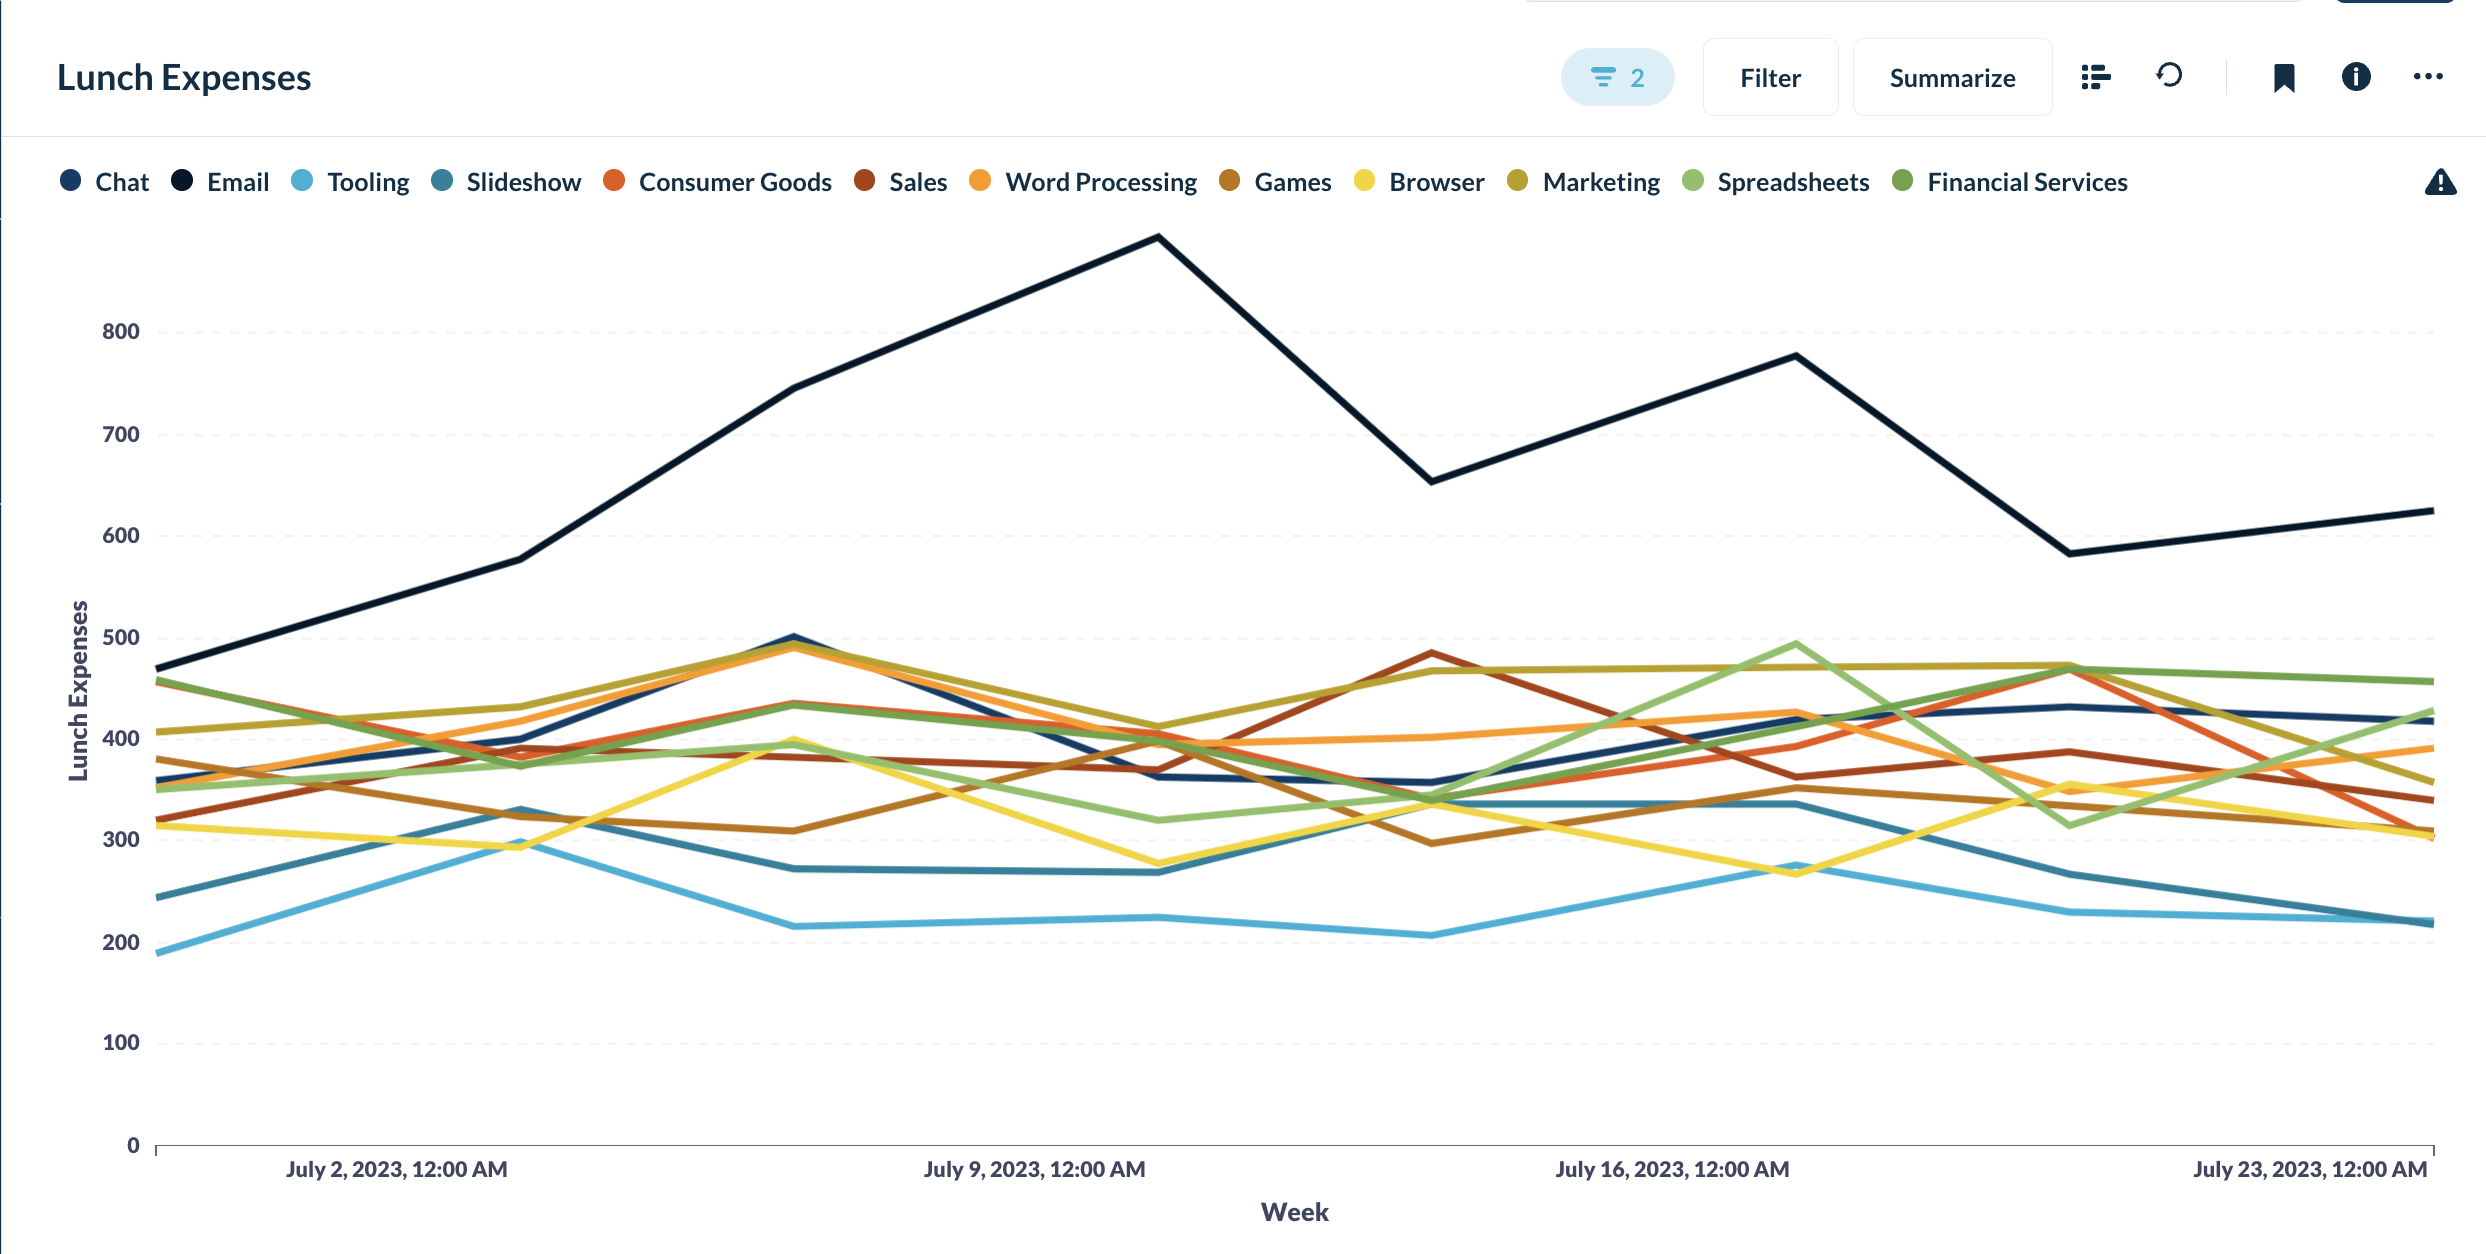
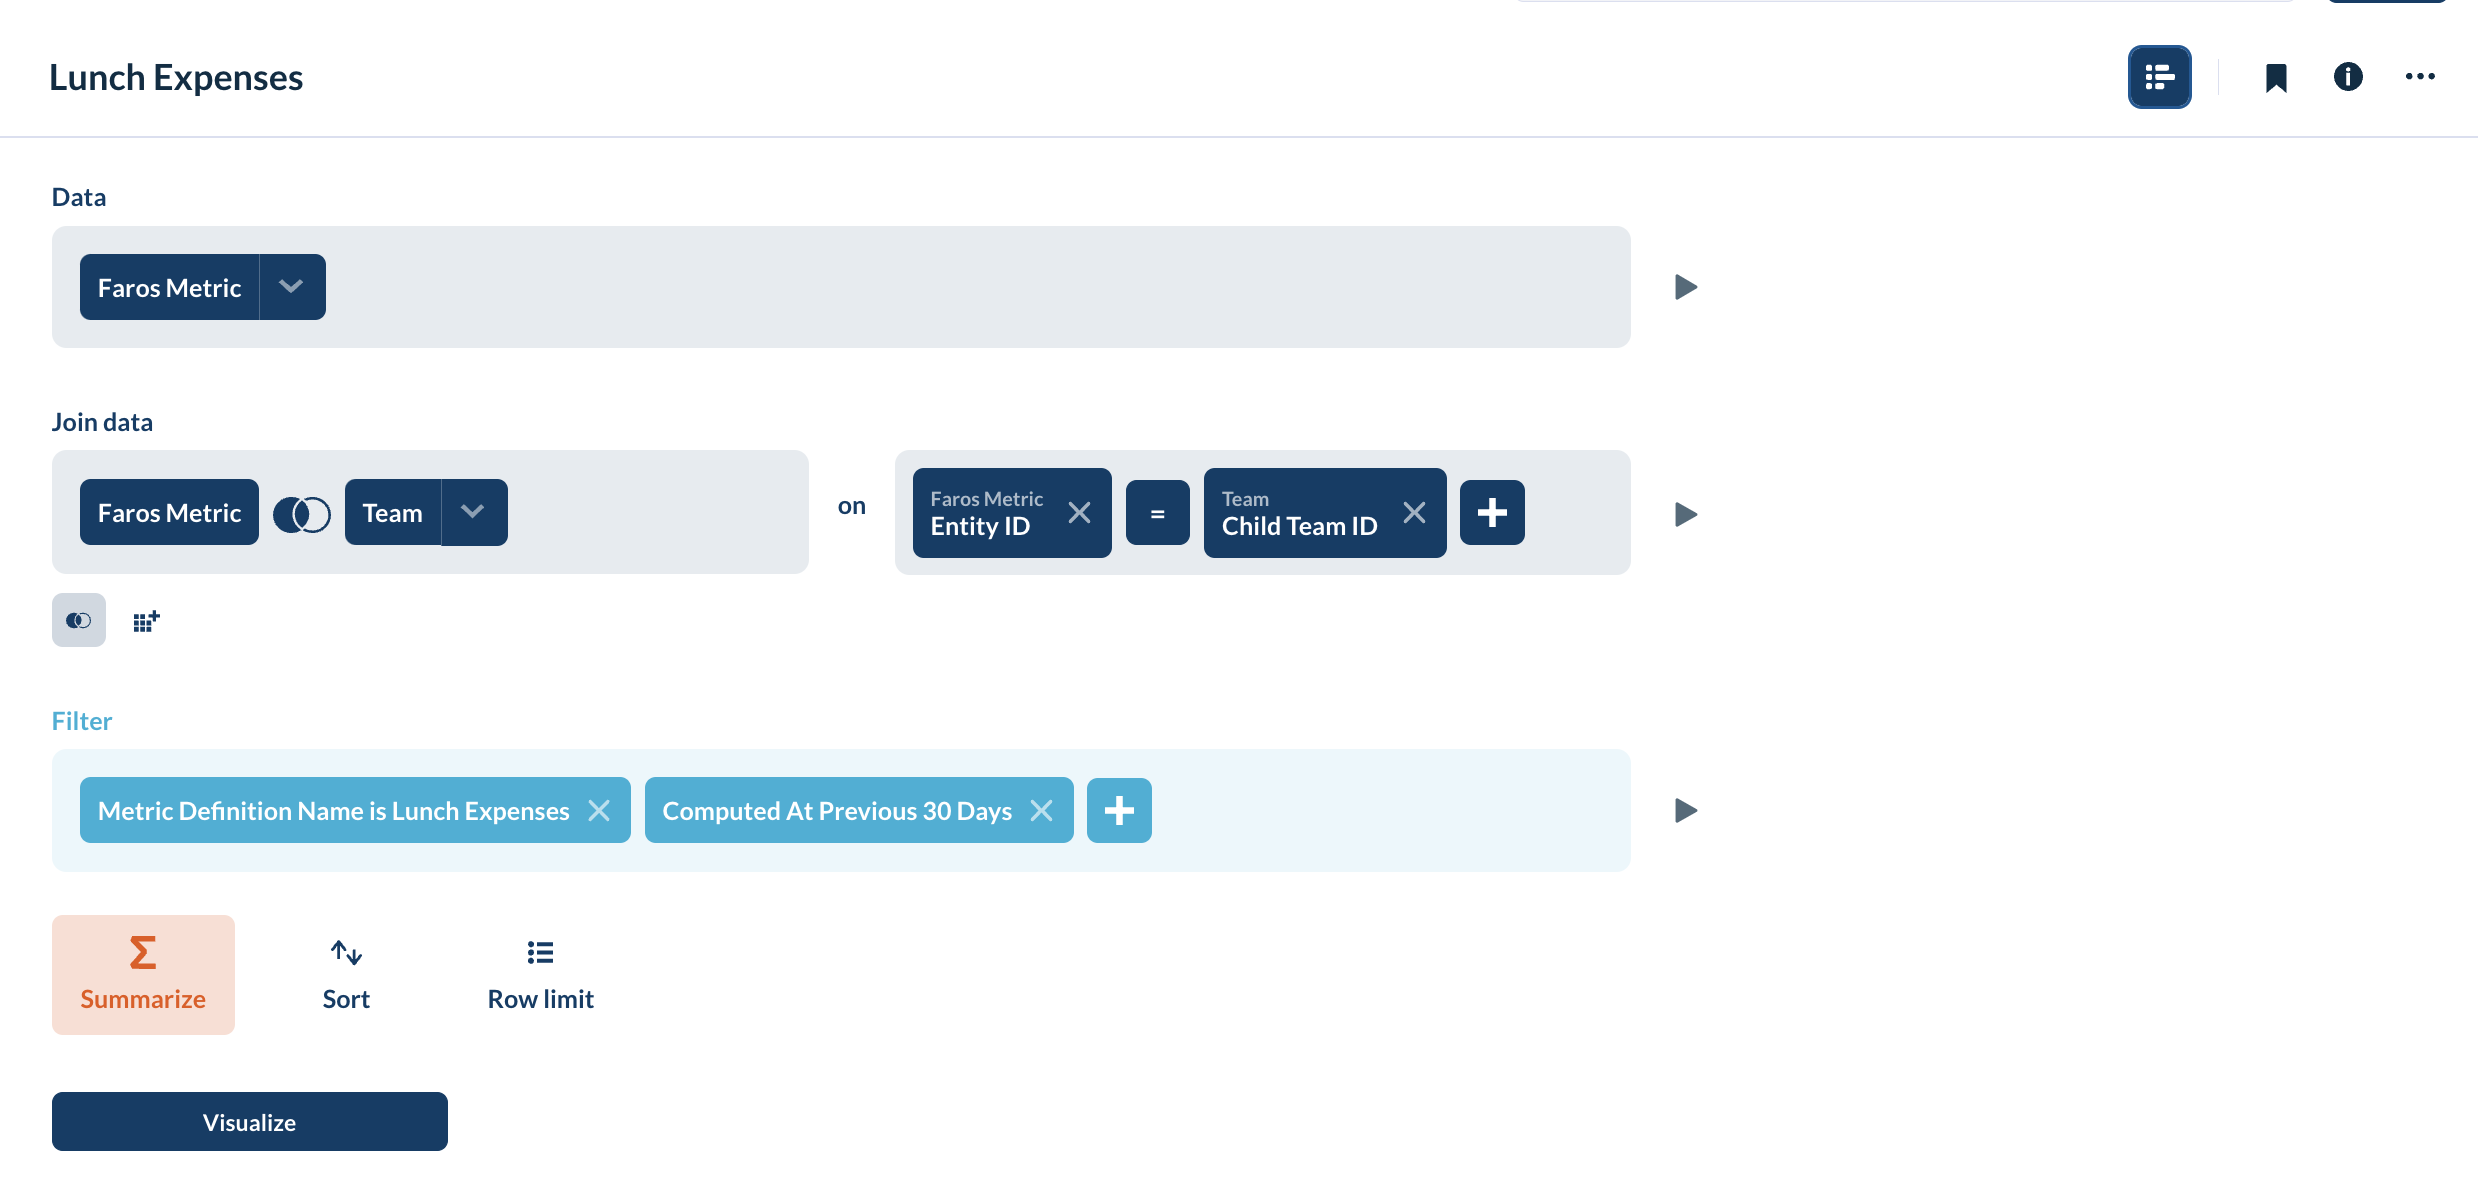
With the custom metric data now in Faros, you can build dynamic charts to visualize how different teams’ spending changes over time, as well as add the data to pre-existing dashboards. Additionally, you can combine this data with other relevant information, such as the number of people on each team, to gain deeper insights. Below, you can see an example dashboard tracking lunch expenses for various teams over a set time period.
Using Custom Metrics on Scorecard
Custom metrics can also be utilized on your Faros Scorecard. To do this, you will need to set up additional thresholds. If you’re interested in integrating your custom metrics into the Scorecard, please get in touch with your Faros support person for assistance.
Updated 5 months ago