
Developer Experience Module
The Developer Experience module helps you leverage employee surveys to their full potential.
It centralizes survey data from agile, team health, and developer experience surveys in one place and intersects sentiment data from employee responses with telemetry-based data from engineering operations.
This novel blended visibility into the complete developer experience allows you to take corrective measures faster and monitor their impact on engagement, retention, and operational excellence over time.
Accessing the Developer Experience Module
The Developer Experience Module is accessible under the Developer Experience folder within Faros Reports. It is a premium add-on in the Faros platform. Under Menu > Dashboards, select View All and Faros Reports. It is also accessible via the 9-dot Modules icon at the top right of the Faros application.

Developer Experience Dashboards
The Developer Experience module is composed of five dashboards. The Developer Experience Summary dashboard provides an overview of your survey results. The other dashboards let you deep dive into four key dimensions of developer experience: Alignment and Goals, Developer Productivity, Quality and Speed and Agility. We will go into detail about each one and how to set them up below.
Developer Experience Summary Dashboard
The Developer Experience Summary dashboard summarizes survey results and provides trends by team and question categories/dimensions over time.

The dashboard is structured into three primary sections: survey score, question categories scores and surveys summary.
All metrics can be filtered by team, survey, question category and a specific time period.
- The desired team can be set using the Teams filter, and defaults to all teams. It is also possible to click on any of the team traces to drill down to a specific team
- The desired time period is set by the Date filter at the top of the page, and defaults to the previous 12 months.
- By default all surveys are shown. You can select a specific survey or set of surveys as desired using the Survey dropdown menu
- By default all question categories are shown. You can select a specific question category or set of categories as desired using the Question Category dropdown menu
The Survey Score section provides an average score for your surveys based on the filter selected. It all provides trends over time and a breakdown by team
Metric | Description |
Average Survey Score | Average score for all questions in survey responses received from the selected teams and time window |
Survey Score by Sub-Org Over Time | Average score for all questions in survey responses, by team and over time |
Survey Score Distribution by Sub-Org | Breakdown of survey scores by team |
The Question Categories Scores section provides a breakdown of survey scores by question category, by sub-org and over time.
Metric | Description |
Average Score by Question Category | Average score in survey responses received from the selected teams and time window, broken down by question categories |
Average Score by Question Category by Sub-Org | Average score in survey responses received from the selected teams and time window, broken down by question categories and teams |
Average Score by Question Category over Time | Average score in survey responses received from the selected teams and time window, broken down by question categories and over time |
The Surveys Summary section provides a summary of recent surveys as well as response count over time and by teams.
Metric | Description |
Recent surveys | Information from recent surveys including their name, start and end date, type, number of questions, status and response rate |
Response Count Over Time | Total number of survey responses collected each week |
Response Count by Teams | Number of response by sub-org |
Developer Experience Alignment and Goals Dashboard
The Developer Experience Alignment and Goal dashboard summarizes survey results for the Alignment and Goals question category and intersects it with relevant metrics such as progress to goal or ratio of unplanned work to help analyze and diagnose underlying factors, compare sentiment with data, preempt issues, set goals and track progress.

The dashboard is structured into two primary sections: alignment and goals survey score, and metrics
All metrics can be filtered by team and a specific time period.
- The desired team can be set using the Teams filter, and defaults to all teams. It is also possible to click on any of the team traces to drill down to a specific team
- The desired time period is set by the Date filter at the top of the page, and defaults to the previous 12 months.
The Alignment and Goals Survey Score section provides an average score for Alignment and Goals questions. It all provides trends over time and a breakdown by team
Metric | Description |
Average Alignment and Goals Survey Score | Average score for Alignment and Goals survey questions in survey responses received from the selected teams and time window |
Alignment and Goals Survey Score by Sub-Org Over Time: | Average score for Alignment and Goals survey questions in survey responses, by team and over time |
Alignment and Goals Survey Score by Sub-Org | Breakdown of survey scores for Alignment and Goals survey questions by team |
The Alignment and Goals Metrics section shows relevant metrics such as progress to goal, ratio of unplanned work or backlog size vs WIP and intersects them with survey data. Like anything else in Faros, you can of course customize the metrics shown to those that make most sense for your organization and at this point in time.
Metric | Description |
Progress to Goal | Number of tasks completed relative to the number of tasks that should have been completed at this point in a release, expressed in terms of expected workdays (A negative value indicates being behind schedule whilst a positive value indicates being ahead of schedule) |
Progress to Goal by Sub-Org | Number of tasks completed relative to the number of tasks that should have been completed at this point in a release, expressed in terms of expected workdays (A negative value indicates being behind schedule whilst a positive value indicates being ahead of schedule) |
Progress towards Release Plan by Sub-Org over Time | Number of tasks completed relative to the number of tasks that should have been completed at this point in a release, expressed in terms of expected workdays, broken down by sub-orgs (A negative value indicates being behind schedule whilst a positive value indicates being ahead of schedule) |
Alignment and Goals Progress to Goal Scatter | Progress to Goal for each team, plotted against Alignment and Goals score for that team. Each team is a bubble. |
Sprint Planned Work Ratio | The fraction of task points completed in a sprint that were planned. |
Sprint Planned Work Ratio by Sub-Org | The fraction of task points completed in a sprint that were planned. |
Sprint Planned Work Ratio by Week | The fraction of task points completed in a sprint that were planned by week |
Alignment and Goals Ratio of Unplanned Work Scatter | Ratio of unplanned work for each team, plotted against Alignment and Goals score for that team. Each team is a bubble. |
Backlog Size Ratio
| Ratio of the number of tasks in backlog to those in progress and done |
Backlog Size Ratio by Sub-Org | Ratio of the number of tasks in backlog to those in progress and done by sub-org |
Number of Tasks by Status | Number of tasks in a status, week-by-week |
Alignment and Goals Backlog Scatter | * * * * Backlog size vs WP for each team, plotted against Alignment and Goals score for that team. Each team is a bubble. |
Developer Experience Developer Productivity Dashboard
The Developer Experience Developer Productivity dashboard summarizes survey results for the Developer Productivity question category and intersects it with relevant metrics such as task throughput or PR Merge rate to help analyze and diagnose underlying factors, compare sentiment with data, preempt issues, set goals and track progress.
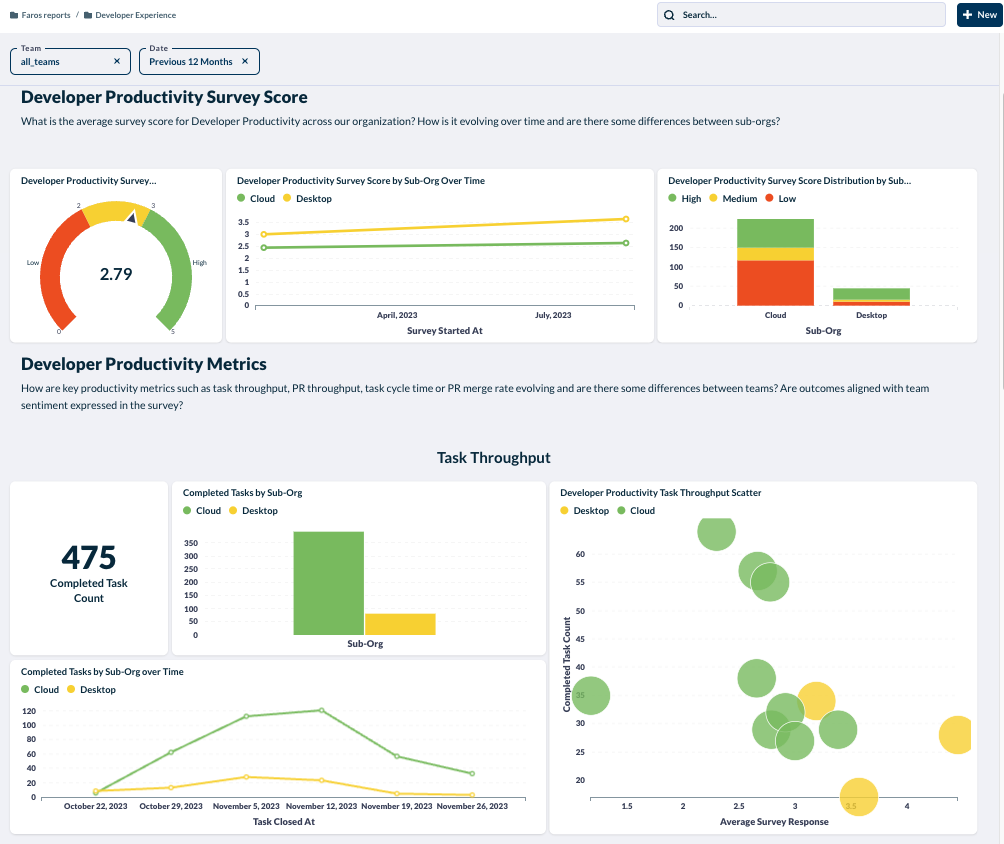
The dashboard is structured into two primary sections: developer productivity survey score, and metrics
All metrics can be filtered by team and a specific time period.
- The desired team can be set using the Teams filter, and defaults to all teams. It is also possible to click on any of the team traces to drill down to a specific team
- The desired time period is set by the Date filter at the top of the page, and defaults to the previous 12 months.
The Developer Productivity Survey Score section provides an average score for Developer Productivity questions. It all provides trends over time and a breakdown by team
Metric | Description |
Developer Productivity Survey Score | Average score for Developer Productivity survey questions in survey responses received from the selected teams and time window |
Developer Productivity Survey Score by Sub-Org Over Time: | Average score for Developer Productivity survey questions in survey responses, by team and over time |
Developer Productivity Survey Score by Sub-Org | Breakdown of survey scores for Developer Productivity survey questions by team |
The Developer Productivity Metrics section shows relevant metrics such as task throughput, PR throughput, task cycle time and PR merge rate and intersects them with survey data. Like anything else in Faros, you can of course customize the metrics shown to those that make most sense for your organization and at this point in time.
Metric | Description |
Completed Task Count | Total count of tasks that were completed inthe time range |
Completed Tasks by Sub-Org | Count of tasks that were completed in the time range by sub-org |
Completed Tasks by Sub-Org over Time | Count of tasks that were completed by sub-org over time |
Developer Productivity Task Throughput Scatter | Task throughput for each team, plotted against developer productivity score for that team. Each team is a bubble. |
Completed PR Count | Total count of pull requests that were completed in the time range |
Completed PR Count by Sub-Org | Count of pull requests that were completed in the time range by sub-org |
Completed PR Count by Sub-Org over Time | Count of pull requests that were completed by sub-org over time |
Developer Productivity PR Throughput Scatter | * * * * PR throughput for each team, plotted against developer productivity score for that team. Each team is a bubble. |
Task Cycle Time | Average overall time it takes for tasks to be completed, starting from when they are first in progress to when they are last closed |
Task Cycle Time by Sub-Org | Average overall time it takes for tasks to be completed, starting from when they are first in progress to when they are last closed, broken down by sub-orgs |
Task Cycle Time by Sub-Org over Time | Average overall time it takes for tasks to be completed, starting from when they are first in progress to when they are last closed, broken down by sub-orgs |
Developer Productivity Task Cycle Time Scatter | Task Cycle Time for each team, plotted against developer productivity score for that team. Each team is a bubble |
Monthly Pull Request Merge Rate | Average number of pull requests merged per team member per month |
Monthly Pull Request Merge Rate by Sub-Org | Average number of pull requests merged perteam member per month |
Pull Request Merge Rate by Sub-Org over Time | Average number of pull requests merged per team member in a week, broken down by sub-orgs |
Developer Productivity PR Merge Rate Time Scatter | PR Merge Rate for each team, plotted against developer productivity score for that team. Each team is a bubble. |
Developer Experience Quality Dashboard
The Developer Experience Quality dashboard summarizes survey results for the Quality question category and intersects it with relevant DORA metrics such as Change Failure Rate or Bugs to developer to help analyze and diagnose underlying factors, compare sentiment with data, preempt issues, set goals and track progress.
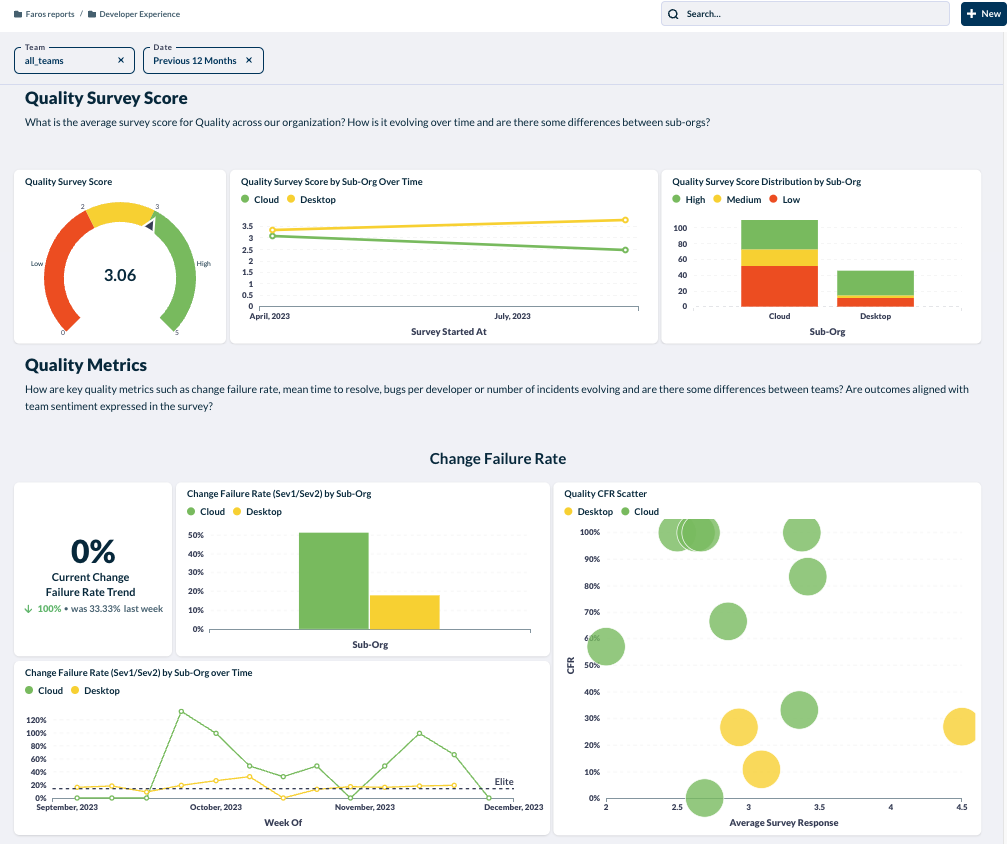
The dashboard is structured into two primary sections: quality survey score, and metrics
All metrics can be filtered by team and a specific time period.
- The desired team can be set using the Teams filter, and defaults to all teams. It is also possible to click on any of the team traces to drill down to a specific team
- The desired time period is set by the Date filter at the top of the page, and defaults to the previous 12 months.
The Quality Survey Score section provides an average score for Quality questions. It all provides trends over time and a breakdown by team
Metric | Description |
Quality Survey Score | Average score for Quality survey questions in survey responses received from the selected teams and time window |
Quality Survey Score by Sub-Org Over Time: | Average score for Quality survey questions in survey responses, by team and over time |
Quality Survey Score by Sub-Org | Breakdown of survey scores for Quality survey questions by team |
The Quality Metrics section shows relevant metrics such as Change Failure Rate, Mean Time to Resolve, Bugs Per Developer, or Incidents and intersects them with survey data. Like anything else in Faros, you can of course customize the metrics shown to those that make most sense for your organization and at this point in time.
Metric | Description |
Current Change Failure Rate Trend | Weekly trend in Change Failure Rate for high-severity incidents (Sev1/Sev2) |
Change Failure Rate (Sev1/Sev2) by Sub-Org | Change Failure rate for high-severity incidents (Sev1/Sev2) with teams based on Application Ownership |
Change Failure Rate (Sev1/Sev2) by Sub-Org over Time | Number of Sev1/Sev2 incidents as a percentage of production deployments for applications owned by the sub-org |
Quality CFR Scatter | Change failure rate for each team, plotted against quality score for that team. Each team is a bubble. |
Mean Time To Resolve Trend (Sev1/Sev2) | Mean time to resolve Sev1/Sev2 incidents over the latest full week compared to the week before |
Mean Time to Resolve (Sev1/Sev2) Breakdown by Sub-Org | Mean time to resolve Sev1/Sev2 incidents for applications owned by sub-orgs, broken down by stages |
Mean Time To Resolve (Sev1/Sev2) by Sub-Org over Time | Mean time to resolve Sev1 and Sev2 incidents for applications owned by sub-orgs over time |
Quality MTTR Scatter | Mean time to resolve incidents for each team, plotted against quality score for that team. Each team is a bubble. |
Current Bugs Per Developer Trend | Weekly trend in the ratio of bugs assigned to a team to the number of team members. |
Open Bugs Per Developer by Sub-Org | Ratio of bugs assigned to a team to the number of team members for bugs that are currently not in a 'Done' state. |
Bugs Per Developer by Sub-Org Over Time | Week by week ratio of bugs assigned to a team to the number of team members. |
Quality Bugs per Developer Scatter | Open bugs per developer for each team, plotted against quality score for that team. Each team is a bubble |
Current Weekly Incidents Trend | Number of new incidents created during most recent complete week compared with the week before |
Incidents by Sub-Org and Severity | Number of Sev1/Sev2/Sev3/Sev4/Sev5 incidents by sub-orgs |
Incidents by Sub-Org Over Time | Number of incidents created by sub-org over time |
Quality Incidents Time Scatter | Number of incidents for each team, plotted against quality score for that team. Each team is a bubble. |
Developer Experience Speed and Agility Dashboard
The Developer Experience Speed and Agility dashboard summarizes survey results for the Speed and Agility question category and intersects it with relevant metrics such as frequency of deployments and lead time to help analyze and diagnose underlying factors, compare sentiment with data, preempt issues, set goals and track progress.
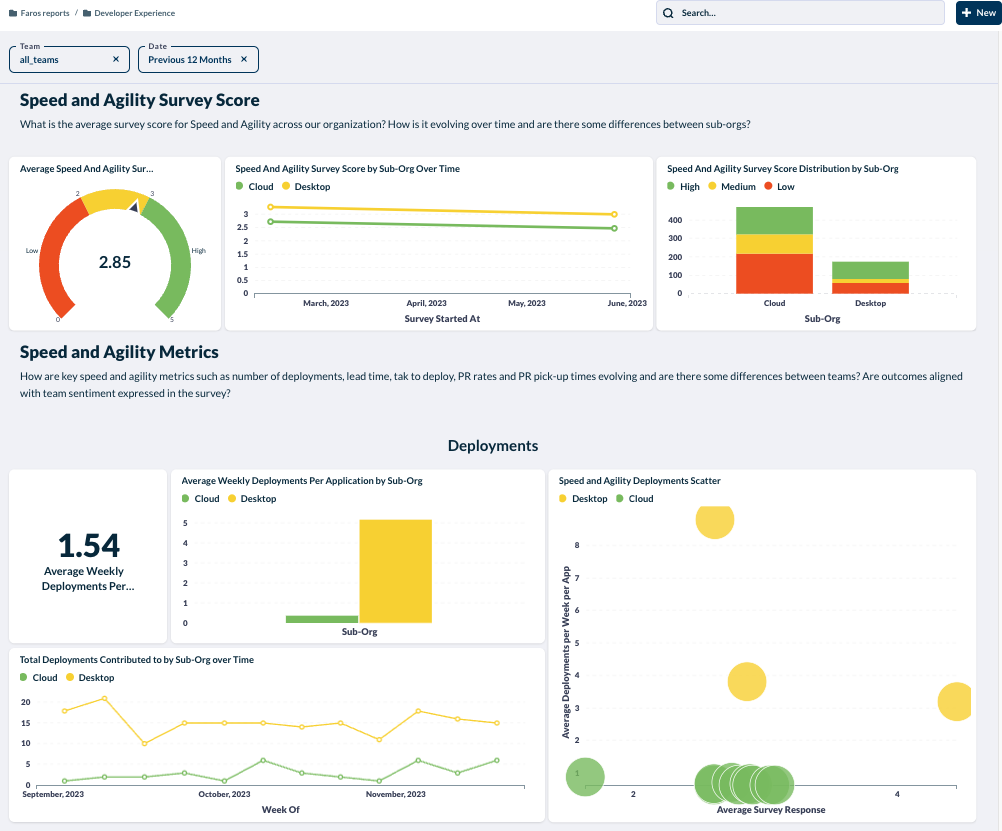
The dashboard is structured into two primary sections: speed and agility survey score, and metrics
All metrics can be filtered by team and a specific time period.
- The desired team can be set using the Teams filter, and defaults to all teams. It is also possible to click on any of the team traces to drill down to a specific team
- The desired time period is set by the Date filter at the top of the page, and defaults to the previous 12 months.
The Speed and Agility Survey Score section provides an average score for Speed and Agility questions. It all provides trends over time and a breakdown by team
Metric | Description |
Speed and Agility Survey Score | Average score for Speed and Agility survey questions in survey responses received from the selected teams and time window |
Speed and Agility Survey Score by Sub-Org Over Time | Average score for Speed and Agility survey questions in survey responses, by team and over time |
Speed and Agility Survey Score by Sub-Org | Breakdown of survey scores for Speed and Agility survey questions by team |
The Speed and Agility Metrics section shows relevant DORA metrics such as Deployments, Lead Time as well as Task to Deploy, Pull Request and PR pick-up and intersects them with survey data. Like anything else in Faros, you can of course customize the metrics shown to those that make most sense for your organization and at this point in time.
Metric | Description |
Average Weekly Deployments Per Application
| Average number of production deploymentsper week per application |
Average Weekly Deployments Per Application by Sub-Org | Average number of production deployments per week per application by sub-org |
Total Deployments Contributed to by Sub-Org over Time | Total count of week-by-week production deployments that include changes authored by members of sub-orgs |
Speed and Agility Deployments Scatter | Average deployments per week per app owned by each team, plotted against speed and agility score for that team. Each team is a bubble |
Mean Lead Time for Changes | Average time it takes for changes authored by team members to go from PR creation to deployment in production |
Mean Time to Resolve (Sev1/Sev2) Breakdown by Sub-Org | Average time that changes authored by members of sub-orgs spend in different stages of the SDLC, from PR creation to deployment in production. Includes steps from flows that have not yet completed so results may differ slightly from other completed-flow metrics. |
Mean Lead Time by Sub-Org over Time | Average time it takes for changes to go fromPR creation to deployment in production, broken down by sub-orgs |
Speed and Agility Lead Time Scatter | Average lead time for changes for each team, plotted against speed and agility score for that team. Each team is a bubble. |
Average Task-to-Deploy Time | The average amount of time from when a task is created until the resulting change is deployed |
Task-to-Deploy Breakdown by Sub-Org | The average amount of time from when a task is created until the resulting change is deployed by sub-org |
Task-to-Deploy Time by Sub-Org over Time | The average amount of time from when a task is created until the resulting change is deployed by sub-org over time |
Speed and Agility Task-to-Deploy Scatter | Average task to deploy for each team, plotted against speed and agility score for that team. Each team is a bubble. |
Average PR Review Time | The average amount of time from when a PRis created until it is merged |
PR Review Time Breakout by Sub-Org | The average amount of time from when a PR is created until it is merged by sub-org |
PR Review Time by Sub-Org over Time | The average amount of time from when a PR is created until it is merged by sub-org over time |
Speed and Agility PR Review Time Scatter | Average PR review time for each team, plotted against speed and agility score for that team. Each team is a bubble. |
Average PR Pickup Time | The average amount of time from when a PR is created until it is first reviewed |
PR Pickup Time by Sub-Org | The average amount of time from when a PR is created until it is first reviewed by sub-org |
PR Pickup Time by Sub-Org over Time | The average amount of time from when a PR is created until it is first reviewed by sub-org over time |
Speed and Agility PR Pickup Time Scatter | Average PR pick up time for each team, plotted against speed and agility score for that team. Each team is a bubble. |
Setting up the Developer Experience Module
The Developer Experience Module focuses on analyzing employee surveys and thus requires ingesting survey data into Faros.
Optionally, it provides a way to intersect survey data with a number of other metrics around velocity, quality and task management, thus requiring a number of other data sources to be connected to Faros for the full experience.
Note: For most of the sources below, you will find handy validation dashboards in the Getting Started folder under Faros Reports. These dashboards are provided to all Faros customers and let you inspect the data coming from different sources such as version control systems or task management systems.
Ingesting survey data
There are multiple ways to import survey data into Faros, which are described here.
Please note that mapping your question categories to Faros Categories (including Alignment and Goals, Developer Productivity, Quality and Speed, and Agility) is an optional step which is not necessary to leverage the Summary Dashboard but is required to leverage the other four dashboards. If your survey questions only cover a subset of these dimensions, feel free to only map those to leverage the corresponding dashboards and you can ignore the other ones.
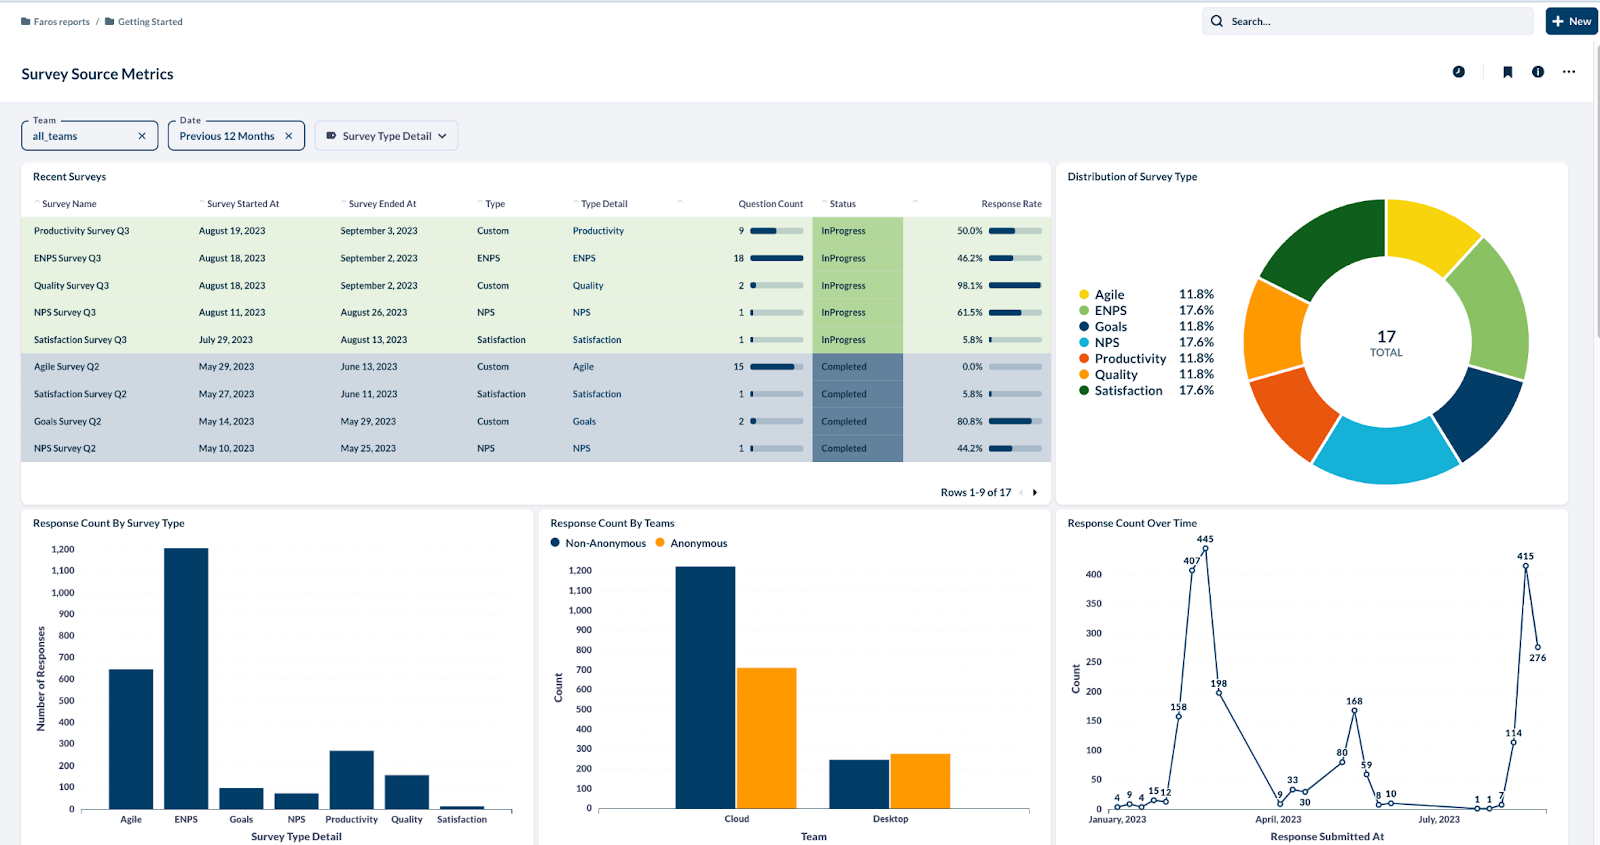
Once you have ingested employee surveys into Faros, you can leverage the Survey Source Metrics dashboard to get out of the box reports on survey data. This dashboard is located in the Getting Started folder under Faros Reports.
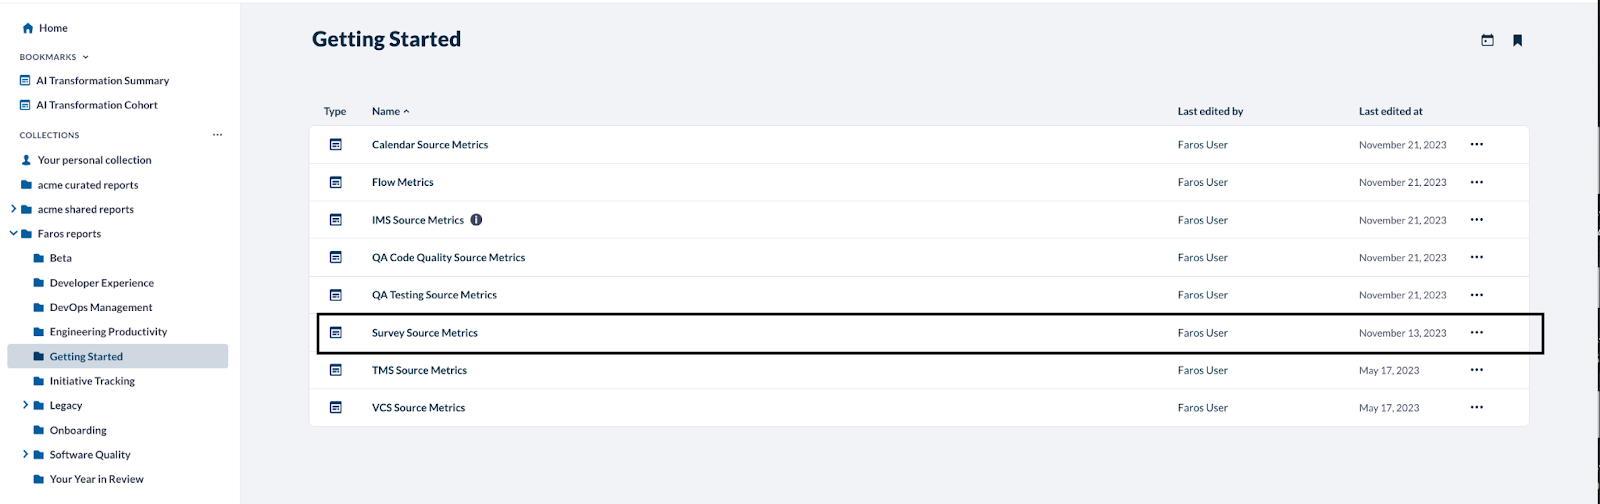
The Survey Source Metrics dashboard shows recent surveys, distribution of survey types, response count by type, teams and over time and stats around time to complete and responses.
Platform Prerequisites
The following should be set up on Faros in order to get the full functionality of the Developer Experience module:
- Organization and Team Members: This will allow Faros to know the teams in your organization, the reporting structure, and the size of each team.
Alignment and Goals
To get the full functionality of this dashboard, you need to map the “Alignment and Goals” Faros category to your corresponding category. See how to do that here.
In addition, the following sources should be connected:
Progress to Goal
Schema location: tms_Task
Sources: Task Management, TMS
Validation Dashboard: TMS Source Metrics
Releases should be defined in your Task Management System that have both a start date and a release date, and the tasks required to complete the release should be linked to it as well. The “Board Ownership” association will determine which team a release on a board belongs to. As work on the release progresses, you are able to see how far you are ahead of schedule or behind based on the number of tasks completed, not yet completed, and the amount of time remaining until the release.
Ratio of unplanned work and Backlog Size/Completed Vs WIP
Schema location: tms_Task
Sources: Task Management, TMS
Validation Dashboard: TMS Source Metrics
Tasks of type “Bug” should be reported to the Faros platform and are considered “unplanned work”. The “Board Ownership” association will determine what team the bugs belong to and the Org/Team setup will determine the number of developers on a team.
Developer Productivity
To get the full functionality of this dashboard, you need to map the “Developer Productivity” Faros category to your corresponding category. See how to do that here.
Task throughput & Task Cycle Time
Schema location: tms_Task
Sources: Task Management, TMS
Validation Dashboard: TMS Source Metrics
PR throughput & Merge Rate
Schema location: vcs_PullRequest
Sources: VCS
Validation Dashboard: VCS Source Metrics
The average number of pull requests merged per month per person on a team is calculated using the “merged at” timestamp of a pull request and the number of team members on the pull request author’s team.
Quality
To get the full functionality of this dashboard, you need to map the “Quality” Faros category to your corresponding category. See how to do that here.
Change Failure Rate
Schema location: ims_Incident, cicd_Deployment
Sources: Incident Management, IMS, Events
Validation Dashboard: IMS Source Metrics, Deployment Table
Change Failure Rate is calculated as the number of incidents per deployment. Incident counts are derived from incidents reported to the Faros platform. The “Application Ownership” association will determine what team the incidents belong to. Deployments should also be reported to Faros. This metric is only computed on high-severity incidents (Sev1 or Sev2) and for deployments to the Production environment.
Mean Time to Resolve
Schema location: ims_Incident
Sources: Incident Management, IMS
Validation Dashboard: IMS Source Metrics
Mean Time to Recovery is calculated leveraging the faros-time-to-resolve flow which can be found under Settings > Flows. Incident counts, stages and times to resolve are derived from incidents reported to the Faros platform. The “Application Ownership” association will determine what team the incidents belong to.
Bugs Per Developer
Schema location: tms_Task
Sources: Task Management, TMS
Validation Dashboard: TMS Source Metrics
Tasks of type “Bug” should be reported to the Faros platform. The “Board Ownership” association will determine what team the bugs belong to and the Org/Team setup will determine the number of developers on a team.
Incidents
Schema location: ims_Incident
Sources: Incident Management, IMS
Validation Dashboard: IMS Source Metrics
Incident counts are derived from incidents reported to the Faros platform. The “Application Ownership” association will determine what team the incidents belong to.
Speed and Agility
To get the full functionality of this dashboard, you need to map the “Speed and Agility” Faros category to your corresponding category. See how to do that here.
Deployments
Schema location: cicd_Deployment
Sources: Events
Validation Dashboard: Deployment Table
Deployment frequency measures how often an organization successfully deploys new code to production and requires deployments to be reported to Faros.
Lead Time
Schema location: vcs_PullRequest, cicd_Build, cicd_Deployment
Sources: VCS, Events
Validation Dashboards: VCS Source Metrics, Deployment table, Flow Duration Lead Time table
Lead Time for Changes is calculated leveraging the faros-lead-time flow which can be found under Settings > Flows. It requires VCS data to compute times from PR created to PR merged to Build and Deployment events for the rest.
Task to Deploy
Schema location: tms_Task, vcs_PullRequest, cicd_Build, cicd_Deployment
Sources: Task Management, TMS, VCS, Events
Validation Dashboard: TMS Source Metrics, VCS Source Metrics, Deployment table, Flow Duration Lead Time table
PR & PR pick-up
Schema location: vcs_PullRequest
Sources: VCS
Validation Dashboard: VCS Source Metrics
The average number of pull requests merged per month per person on a team is calculated using the “merged at” timestamp of a pull request and the number of team members on the pull request author’s team.
Updated 5 months ago