
Software Security Module
Summary
One pain point we’ve repeatedly heard from senior engineering managers and security, and infra domain leads is the lack of visibility into the codebase’s security risks. This information tends to be scattered across multiple tools, preventing a unified view of the work to be done, which often leads to lingering vulnerabilities and missed SLAs.
The Software Security module helps you see the full picture and identify which repositories and teams need urgent attention. It helps ensure teams are meeting their SLAs, addressing security vulnerabilities, and reducing your company’s risk exposure.
Key benefits:
-
Resolve vulnerabilities within SLAs with real-time tracking and alerts for pending or overdue patches
-
Identify the most vulnerable parts of the codebase with a single unified view of security findings, and measure the ROI of security activities over time
-
Monitor team-level security performance with vulnerability resolution performance and identify which teams require more support or education on security best practices
How to Access
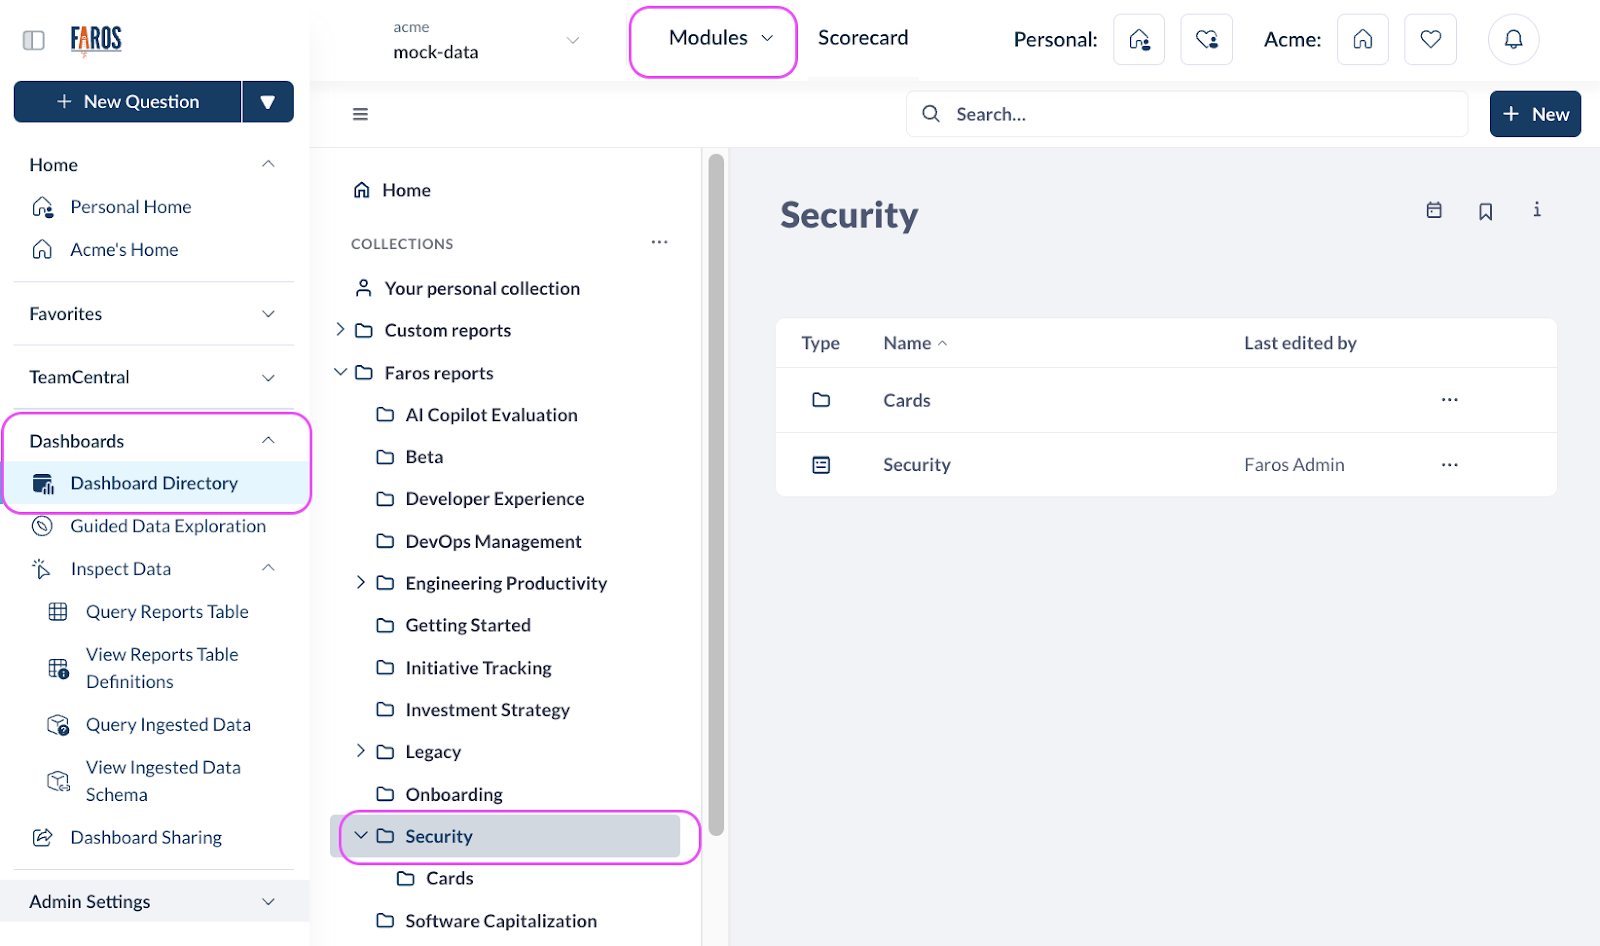
To access this module, go to Dashboards > Dashboards Directory > Faros Reports > Security.
You can also access it from the Modules drop-down at the top of the screen.
Included Dashboards
The Security Module is composed of 3 tabs, providing an overview of your vulnerability management program, as well as more details on the detection and remediation of vulnerabilities.
| Dashboard | Description |
| Overview | A high level overview of your vulnerability management program,including vulnerabilities created and resolved over time, and vulnerabilities resolved within or over SLA |
| Detection | Helps you track open vulnerabilities and highlights those requiring immediate attention, with breakdowns by severity, repository, artifacts and teams |
| Remediation | Helps you analyze your performance in remediating vulnerabilities and check compliance with SLAs |
See below for additional details on each one.
Overview
The Overview tab provides a unified view into your vulnerability management program and how your organization has been trending in detecting and addressing vulnerabilities.
All metrics can be filtered down by team, repository, severity and a specific time period.
By default, the dashboard filters to All Teams, All Repos, All Severity Levels and Previous 3 Months.

It is composed of the following metrics:
| Metric | Description |
| Created and Resolved Vulnerabilities Over Time | Number of vulnerabilities created and resolved over time for your organization, each week |
| Vulnerabilities Created | Number of new vulnerabilities created for your organization over the time period selected |
| Vulnerabilities Open | Number of vulnerabilities that are currently open |
| Vulnerabilities Addressed | Number of vulnerabilities addressed (resolved, ignored or abandoned) over the time period selected |
| Vulnerabilities Over SLA | Number of vulnerabilities currently open that are over the SLA |
| Vulnerabilities Resolved Within SLA | Percentage of vulnerabilities that were resolved within the SLA |
Detection
The Detection tab focuses on open vulnerabilities and highlights those requiring immediate attention. It also gives you useful breakdowns by severity level, repository and team.
All metrics can be filtered down by team, repository, severity and a specific time period.
By default, the dashboard filters to All Teams, All Repos, All Severity Levels and Previous 3 Months.
Vulnerability Detection Overview
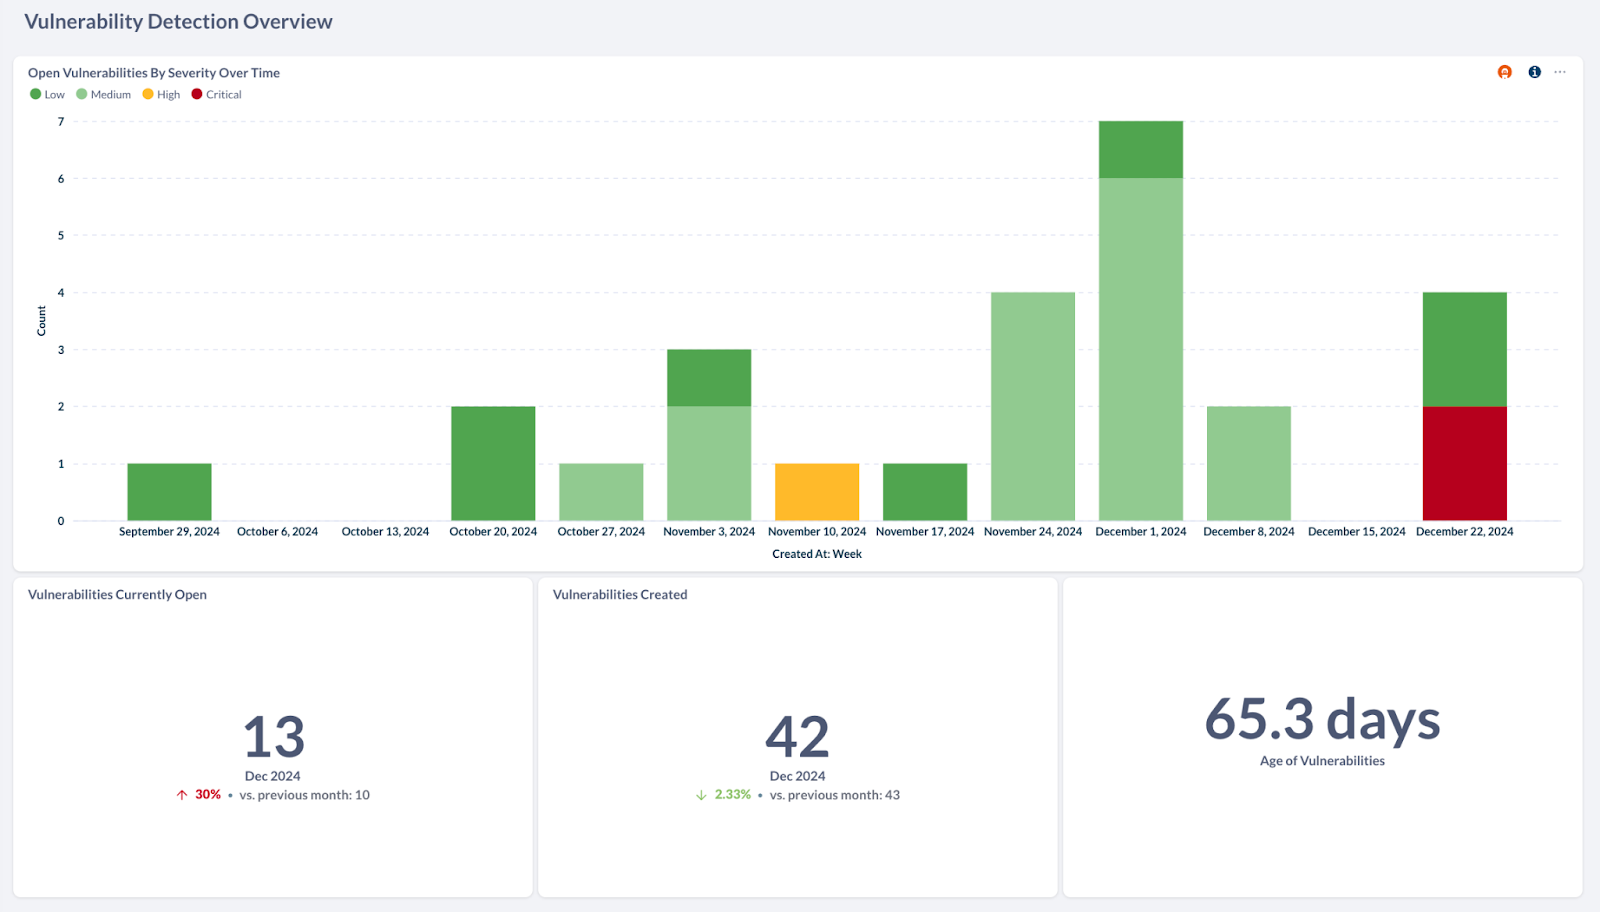
The Vulnerability Detection Overview section helps you monitor how many vulnerabilities of different severity levels have been detected each week in the past few months, as well as how long vulnerabilities are opened on average before they are addressed.
It is composed of the following metrics:
| Metric | Description |
| Open Vulnerabilities by Severity Over Time | Number of Open Vulnerabilities each week, grouped by severity level. Both new and existing vulnerabilities are displayed. New vulnerabilities appear on their creation date, while pre-existing vulnerabilities are shown at the start of the selected period. Remediated or dismissed vulnerabilities are excluded and shown in the Remediation section |
| Vulnerabilities Currently Open | Number of vulnerabilities that are currently open based on the last month of the time period selected, and percentage change since last month |
| Vulnerabilities Created | Number of new vulnerabilities created in the last month of the selected time period, and percentage change since last month |
| Age of Vulnerabilities | Average age of all vulnerabilities that are still open at the end of the chosen time period. The age of each open vulnerability is calculated by subtracting the date that the chosen vulnerability was created from the date that the chosen time period ends. For reopened vulnerabilities, the age is calculated by subtracting the original created date rather than the date the vulnerability was reopene |
Open Vulnerabilities Analysis
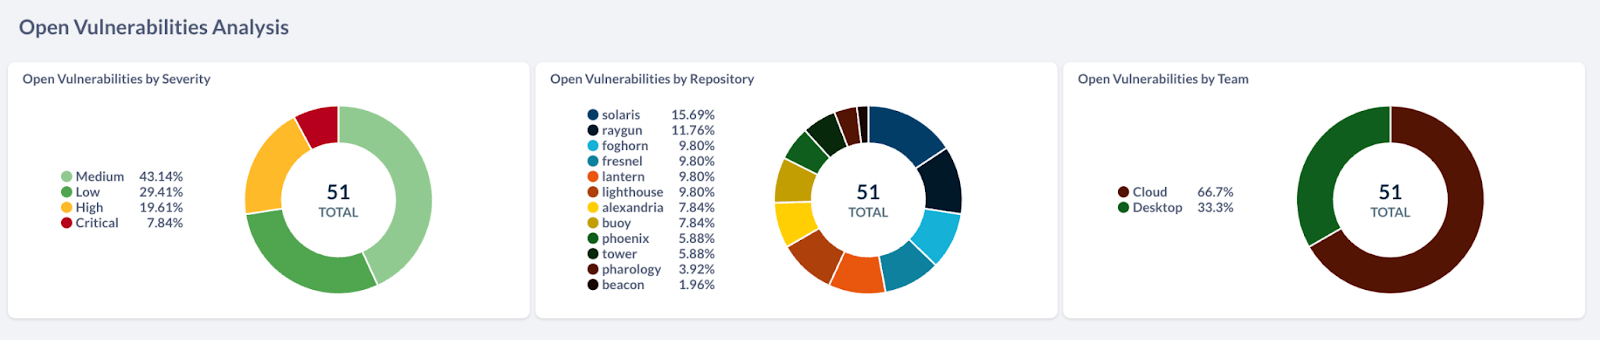
The Open Vulnerabilities Analysis section gives you a detailed breakdown of open vulnerabilities by severity level, repository and team. You can also filter by any of these dimensions from the filters at the top of the dashboard.
Open Vulnerabilities Requiring Immediate Attention
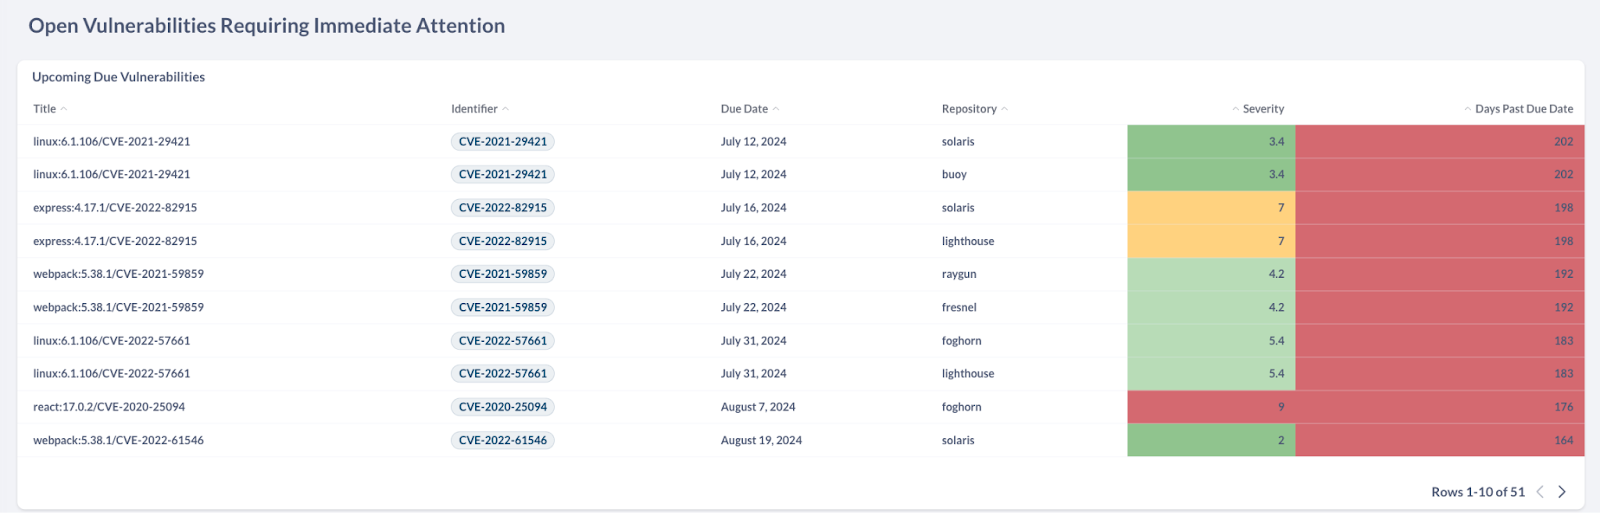
The Open Vulnerabilities Requiring Immediate Attention section helps you track your open vulnerabilities and ensure compliance with SLAs. Open Vulnerabilities are sorted by Due Date, with those past their due date at the very top. Overdue vulnerabilities are highlighted in red, and those due within a week in orange. Severity levels are also highlighted with different colors to highlight the most critical vulnerabilities to tackle first.
Remediation
The Remediation tab helps you analyze your performance in remediating vulnerabilities and check compliance with SLAs. It also gives you useful breakdowns by severity level, repository and team.
All metrics can be filtered down by team, repository, severity and a specific time period.
By default, the dashboard filters to All Teams, All Repos, All Severity Levels and Previous 3 Months.
Vulnerability Remediation Overview
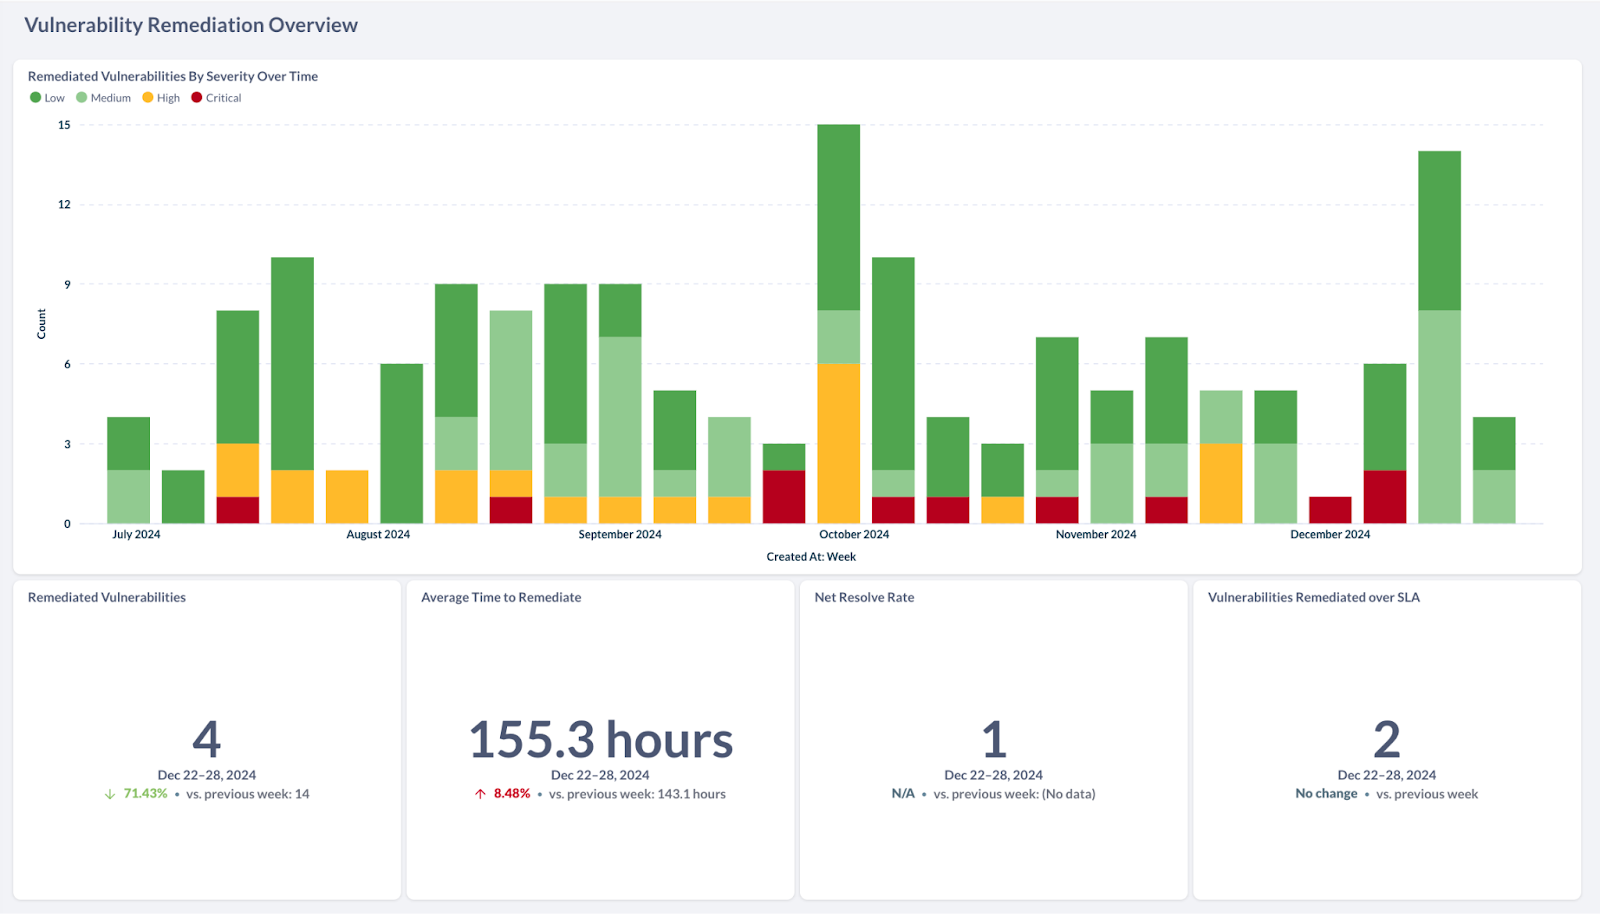
The Vulnerability Remediation Overview section shows how many vulnerabilities of different severity levels have been remediated each week in the past few months, as well as a few key metrics on your remediation performance.
It is composed of the following metrics:
| Metric | Description |
| Remediated Vulnerabilities by Severity Over Time | Number of Remediated Vulnerabilities each week, grouped by severity level. |
| Remediated Vulnerabilities | Number of vulnerabilities that were remediated during the last week of the selected period, and percentage change since the previous week |
| Average Time to Remediate | Average time to resolve vulnerabilities in the last week of the selected period, and percentage change since the previous week |
| Net Resolve Rate | Percentage of remediated vulnerabilities to newly created vulnerabilities in the last week of the time period selected, and percentage change since the previous week |
| Vulnerabilities Remediated over SLA | Vulnerabilities Remediated over SLA in the last week of the time period selected, and percentage change since the previous week |
Remediated Vulnerabilities Analysis
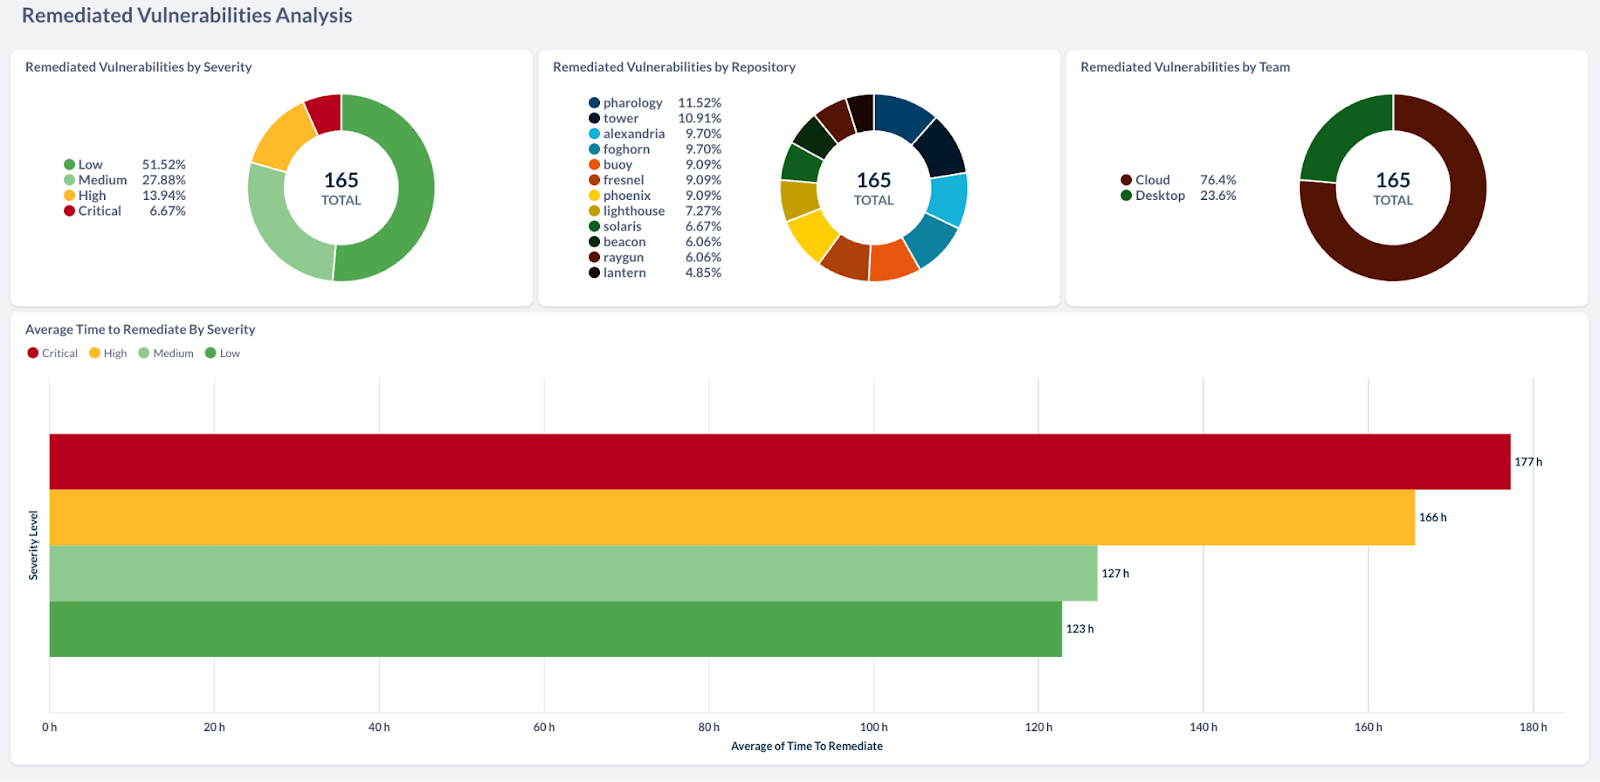
The Remediated Vulnerabilities Analysis section gives you a detailed breakdown of remediated vulnerabilities by severity level, repository and team. You can also monitor the average time to remediate by severity level.
Vulnerability Remediation Performance
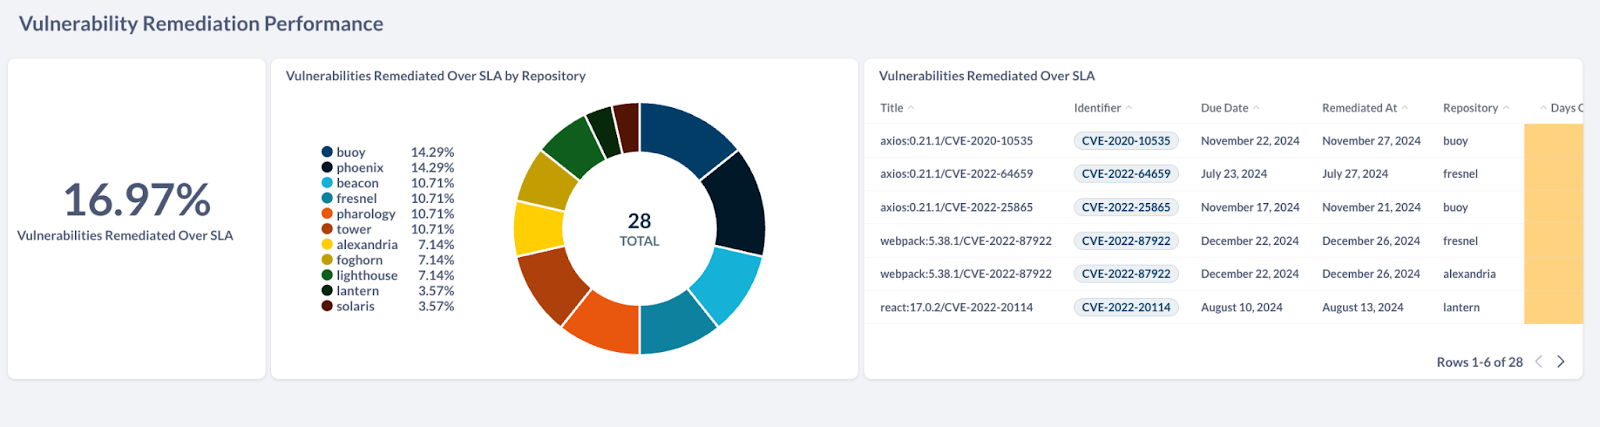
The Vulnerability Remediation Performance section helps you track compliance with SLAs and understand which repositories may be most at risk and which teams may require more support or education on security best practices.
It shows the percentage of vulnerabilities remediated over SLA in the time period selected, gives you a breakdown by repository, and the full list, highlighting their severity level and how late they were remediated compared to their due dates.
Ignored Vulnerabilities
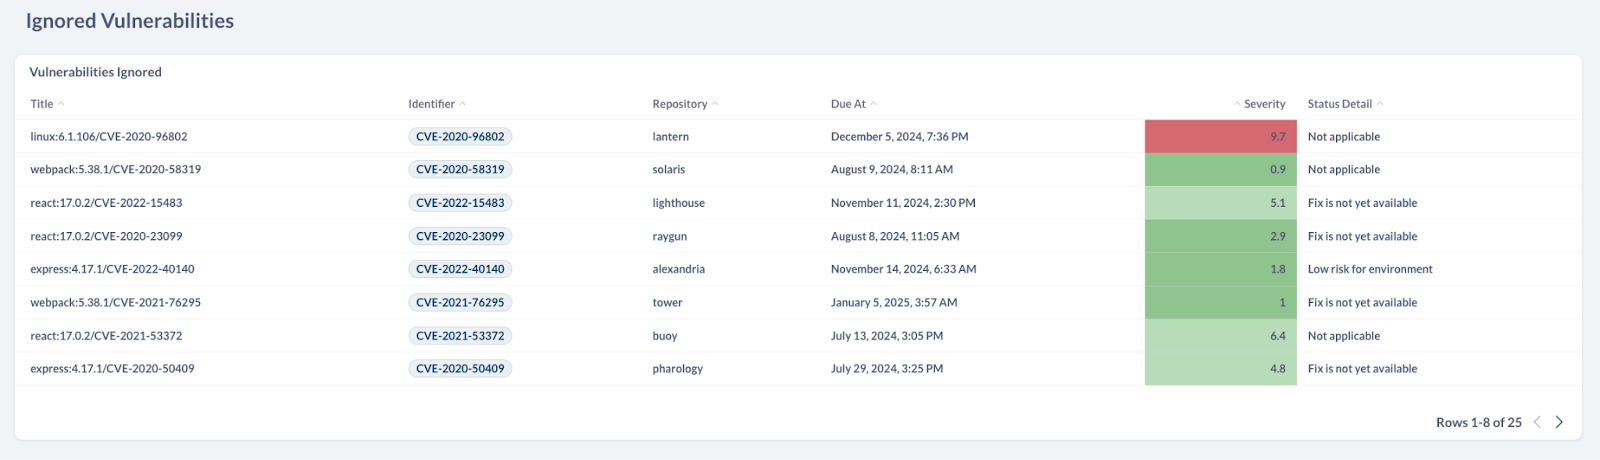
The Ignored Vulnerabilities section helps you keep an eye on vulnerabilities that were ignored and not remediated, highlighting their severity level.
Setting up the Security Module
The Security Module is focused on giving you a comprehensive view of your vulnerability management program, identifying the most vulnerable parts of your codebase and monitoring team-level security performance to improve it. To do so, several data sources should be connected to the Faros platform, as detailed in the following sections.
Platform Prerequisites
The following should be set up on Faros in order to get the full functionality of the Security module:
-
Version control, VCS: The data will be used to link vulnerabilities to repos.
-
Organization and Team Members: This will allow Faros to know the teams in your organization, the reporting structure, and the size of each team.
-
Team Attribution: To help determine which teams own which repos
Vulnerabilities
Schema location: sec_Vulnerability
Sources: GitHub Advanced Security, Vanta, Tromzo and others
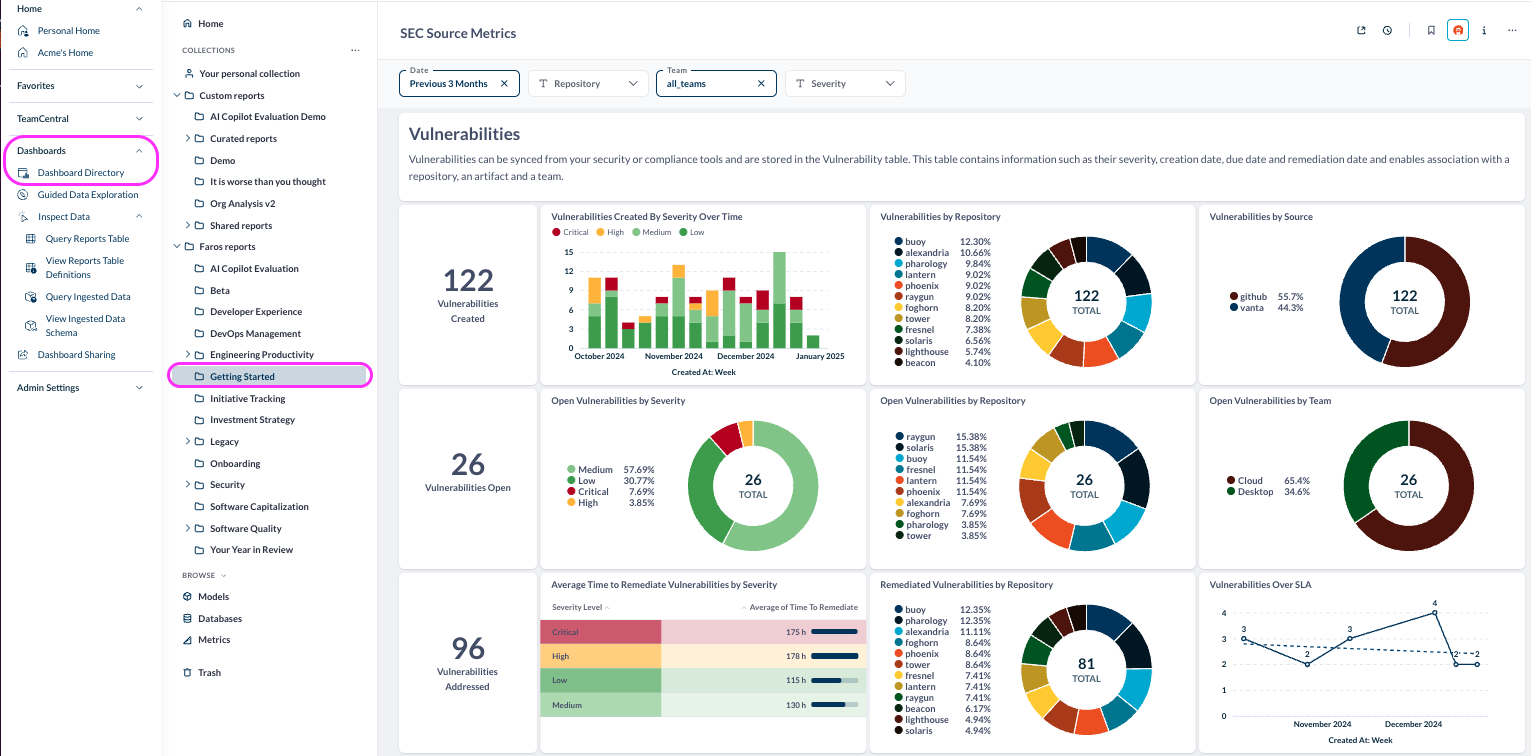
Validation Dashboard: SEC Source Metrics
Vulnerabilities can be imported from a variety of security tools. The SEC Source Metrics dashboard available under Dashboards > Dashboards Directory > Faros Reports > Getting Started will help you validate your security data has been ingested correctly, and provides entry level metrics.
Updated 3 months ago