
Chart Explainer and Chart Summary
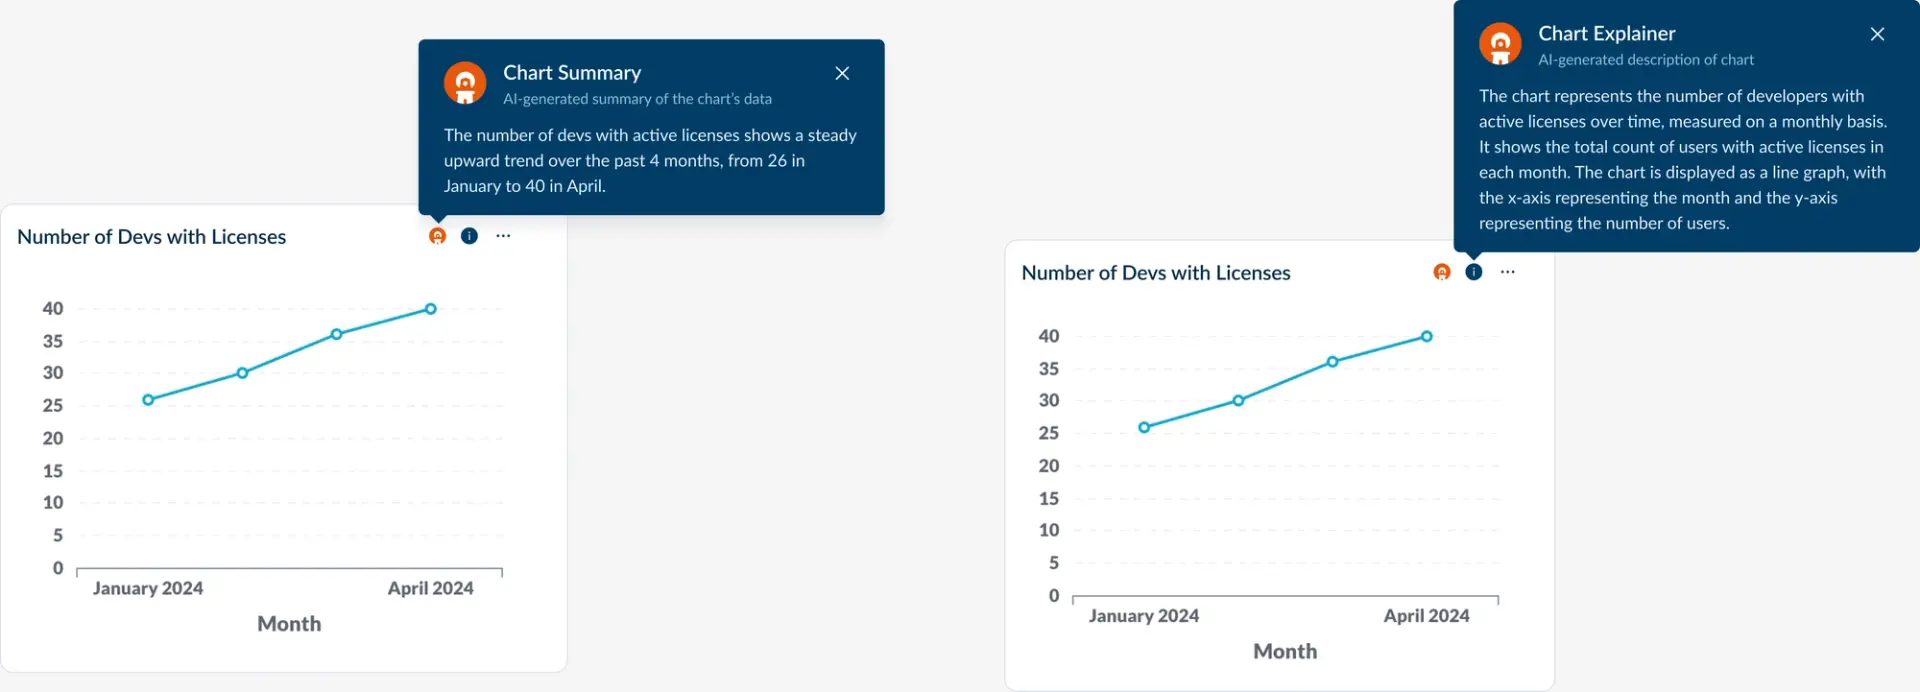
For individual charts, Chart Summary delivers the bottom line from the chart and Chart Explainer describes the purpose of the chart and how it works.
The purpose of Chart Explainer and Chart Summary is to provide easy-to-understand information about each chart to aid in understanding both the purpose of the chart and what the data in the chart implies.
What is Chart Summary?
Chart Summary looks at the data within each chart and generates a short summary that highlights the most important insights from the chart.
What is Chart Explainer?
If a chart doesn't already have a pre-defined description, Chart Explainer will generate a description of each chart based on the features of the chart so people can understand. If you have already manually created a description of the chart, we do not generate a description and will display yours to your users.
What is the difference between the two?
In a nutshell, Chart Summary uses the data in the chart, while Chart Explainer uses the metadata. The Chart Explainer will give a similar description regardless of the filters applied on the chart. The Chart Summary gives you a TLDR of the data inside the chart.
Accessing Chart Summary and Chart Explainer
Both features are available on each chart in your Faros instance, whether pre-built or custom. Highlight the Lighthouse icon to open Chart Summary, and highlight the info bubble to access Chart Explainer.
Updated about 2 months ago