
Lighthouse Insights (Beta)
Understand how differences across your organization relate to critical engineering metrics.
The Lighthouse Insights Dashboards provide a deep dive into the relationship between engineering processes and issues and DORA metrics across your organization's structure. It identifies which development patterns have the strongest correlation with key metrics like PR cycle time, task lead time, deployment frequency, change failure rate, and mean time to resolve incidents.
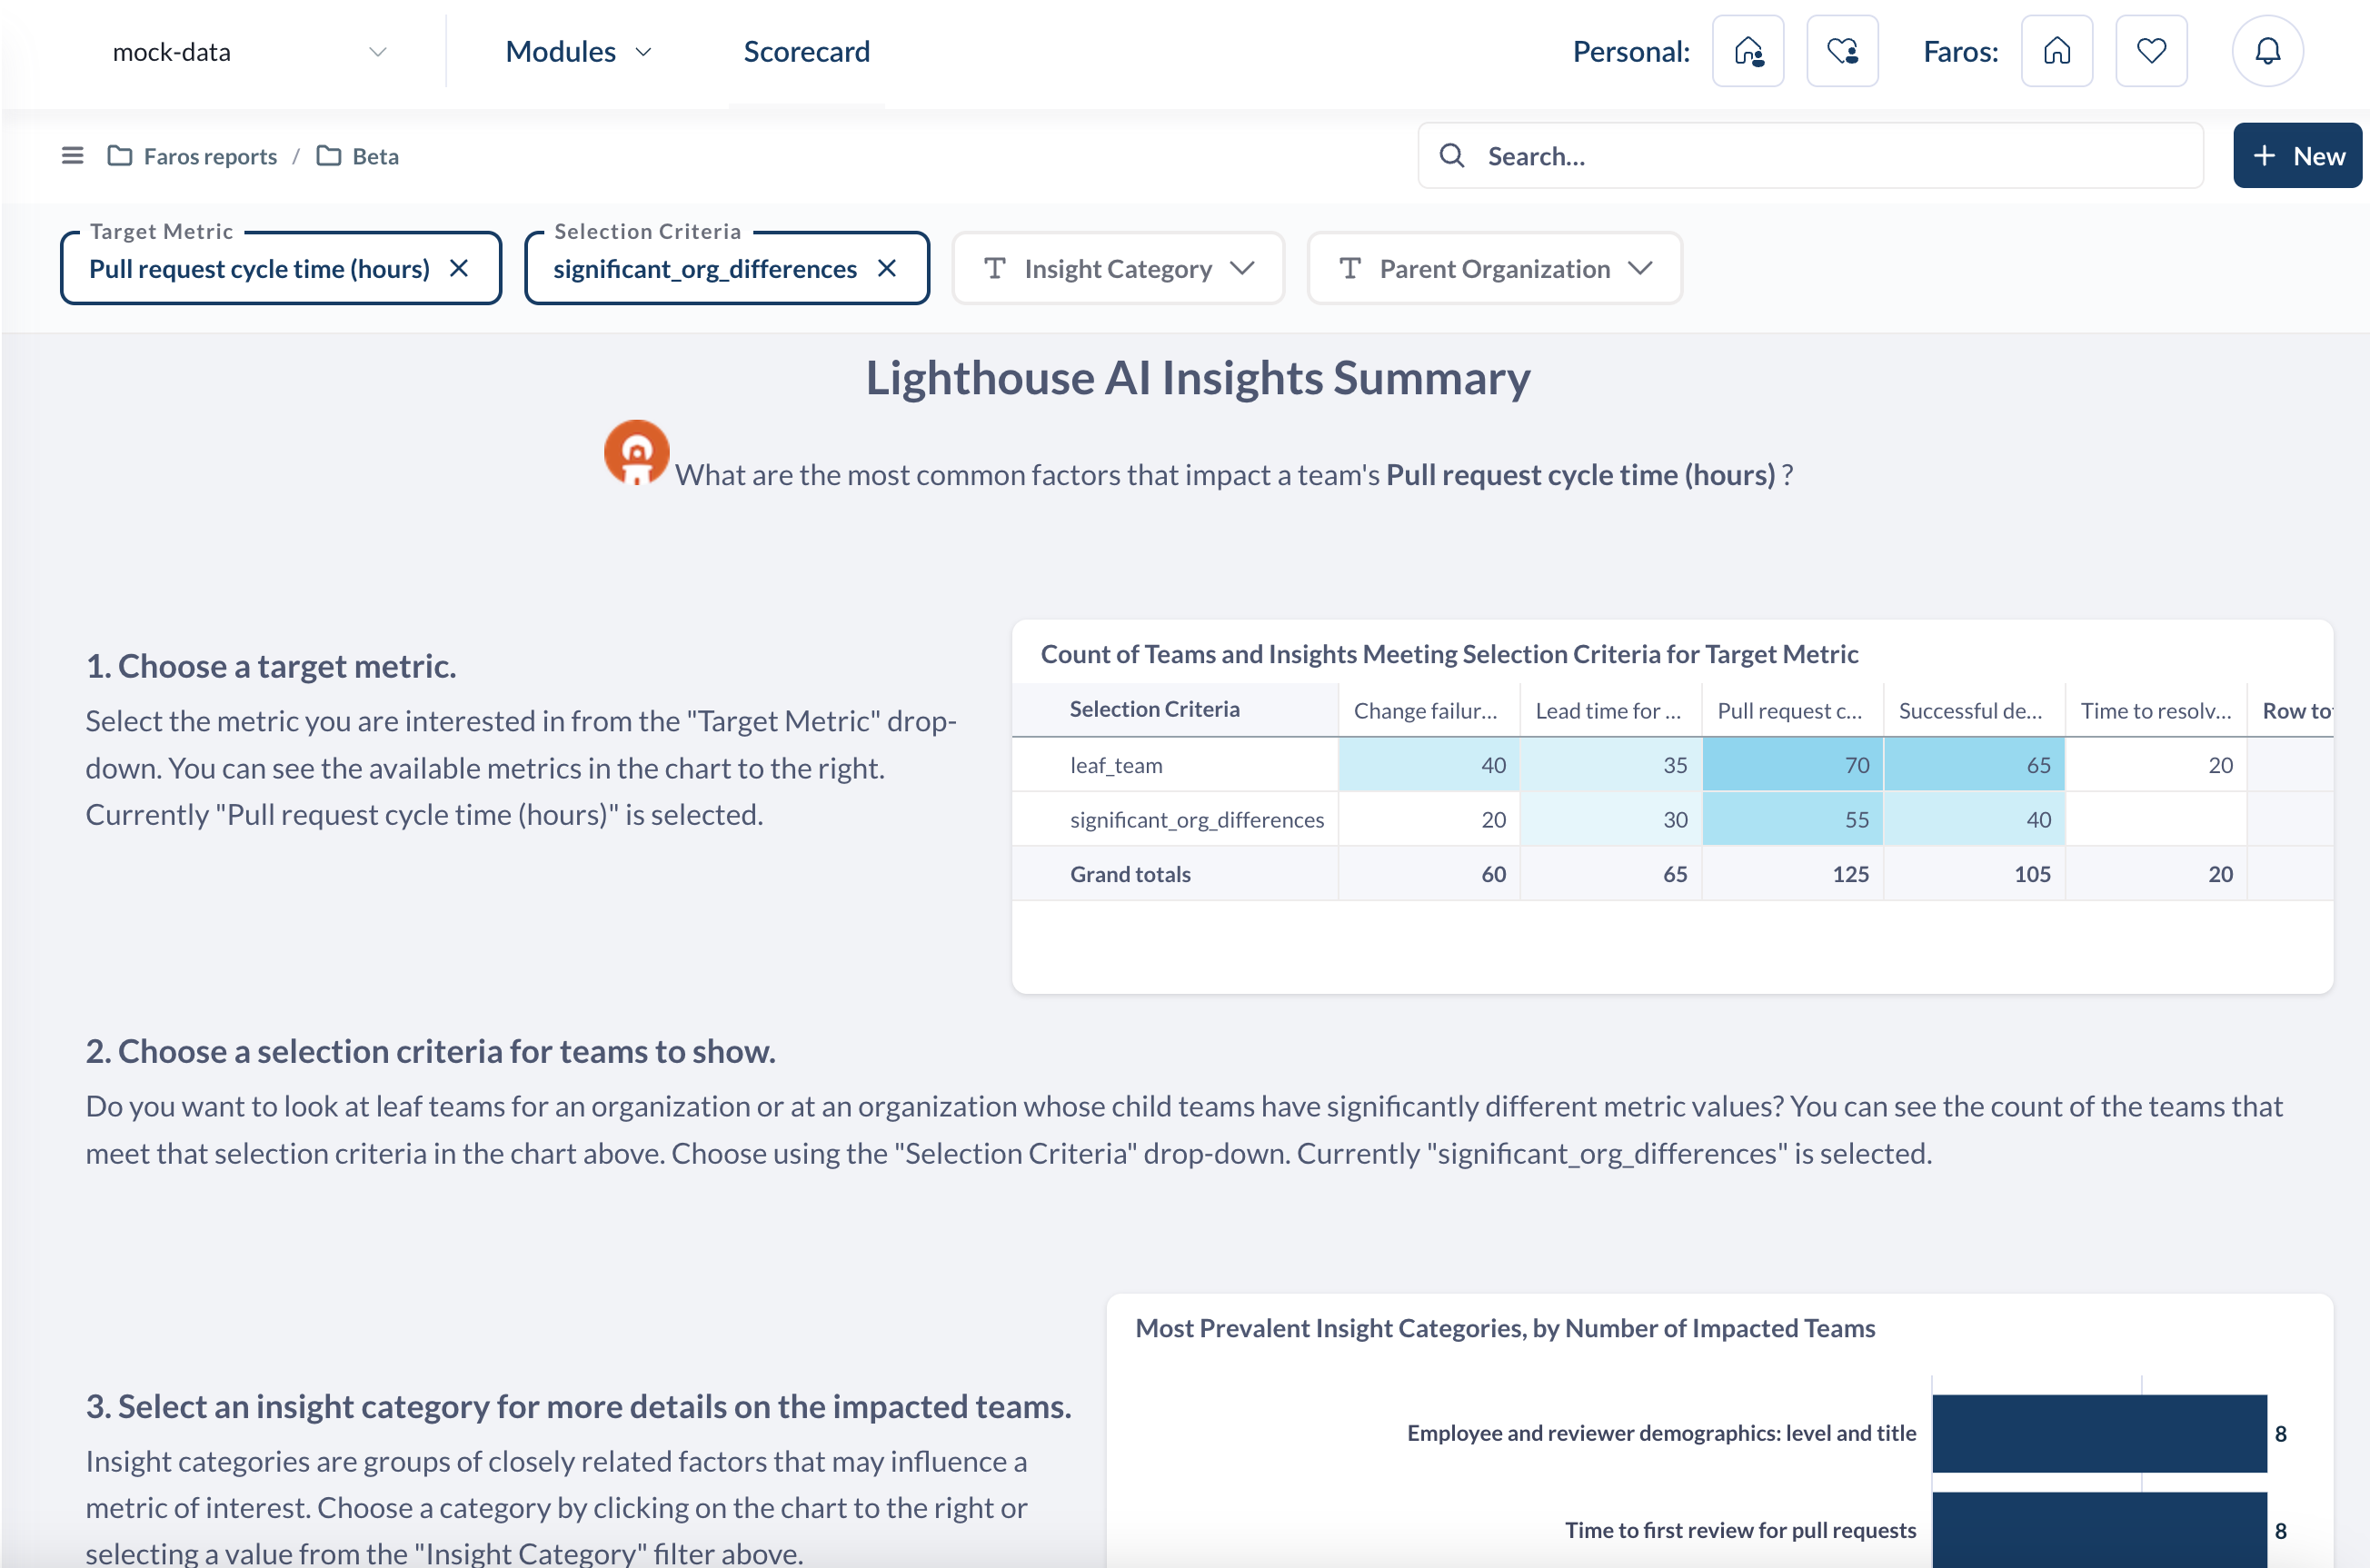
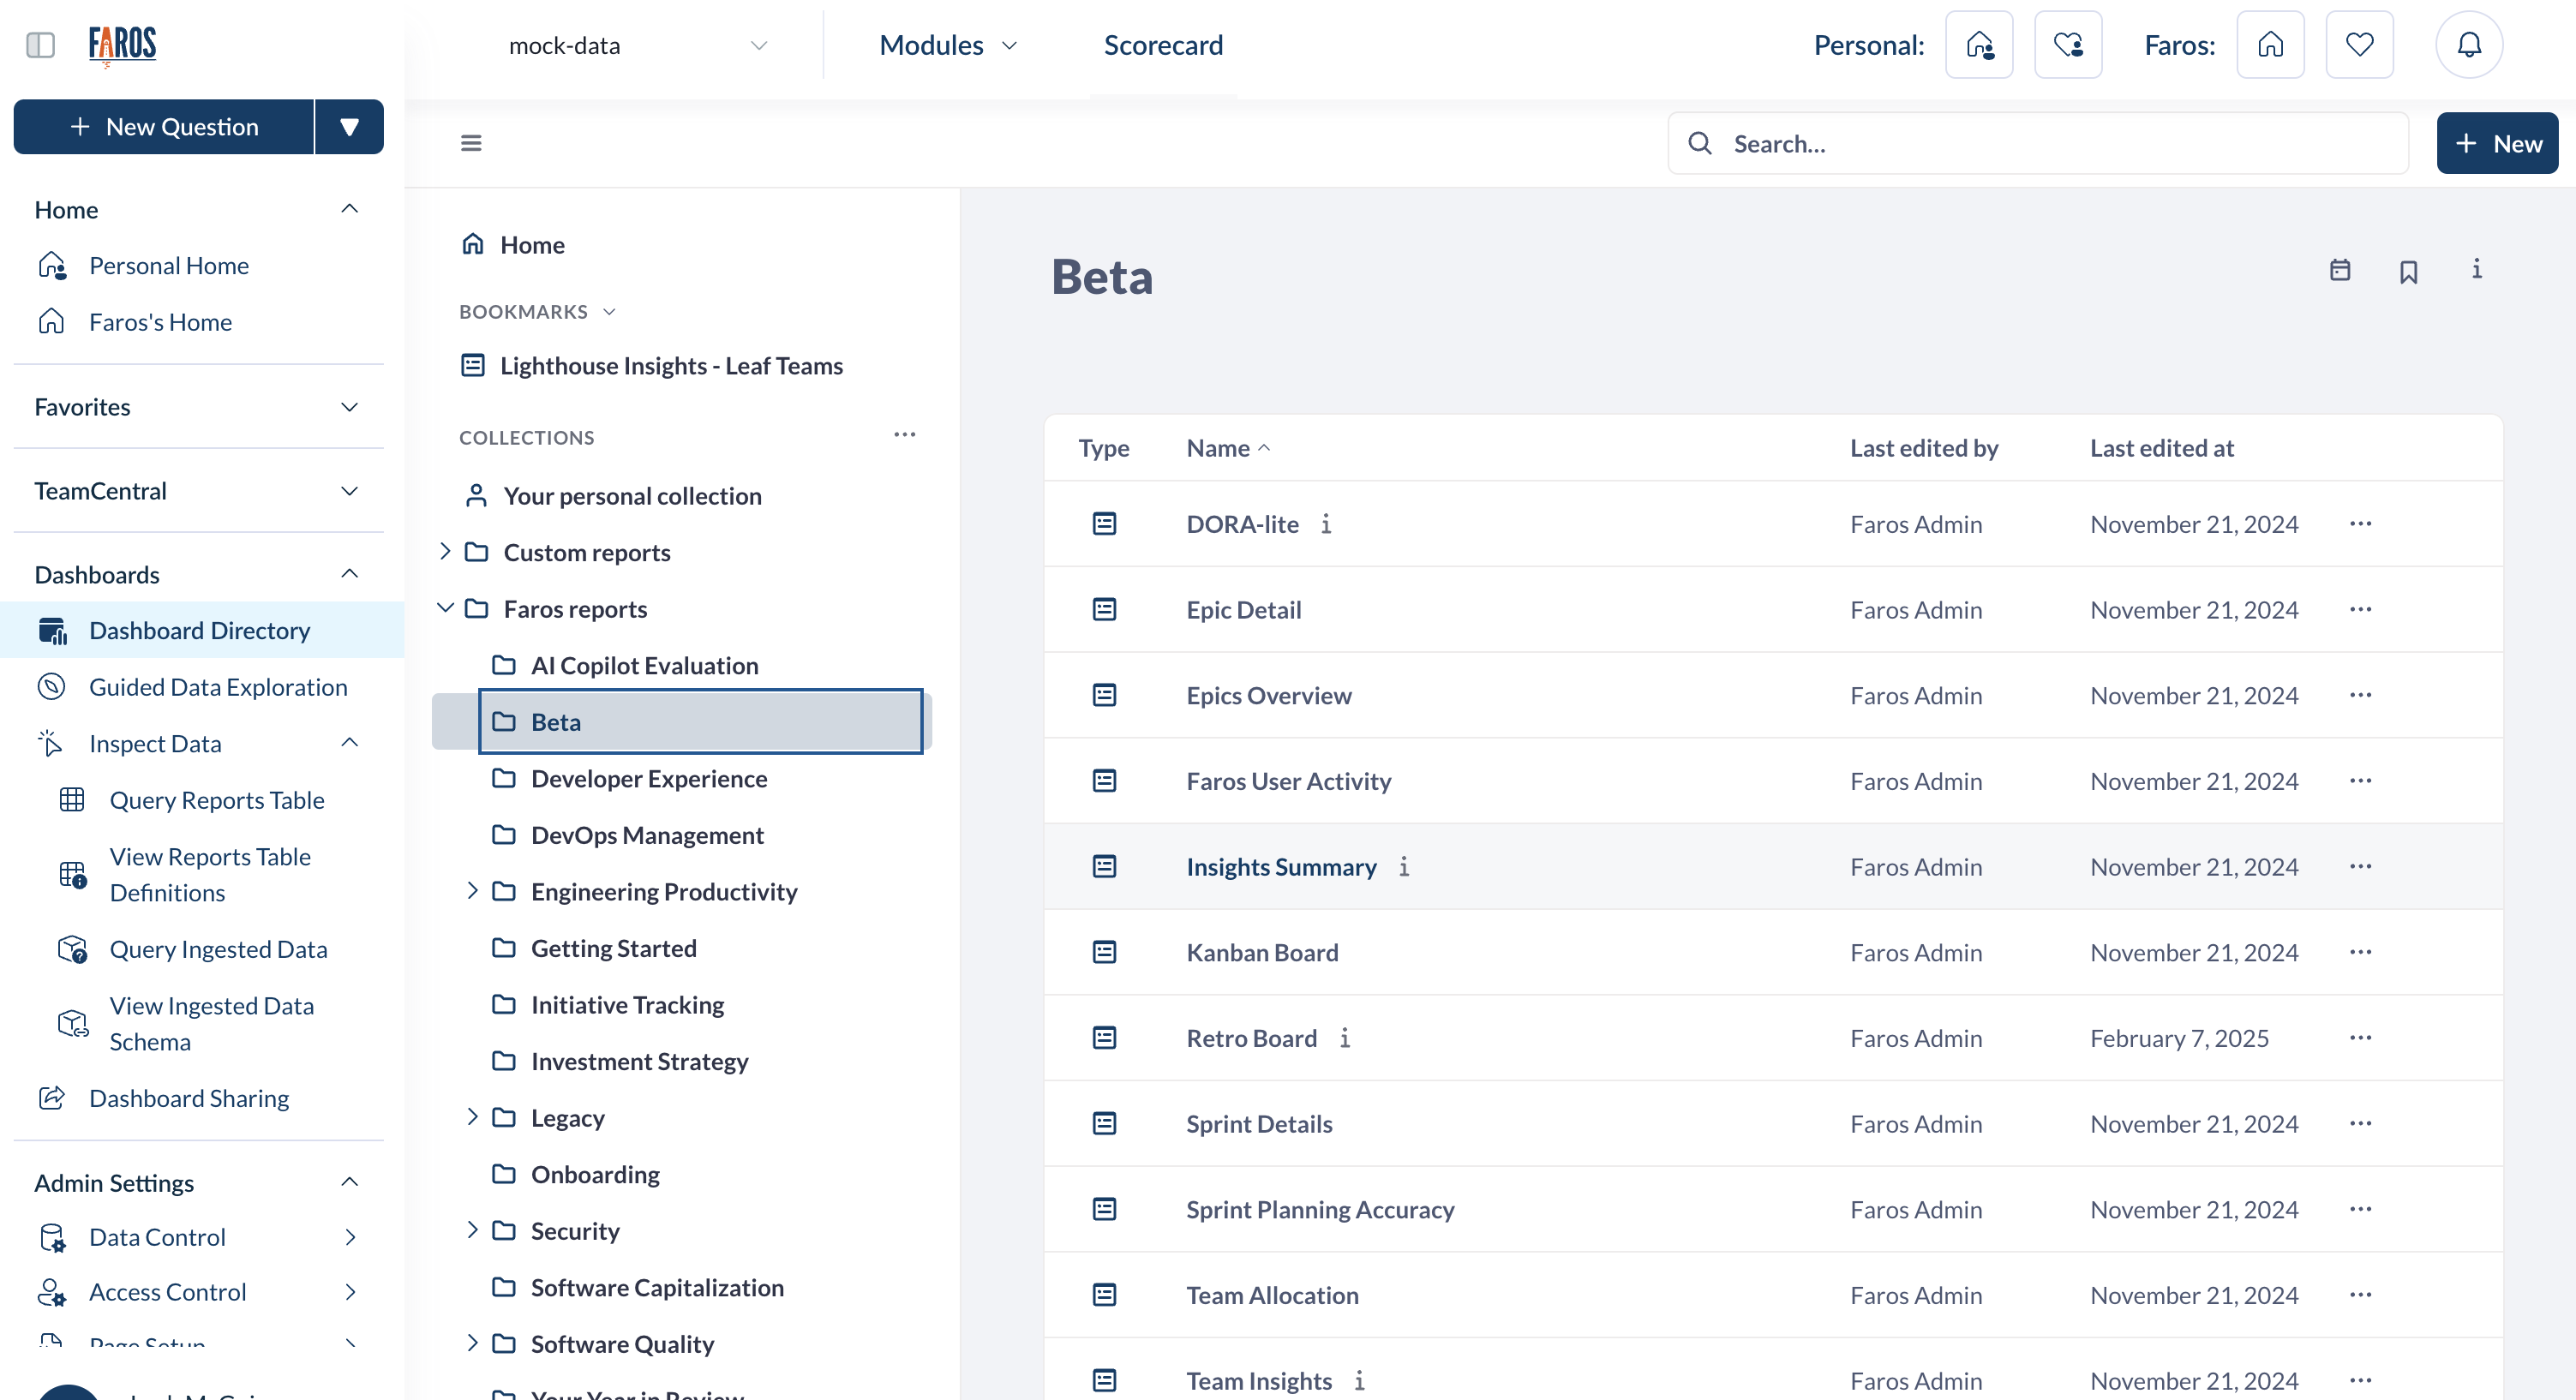
The dashboards to examine these insights can be found under Dashboard Directory -> Faros reports -> Beta _ Insights Summary and Team Insights.
How It Works
Faros calculates all the potential factors that may be contributing to each of the DORA metrics (and PR cycle time). Similar factors are grouped into interpretable clusters to provide focused insights and reduce redundancy. The grouped factors are then screened based on a combination of correlation and significance testing to select only the factors most likely to explain differences between teams in your organization.
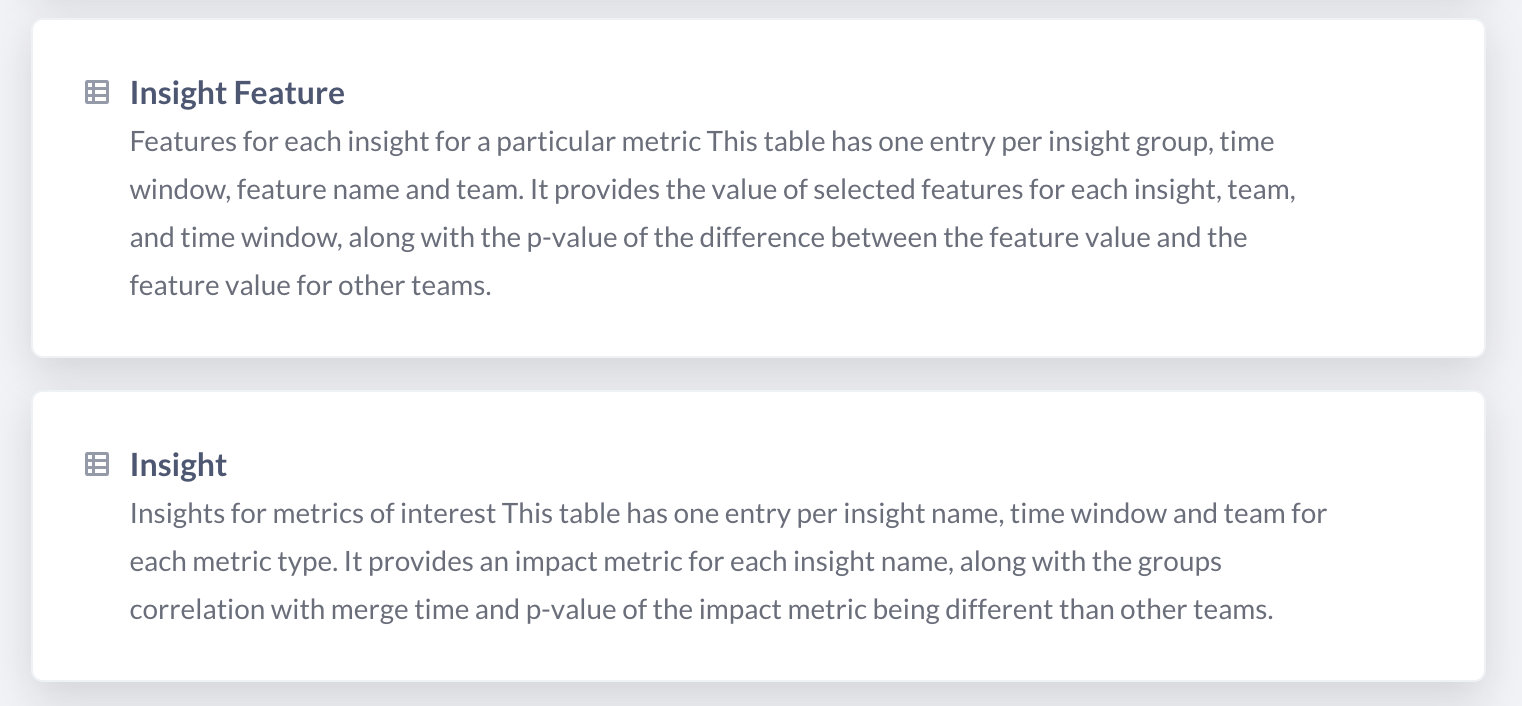
The raw data from these analysis are stored in the Insight and Insight Features tables and visualized for exploration in the Insights Summary and Team Insights dashboards.
Updated about 1 month ago