
Understanding User Roles
Faros has five roles available to all your users: Owner, Administrator, Analyst, Executive Viewer, and Viewer.
You need the enterprise bundle in order to customize your roles.
Summary of user roles
| Role | Permissions |
|---|---|
| Viewer | The “viewer” role is meant for users who are absorbing the content and charts others have configured for them. They can view company favorited charts and dashboards as well as their own team page by default. |
| Executive Viewer | Executive Viewers have read-only access to all modules, reports, team pages and scorecards across the organization. |
| Analyst | Analysts can explore data and create / view reports and dashboards. They have full access to data across the organization. |
| Administrator | Administrators have full analyst permissions. In addition, they can set and manage the data being exposed via Faros. |
| Owner | Owners are administrators who can manage Faros users and their roles and set up SSO. In the future, they will be able to view and modify billing and subscription information for accounts. |
User role permission details
These are the default permissions. However, admins and owners can customize their permissions using the Roles page (available for Enterprise bundle customers).
Permission | Viewer | Executive Viewer | Analyst | Admin | Owner |
|---|---|---|---|---|---|
Create personal home page and favorites | ✓ | ✓ | ✓ | ✓ | |
View company home page and favorites | ✓ | ✓ | ✓ | ✓ | ✓ |
Create company home page and favorites | ✓ | ✓ | |||
Easy access to module pages | ✓ | ✓ | ✓ | ✓ | |
View scorecard | ✓ | ✓ | ✓ | ✓ | |
Customize scorecard | ✓ | ✓ | |||
View personal TeamCentral page | ✓ | ✓ | ✓ | ✓ | ✓ |
View all teams TeamCentral pages | ✓ | ✓ | ✓ | ✓ | |
Customize all team TeamCentral pages | ✓ | ✓ | |||
Easy access to dashboard directory | ✓ | ✓ | ✓ | ✓ | |
Create new charts and dashboards | ✓ | ✓ | ✓ | ||
View Faros Reports | ✓ | ✓ | ✓ | ✓ | ✓ |
Edit Curated Reports | ✓ | ✓ | |||
Inspect ingested & reports data | ✓ | ✓ | ✓ | ||
External dashboard sharing | ✓ | ✓ | ✓ | ||
Manage data control | ✓ | ✓ | |||
Manage organization setup | ✓ | ✓ | |||
Manage access control | ✓ | ✓ | |||
Manage Faros users | ✓ | ||||
SSO setup | ✓ |
Assigning roles to users
Owners are the only people who can change the roles of other users within Faros. To update someone’s role:
- Go to
Access Control→Users - When creating a new user, you will have the option to assign them to any of the roles.
- For existing users, select edit option in the “⋮” menu on the user’s row. There will be a popup where you can edit the role.
- For customers creating users through an SSO integration, the last page of the SSO setup allows you to configure default user roles or map groups to specific roles. If you are creating users this way make sure to always include the base 'user' role in addition to more specific ones.
Customizing permissions for roles
Each faros role has a default set of permissions that you can see above. If you have the Enterprise bundle you are able to customize which permissions each role has.
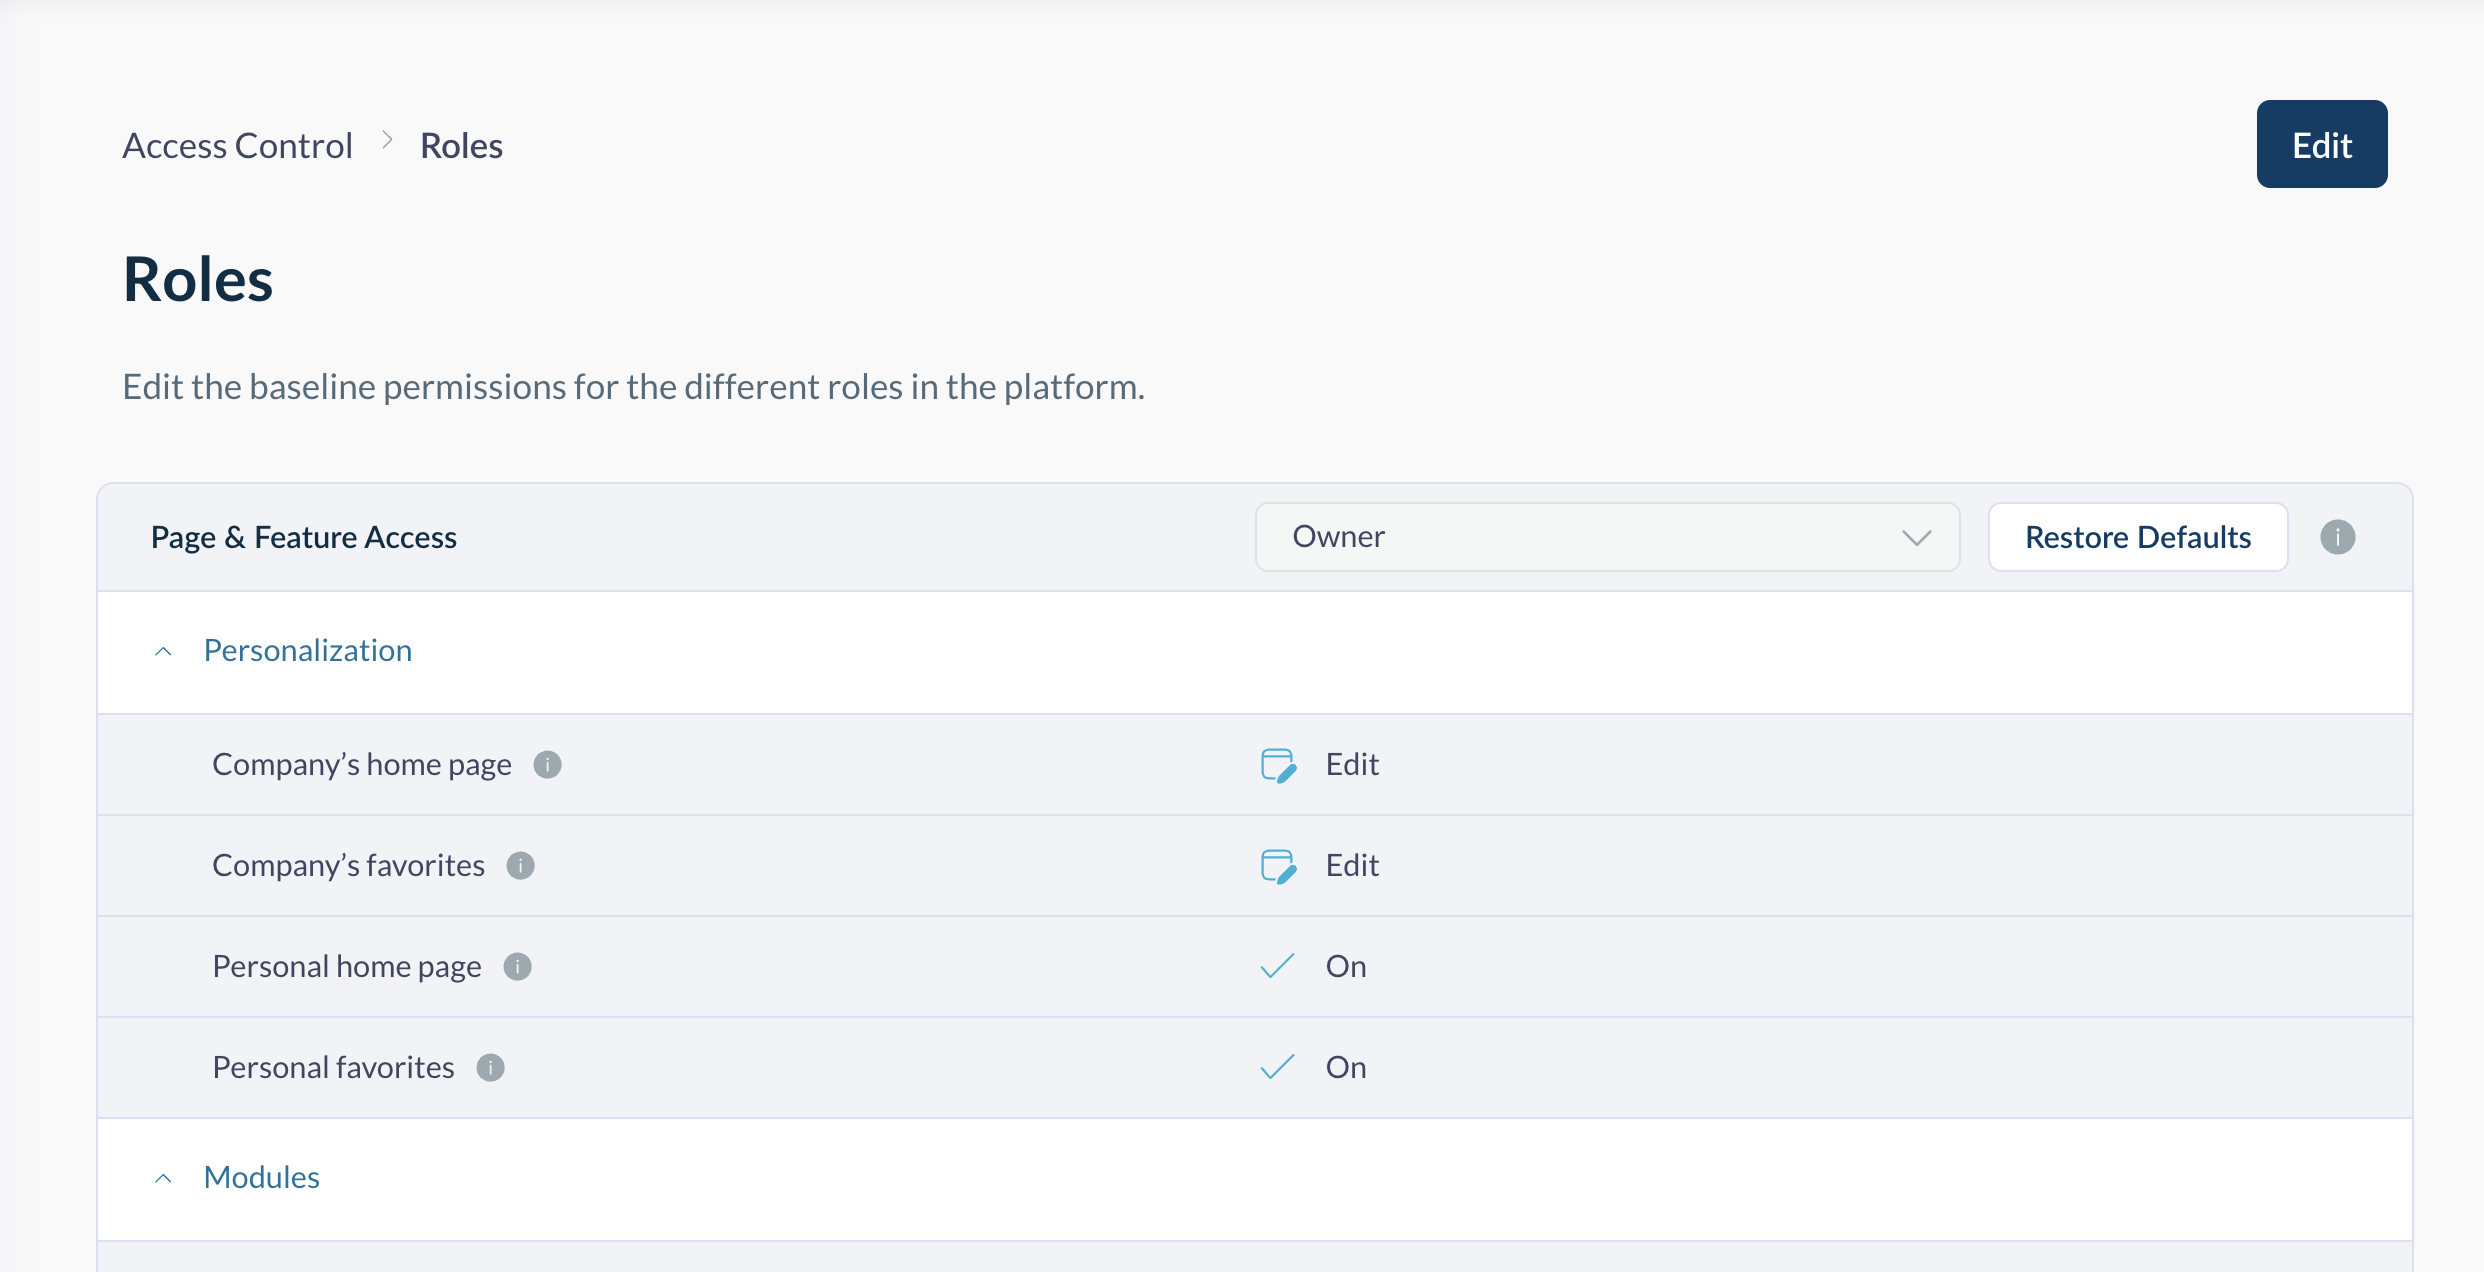
Navigate to Access Control > Roles. There you will see a selected role and a list of permissions for the given role. You can switch between roles to view each role's permissions. To edit please click the Edit button in the upper right hand corner of the screen. You can always reset a role to its default permissions by clicking the Restore Defaults button.
Updated 5 months ago