⚠️ Troubleshooting Dashboards
You may notice that data is missing or certain charts are empty. This is a good indicator that you haven't connected all of your data to Faros yet.
Relevant Data per Faros Module
Value Stream Module
- Incident data (e.g. PagerDuty) is connected through source or a transform feed.
- Deployments are connected through sending deployment events to Faros
- Version Control data (e.g. Github) - connected through a source.
Engineering Productivity Module
- Version Control data (e.g. Github) is connected through a source.
- Ticket Management data (e.g. Jira) is connected through a source.
Refresh
You may notice that the minute new data is available in Faros, whether that's from a change you've made in the UI or from a source re-syncing, the dashboards are not automatically updated. Dashboards operate similarly to sources. They have a scheduled refresh every few hours. However, if you would like to see your updated dashboards sooner you can force a dashboard sync.
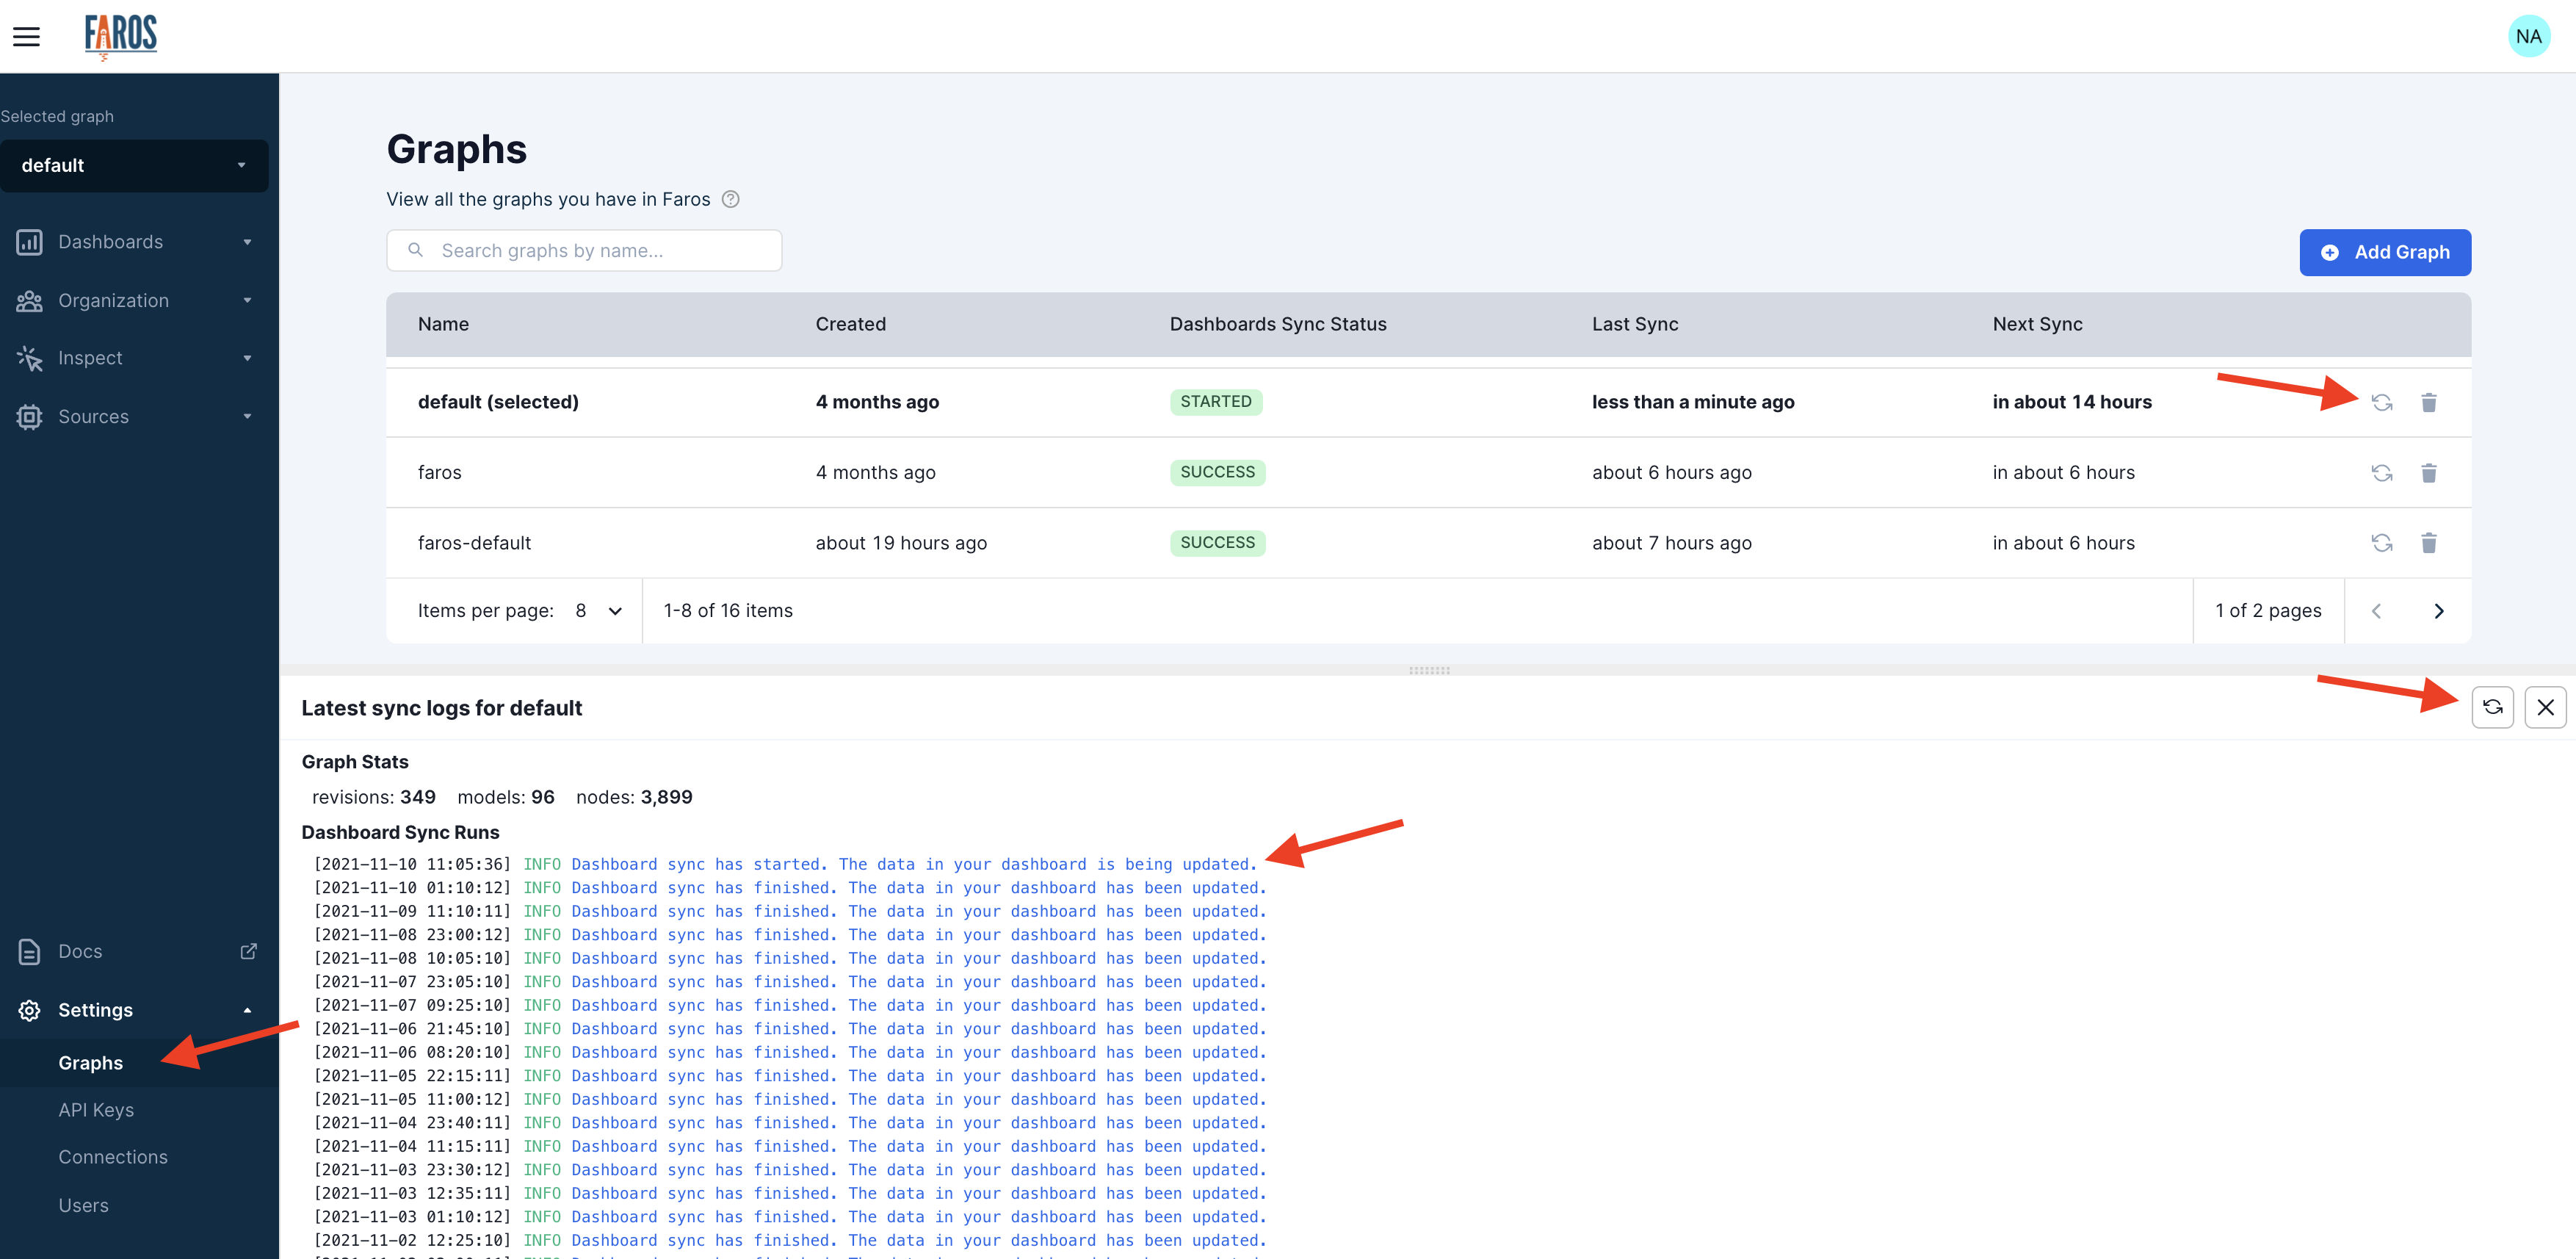
To do this, navigate to the Graphs page found in the Settings section. Here you'll want to find the current selected graph. You'll be able to see when the last sync occurred and verify the sync status was successful. To force a re-sync select the refresh icon in the graphs table.
Next, click on the graph. You'll see logs pop up at the bottom of the page. Here you can see when your graph was last synced. You'll need to hit the refresh icon in the top right of the logs to update them. These logs will tell you when your graph is being updated, and when the sync has finished. It may take up to 5 minutes for the sync to complete.

Updated 5 months ago
