
Custom Flows
A flow is a series of steps that together represent a process. Faros allows you to build your own flows, and automatically computes various flow metrics so that you can analyze bottlenecks in your process. For instance, you might express an incident resolution process or a deployment process as a Faros flow in order to compute MTTR and Lead Time metrics.
Default Flows
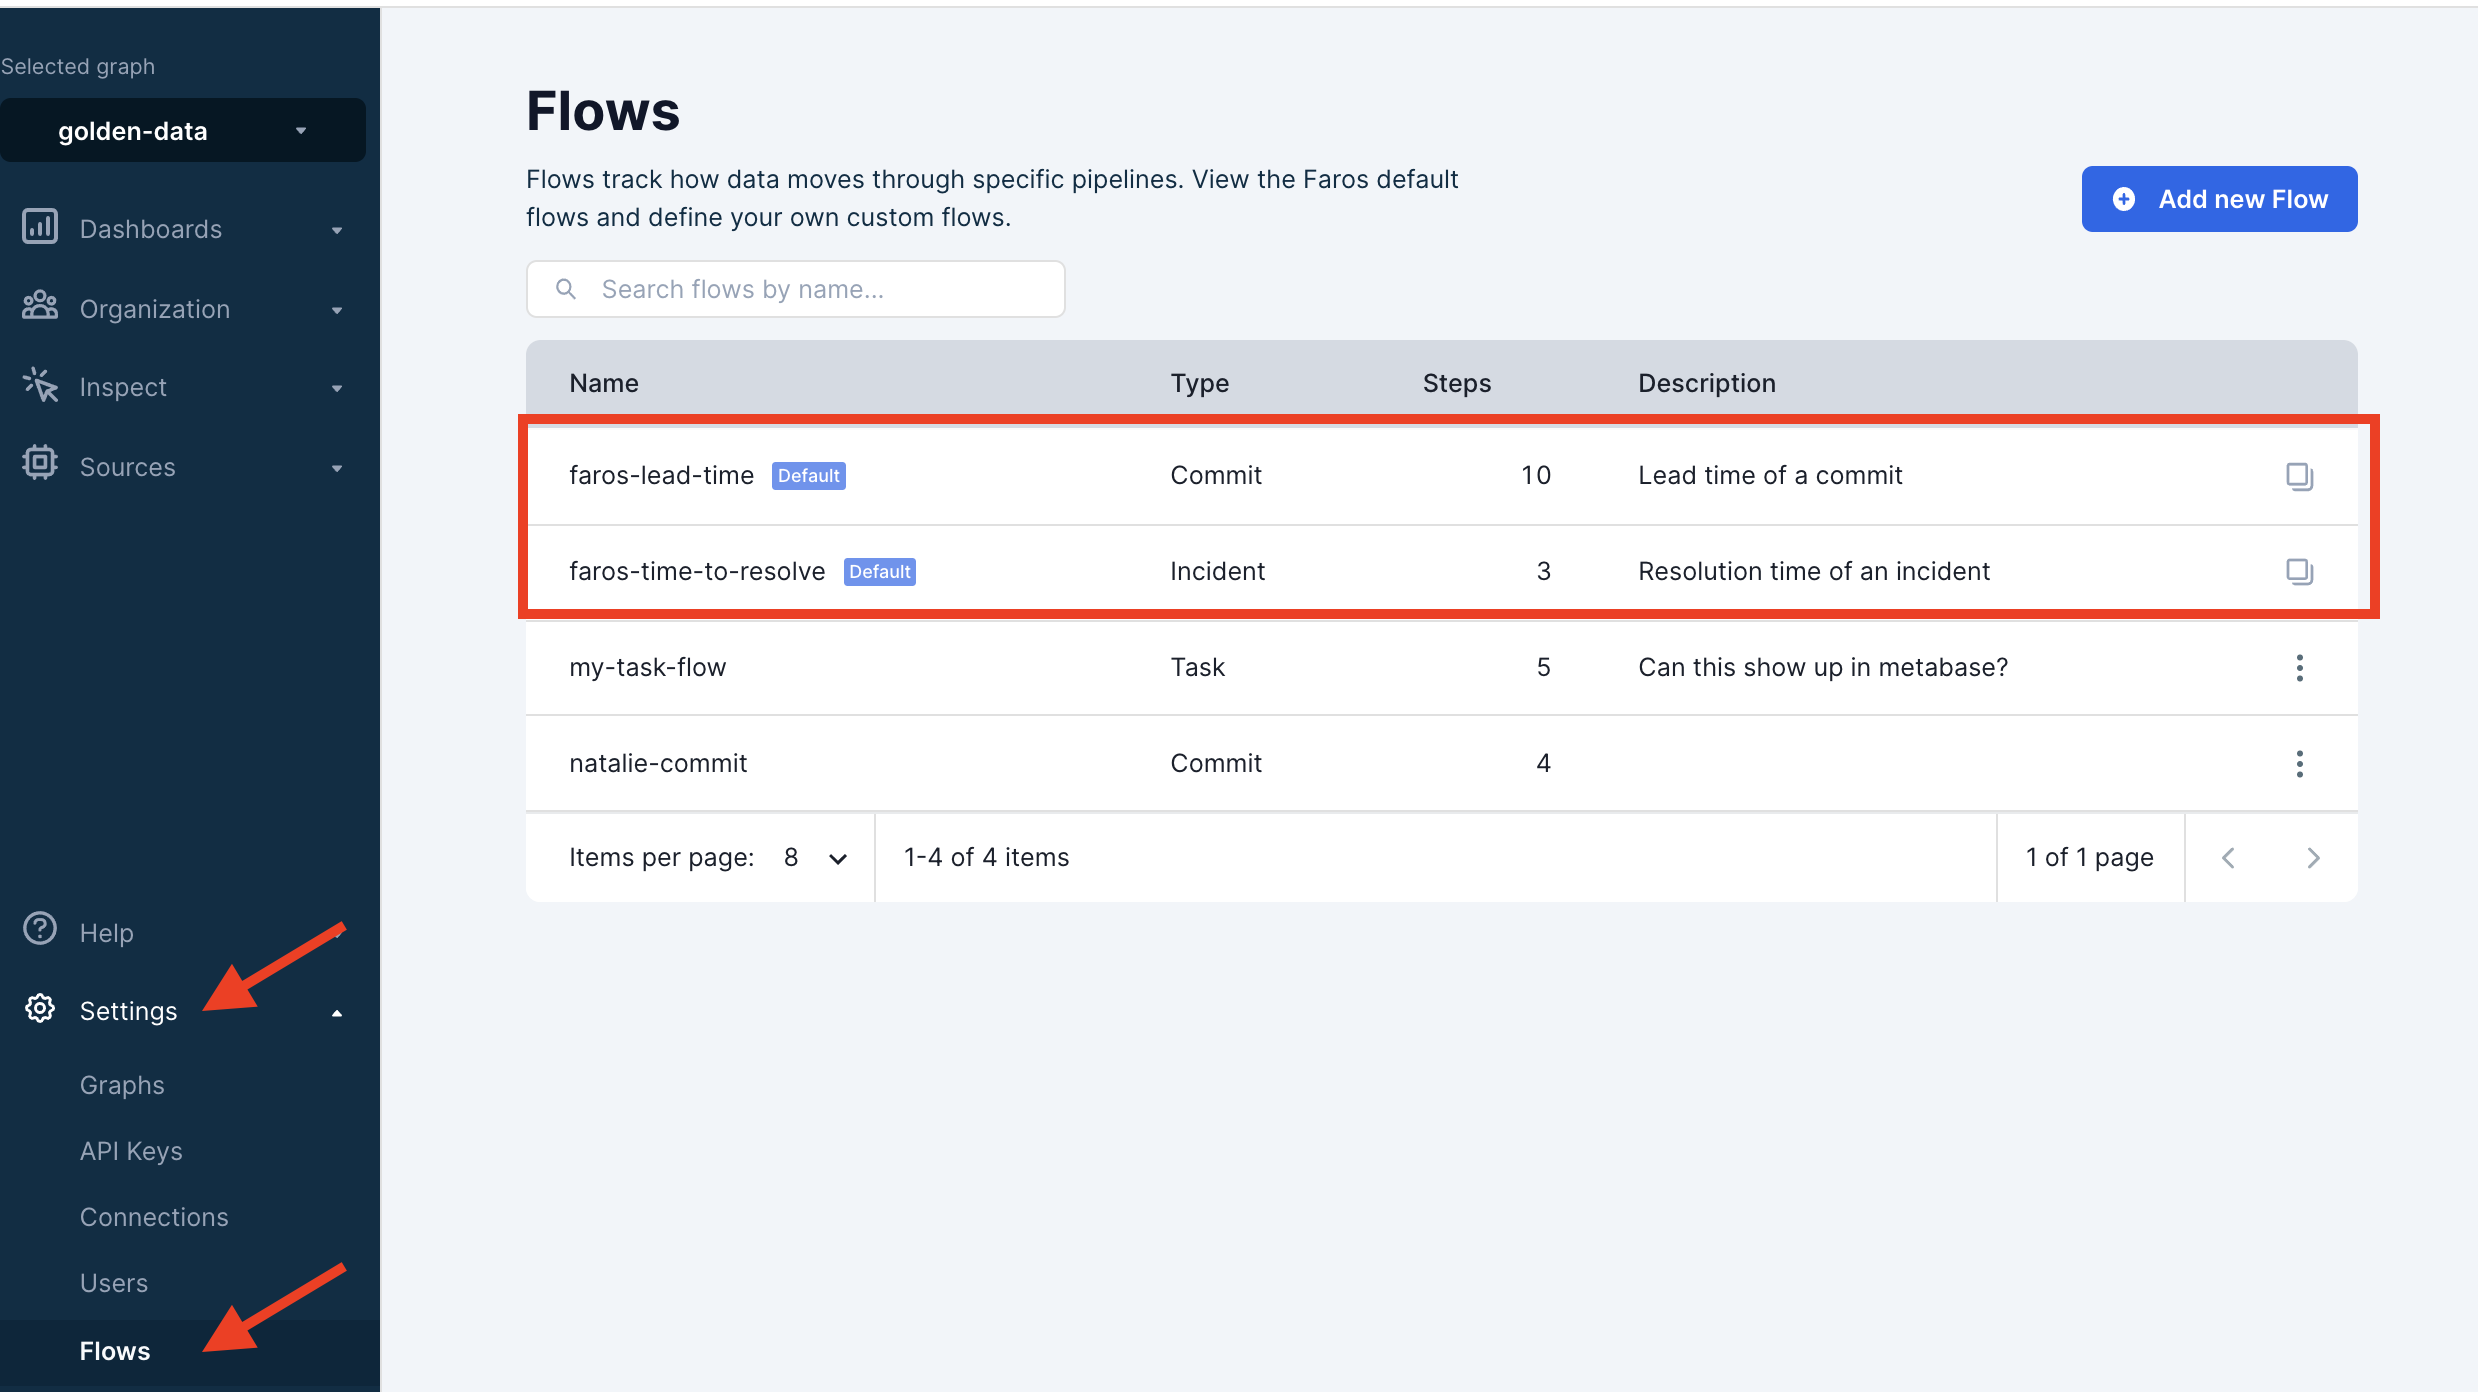
There are certain default flows that Faros provides out of the box: Lead Time and Time to Resolution. You may be familiar with these as they are part of the key DORA metrics.
-
Lead Time : the time it takes to get code from from development to in front of a customer.
-
Time to resolution : the amount of time it takes to resolve an incident.
You can see these default flows listed on your Flows page under Settings.
Defining a Flow
Clicking on any flow will display its definition. A flow is comprised of steps and spans. A step represents an event that occurs, while a span is the time block between two steps. For example, we define Time to Resolve as the process of tracking an incident through Creation, Acknowledgement and Resolution steps.

Building a Flow
Say we're building a flow to represent our Jira workflow which tracks tickets through different stages.
1. Select the Object
First we'll select the entity that we want to trace through the steps. For this case that will be a task.

2. Create the Steps
Next we'll decide which steps we want in our flow and select them from the dropdown. A step cannot be used more than once per flow. If you would like to use a step that you don't see, contact us and Faros and we'll work with you to build your flow.

3. Name the Spans
Finally, we'll go through and name our spans. Remember a span represents the time between 2 steps. Spans are what you will build charts on top of so naming here is important.

Flow Insights
Once your flows are created navigate to the Flow Metrics dashboard by selecting Dashboards > View All > Faros Reports > Getting Started
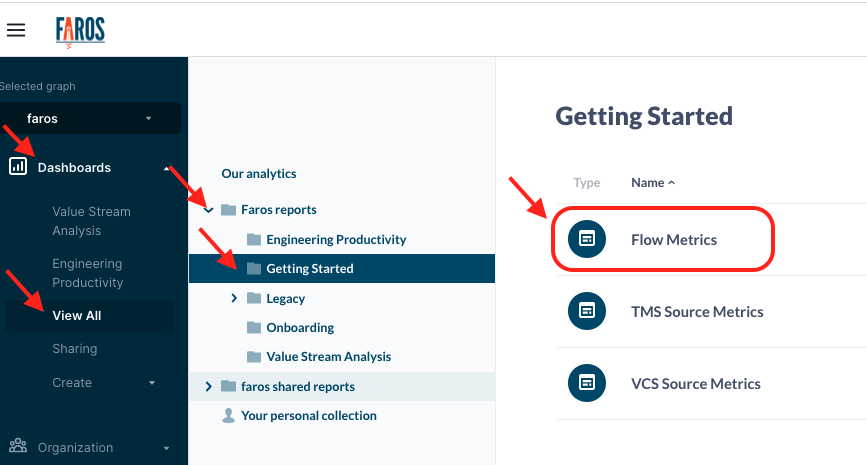
This dashboard will show you an overview of the insights available to you for each of your flows. Change the selected flow by editing the Flow filter in the upper left corner. If your data hasn't populated to the dashboard, try refreshing the graph.
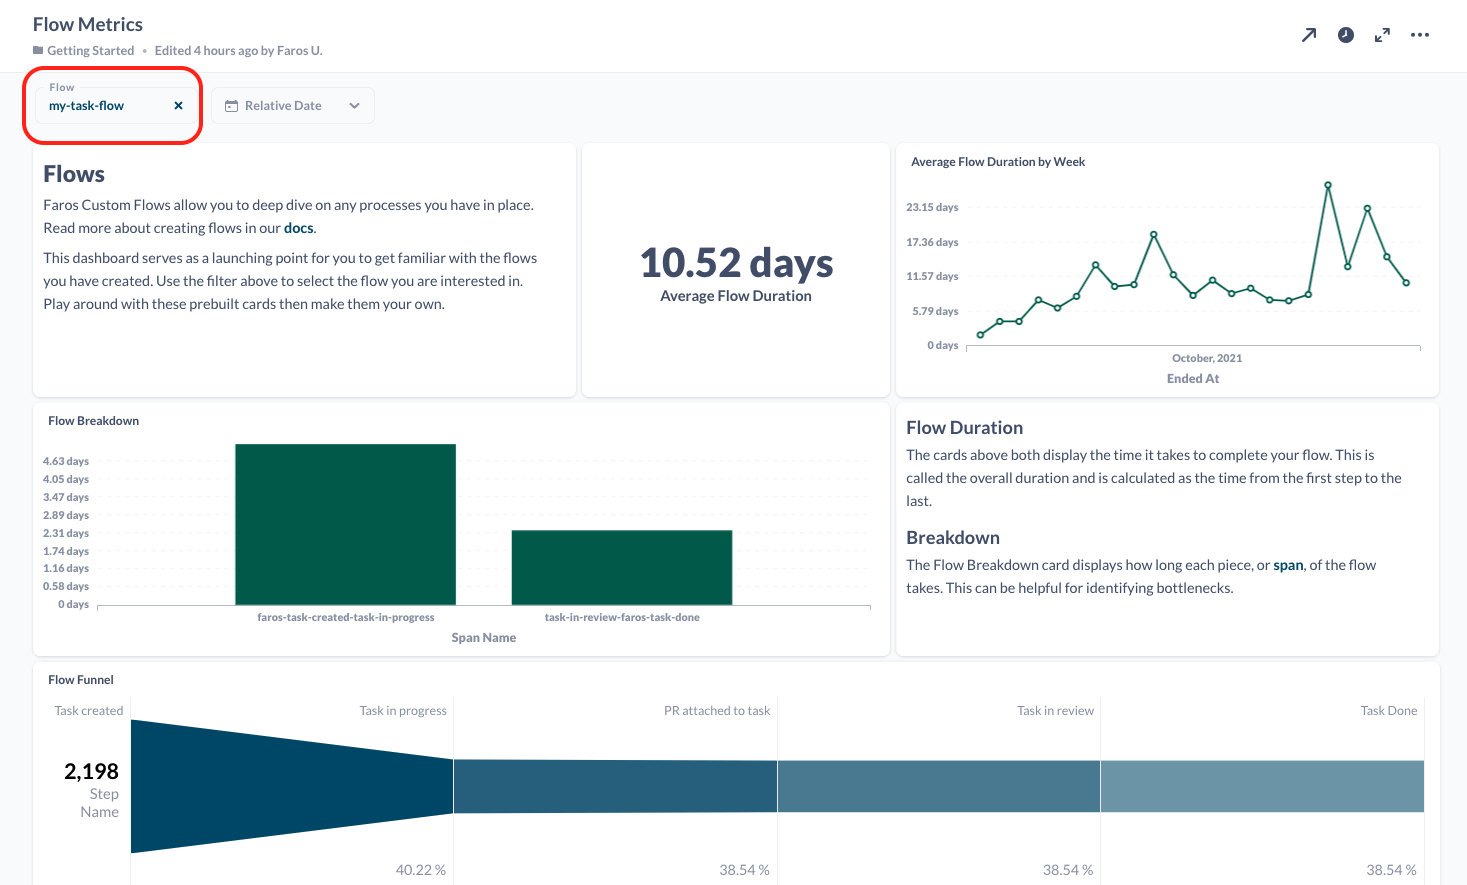
While this dashboard walks you through some visualizations for your flow data, it's always possible to customize your own cards and dashboards to create a view perfectly tailored to your company's needs. See 🔎 Custom Dashboards for more details.
Business Hours (Beta)
Flow duration can be tracked using overall time or business hours. Business hours communicate how much time was spent during normal hours of operation. For example, a task started at 3 p.m. on a Friday and completed at 10 a.m. on a Monday would have a duration of 3 business hours but 67 overall hours.
Using the Flows API
In some cases you may wish to directly use the custom flows API to build your flow, since it offers more flexibility than the UI. If that's the case, here is a quick guide on using the flows API directly.
Updated 5 months ago